Momentum Trading Strategy

Notes

Short lessons on momentum trading, every day.

Every note from Substack, in one place: risk, setups, leading stocks, market conditions and the mindset behind them. Search them, browse by topic, or filter by stock.

Showing 261–280 of 1222 notes

View on Substack ↗

Sometimes the Stocks Tell You Before the Indexes Do

In my last note, I talked about why understanding the general market, sectors, and industry groups matters.

But that is only half of my process.

I also agree with Minervini that sometimes the best way to understand the health of the market is to look directly at the individual stocks.

He wrote that constantly updating your list of leading stocks can:

“sharpen your feel for the overall health and quality of the market.”

That is exactly what this short video shows.

When you have the right stock screens, you can often see leadership, rotation, and deterioration developing from the bottom up before it becomes obvious in the indexes or sector charts.

Minervini also points out that many of the best leaders can bottom and begin moving before their sectors, and by the time everyone realizes a group is hot, the strongest stocks may have already made significant moves.

That is why I don’t choose between top-down or bottom-up analysis.

I do both.

Market → Sectors → Industry Groups → Stocks

And then:

Stocks → Industry Groups → Sectors → Market

Sometimes the first clue that the market is changing is simply what starts showing up on your stock screens.

Click to watch the full video:

ArticleHow to Spot the Market’s Next Leading Industry Groups Before the Crowd
View on Substack ↗

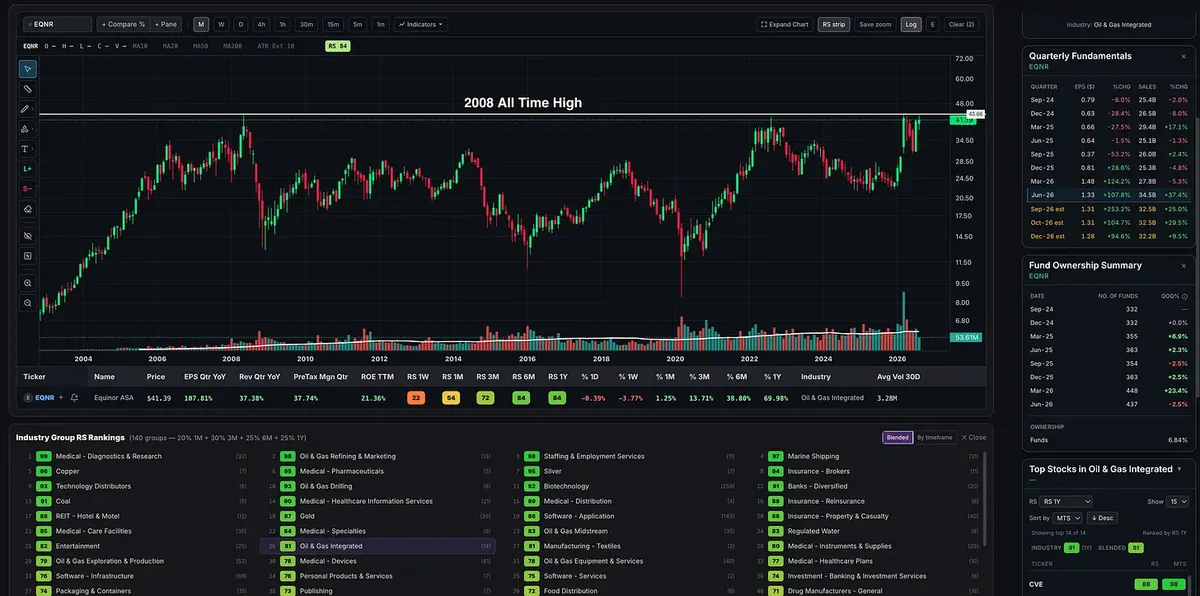
EQNR | Equinor

The chartist in me can’t help but notice EQNR here.

On the monthly chart, EQNR is approaching the major $42–$44 resistance zone that dates back to its 2008 all-time high. It challenged roughly the same area again in 2022 and is now back near it once more.

What makes this attempt interesting is the structure underneath it. Price is tightening while forming higher lows, and the weekly and daily charts show the same character.

Could it reject again? Absolutely.

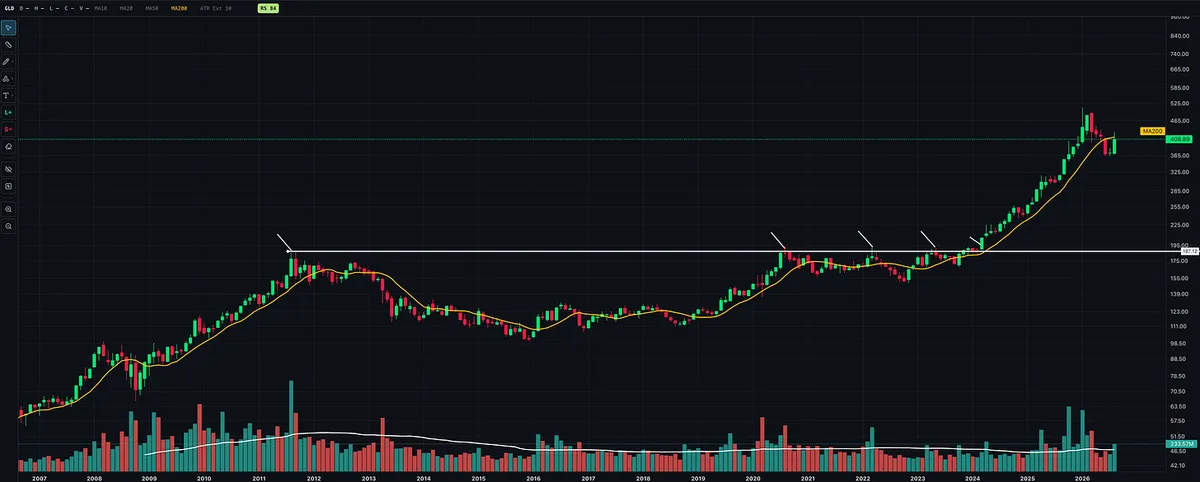
But some of the biggest technical moves begin when price finally breaks free from a massive multi-year base. Gold is a great example. It repeatedly challenged its old highs after the 2011 peak before finally breaking decisively into new-high territory in 2024.

The fundamentals also give us a reason to pay attention:

  • EPS growth: +108%

  • Sales growth: +37%

  • Pre-tax margins: 37.7%

  • ROE: 21.4%

  • 1-year RS: 84

  • Industry RS: 91

One energy name I’m keeping very close on the watchlist.

View on Substack ↗

The Trading Edge Most People Are Too Lazy to Build

William O’Neil found that roughly 3 out of every 4 stocks follow the direction of the general market.

He also found that approximately 37% of a stock’s price movement is tied to its industry group, with another 12% tied to its broader sector.

That means nearly 50% of a stock’s movement can be influenced by its industry group and sector, while more than 75% of stocks tend to move with the overall market.

This is exactly why I spend so much time every weekend studying the general market, sectors, and industry groups.

It gives me a much greater awareness of the environment I am trading in.

Over the last 20 years, I have seen the difference in my own trading when I consistently put in this work. I have also seen what happens during periods when I have slacked off.

The difference in my portfolio has been drastic.

Is this work exciting? No.

A lot of it is boring. A lot of it is monotonous. It means sitting down weekend after weekend, when the market is closed, reviewing charts, studying relative strength, identifying leadership, tracking deterioration, and trying to understand where money is flowing.

But sometimes the boring, repetitive work is exactly where the edge comes from.

And I know most traders are not doing it.

So many great traders across completely different disciplines have emphasized the importance of market awareness and preparation. Day traders, swing traders, position traders, and investors may approach the market differently, but they repeatedly come back to the same idea:

Know the environment you are operating in and do your homework.

So if you are not getting the results you want, ask yourself a simple question:

Are you actually putting in this work every weekend while the market is closed?

And if not, why not?

View on Substack ↗

The Reaction Matters More Than the News

One of the clearest signs of a market’s underlying health is how prices respond to news.

In a strong market, leading stocks and major indexes often absorb bad news and respond forcefully to positive surprises. Weak openings find buyers, early declines recover, and prices frequently finish near the highs of the day.

In a weak market, the opposite occurs. Even great news struggles to produce sustained gains, minor disappointments cause outsized damage, and promising morning rallies fade into weak closes.

One session proves very little, but when this behavior repeatedly appears across the indexes and leading stocks, it reveals whether demand or supply is in control.

The reaction tells you what kind of market you are in.

View on Substack ↗

Stop Managing Your Small Account Like a Billion-Dollar Fund

One of the most overlooked advantages in the market is having a smaller account.

We study legendary investors and traders such as Stanley Druckenmiller, Paul Tudor Jones, and Warren Buffett. We can learn tremendously from their principles, but copying how a multibillion-dollar portfolio must operate can cause retail investors to surrender one of their greatest structural advantages:

Speed and mobility.

Large institutions are oil tankers. You are a speedboat.

A large fund cannot move quickly into or out of many stocks without affecting the price. It must focus on highly liquid securities, build positions gradually, and unwind them carefully because institutional trading itself can create significant market impact.

Your account does not have those constraints.

You can:

  • Enter and exit positions quickly

  • Move into cash without explaining yourself to investors

  • Concentrate on your best opportunities

  • Trade smaller, liquid growth stocks that cannot meaningfully move the needle for a massive fund

  • Change exposure rapidly when market conditions change

This does not mean buying illiquid garbage, overtrading, or taking reckless risks. It means recognizing that your smaller size gives you an opportunity set and level of flexibility that large institutions simply do not have.

Many investors also try to construct their portfolios like Warren Buffett. His principles are invaluable, but Buffett has management access, relationships, and negotiated deal opportunities that most retail investors do not.

More importantly, Berkshire must put an enormous amount of capital to work. Buffett acknowledged this constraint himself in Berkshire’s 2016 shareholder letter:

“What is easy with millions, struggles with billions.”

That is the natural mathematics of scale.

A 10% return on $10 million is $1 million.

A 10% return on $100,000 is only $10,000.

This does not mean someone with $100,000 should gamble recklessly to chase an unrealistic return. It means that a skilled growth stock investor with a smaller account has the flexibility to pursue higher percentage growth in ways that may be impossible for a multibillion-dollar fund.

This is why I am surprised more investors do not take advantage of growth-stock strategies such as William O’Neil’s CANSLIM approach while they are still building their capital.

Focus on:

  • High Relative Strength

  • Strong earnings and sales growth

  • Leading industry groups

  • The strongest stocks within those groups

  • Sound Stage 2 setups

  • Proper entries, position sizing, and risk management

  • A healthy general market

The goal is not reckless speed. It is controlled compounding while your account is still small enough to remain fast and flexible.

As your capital grows, it is natural for percentage growth to slow. Your priorities may gradually shift toward diversification, capital preservation, income, and steadier returns.

There is nothing wrong with that.

But too many investors spend decades managing a small account like a pension fund, spreading their capital across slow-moving mega-cap and dividend stocks without ever taking advantage of the flexibility their size gives them.

Learn the principles from the market wizards.

But do not copy their constraints.

You are a speedboat. Stop steering it like an oil tanker.

View on Substack ↗

Never Buy a Stock Below Its 200-Day Moving Average

Stan Weinstein does not treat this as a preference.

It is a hard filter.

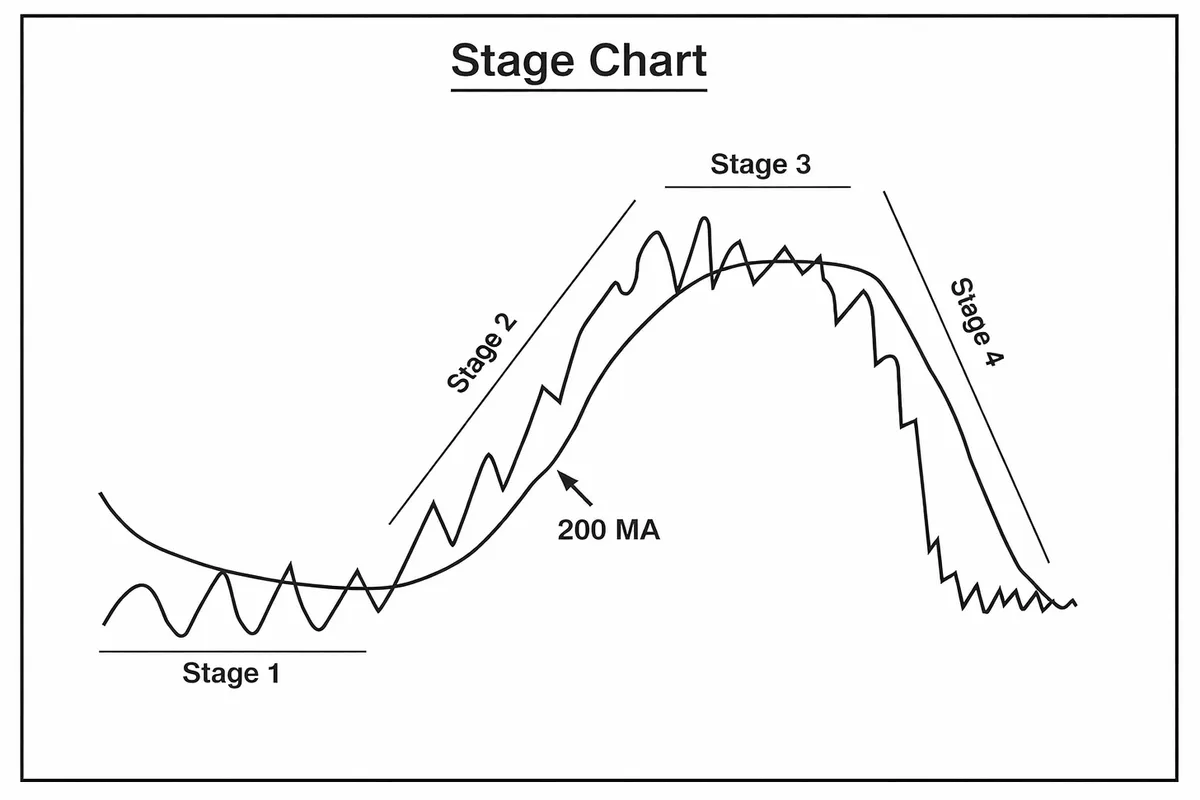
In his 1988 classic, Secrets for Profiting in Bull and Bear Markets, Weinstein built Stage Analysis around the 30-week moving average, which is roughly equivalent to the 150-day moving average.

In later years, Weinstein shifted his primary long-term trend filter to the 40-week moving average, or approximately the 200-day moving average.

The exact moving average changed. The principle did not.

The 200-day provides a slower, more conservative view of the primary trend and is one of the most widely followed long-term moving averages in the market.

The four stages through the 200-day lens:

  • Stage 1: Price builds a base around a flattening 200-day moving average.

  • Stage 2: Price breaks above resistance and advances above a rising 200-day.

  • Stage 3: Price becomes wide and erratic as the 200-day begins to flatten.

  • Stage 4: Price declines beneath a falling 200-day moving average.

Stage Analysis in one rule:

Never buy below a declining 200-day moving average. Never short above a rising 200-day moving average.

But remember, the 200-day is a filter, not an entry signal.

You still need a sound setup with clearly defined risk and proper position sizing once the conditions of Stage 2 are met. Even short-term swing traders can improve their probabilities by aligning short-term setups with this longer-term trend filter.

The 200-day does not tell you exactly when to buy. It helps tell you when not to buy.

View on Substack ↗

William O’Neil Warned Us Decades Ago: More Information Is Not the Answer

Decades ago, William O’Neil wrote:

“Lack of information is no longer a viable excuse.”

Even then, O’Neil recognized that individual investors had access to more information than ever. The real challenge was separating relevant facts from the endless opinions, personal biases, and stock promotions competing for their attention.

Now add social media, YouTube, podcasts, Discord, newsletters, financial influencers, and AI-generated analysis.

His warning has never been more relevant.

The problem is not a lack of information. It is determining what deserves your attention and what should be ignored.

Opinions are infinite, but the tape is the only truth.

You do not need more input.

You need rules for what gets ignored.

Focus on:

  • High Relative Strength

  • Strong earnings and sales growth

  • A confirmed market uptrend (Stage 2!)

  • Leading industry groups

  • The strongest stocks within those groups

  • Sound setups and proper buy points

  • CAN SLIM characteristics

Build your process. Run it. Mute the rest.

View on Substack ↗

Downside Pressure Just Hit Its Worst Level of August

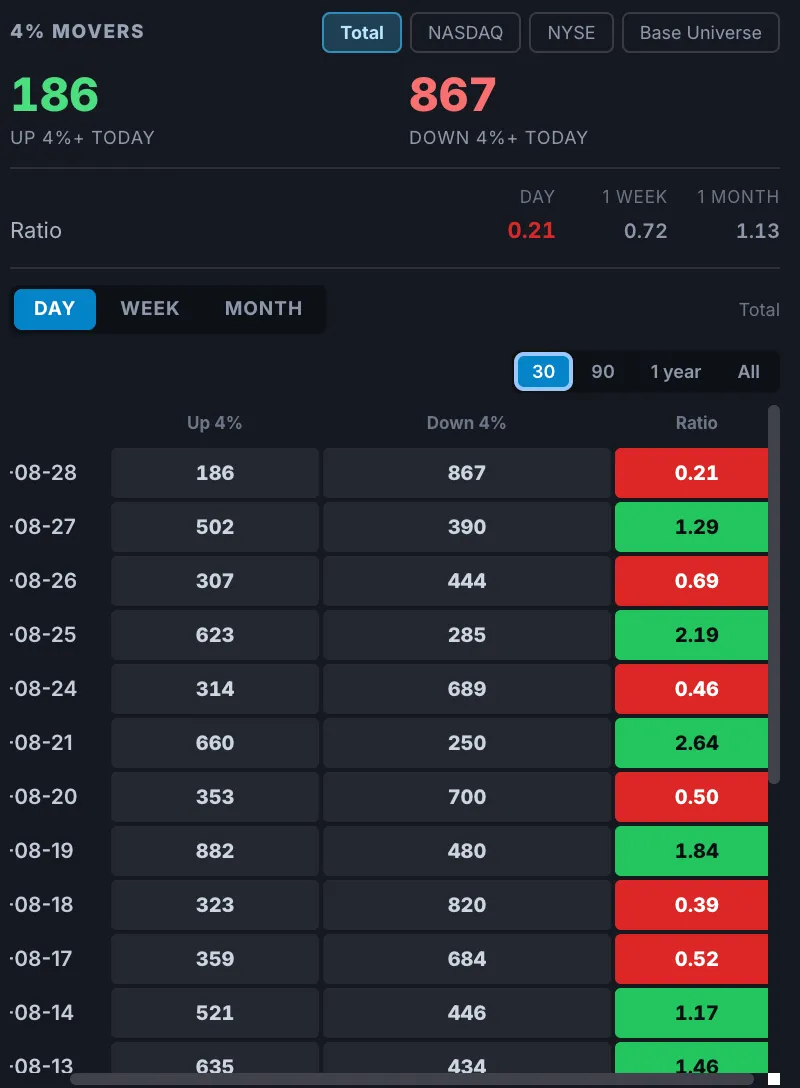
Today produced the weakest 4% mover ratio we have seen all month across the combined Nasdaq and NYSE universe.

  • 186 stocks advanced 4% or more

  • 867 stocks declined 4% or more

  • 4% mover ratio: 0.21

That means nearly five stocks fell at least 4% for every one stock that gained 4% or more.

Of the 1,053 stocks that moved at least 4% in either direction, approximately 82% were decliners, while only 18% were advancers.

The 4% mover ratio is a short-term momentum gauge that measures whether significant individual-stock moves are concentrated to the upside or downside, helping us identify buying or selling pressure beneath the indexes.

View on Substack ↗

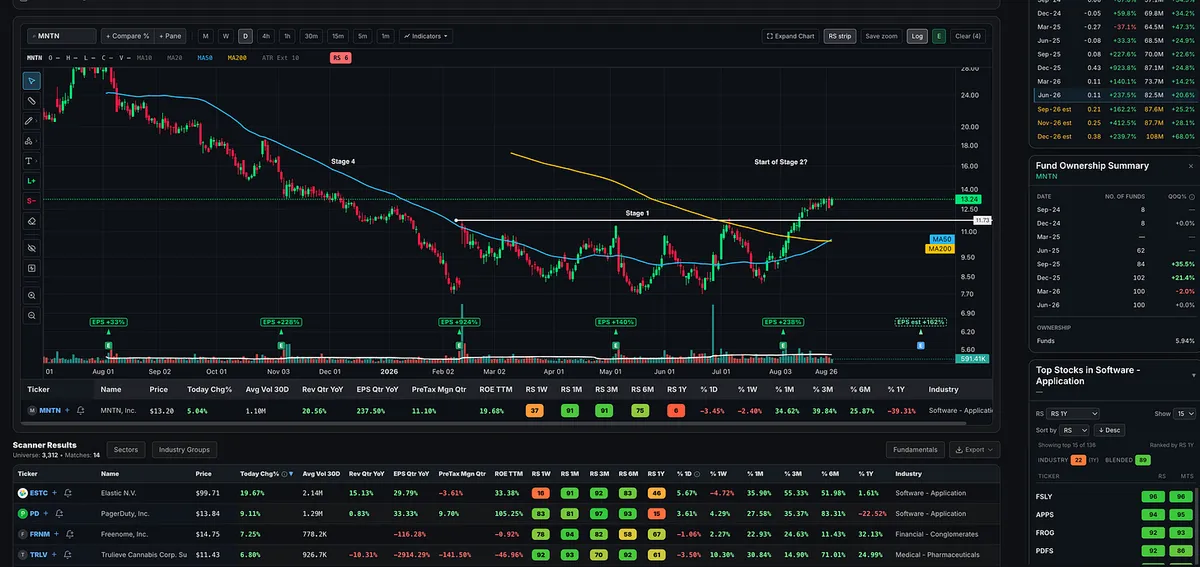
Stage Analysis in Action: Is MNTN Entering a New Stage 2 Uptrend?

Looking through today’s market movers, MNTN stood out as a great real-time example of Stan Weinstein’s Stage Analysis at work.

The chart first shows a clear Stage 4 decline, with lower highs, lower lows, price below declining moving averages, and the moving averages themselves trending downward.

Then the character begins to change.

Price stops declining and consolidates sideways for several months. The moving averages gradually flatten, selling pressure appears to ease, and price begins forming higher lows and higher highs. This is the type of character change that can signal a transition out of Stage 1 and the potential beginning of a new Stage 2 advance.

That does not automatically make Stage 2 fully confirmed. Ideally, we still want to see price break decisively above the base and resistance, supported by a rising long-term moving average, expanding volume on up moves, and improving relative strength.

For a deeper understanding of this framework, I highly recommend Stan Weinstein’s Secrets for Profiting in Bull and Bear Markets. It is one of the most foundational books for trend and momentum traders.

I also wrote a short article to Weinstein’s Stage Analysis that you can read here:

https://tradingmomentum.substack.com/p/stan-weinsteins-stage-analysis-the

ArticleStan Weinstein’s Stage Analysis: The Complete Guide to Understanding Market Structure
View on Substack ↗

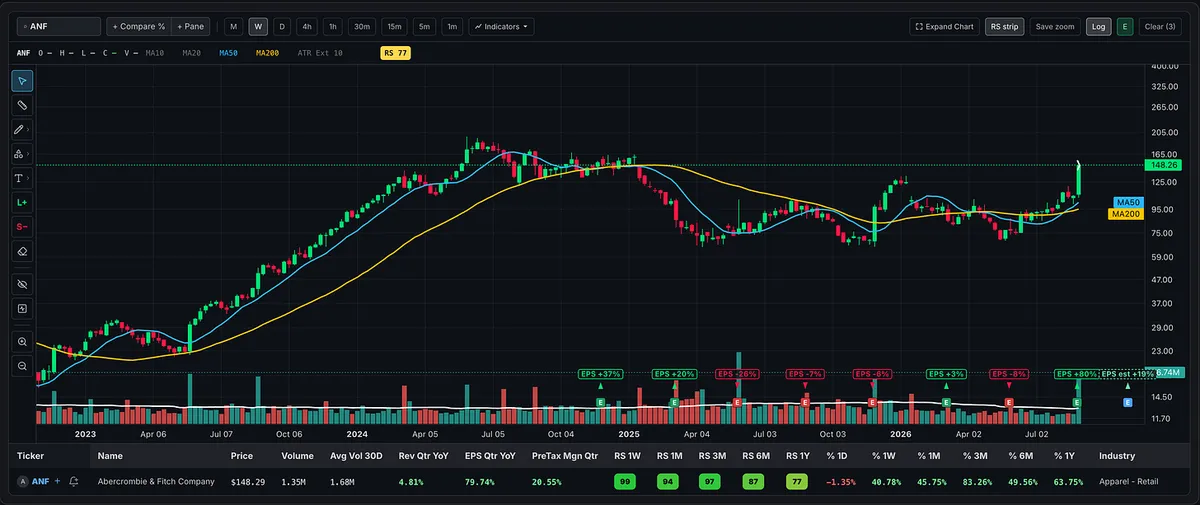
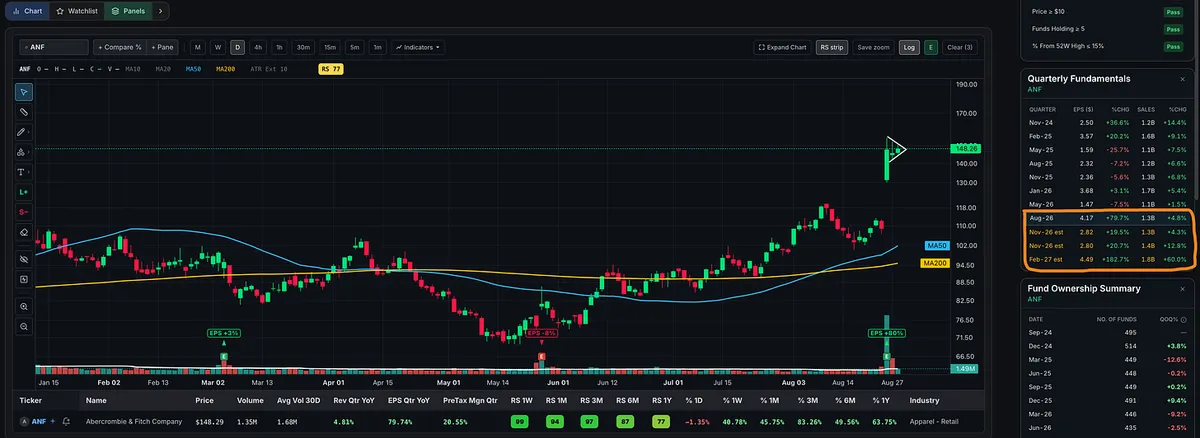
ANF, Are You Back?

ANF was one of the market’s great trades in 2023 and 2024 before topping out and entering a stage 4 decline.

This week, it delivered a massive earnings episodic pivot on heavy volume. Price has held the gap and is now tightening into what looks like a developing pennant near the highs.

The latest quarter received a meaningful boost from tariff refunds, but forward estimates still point toward renewed earnings growth and an improving sales outlook. That makes this potential turnaround worth watching.

We will see whether the fundamentals continue to improve and price confirms. I’m a sucker for flags and pennants, and ANF has my attention.

View on Substack ↗

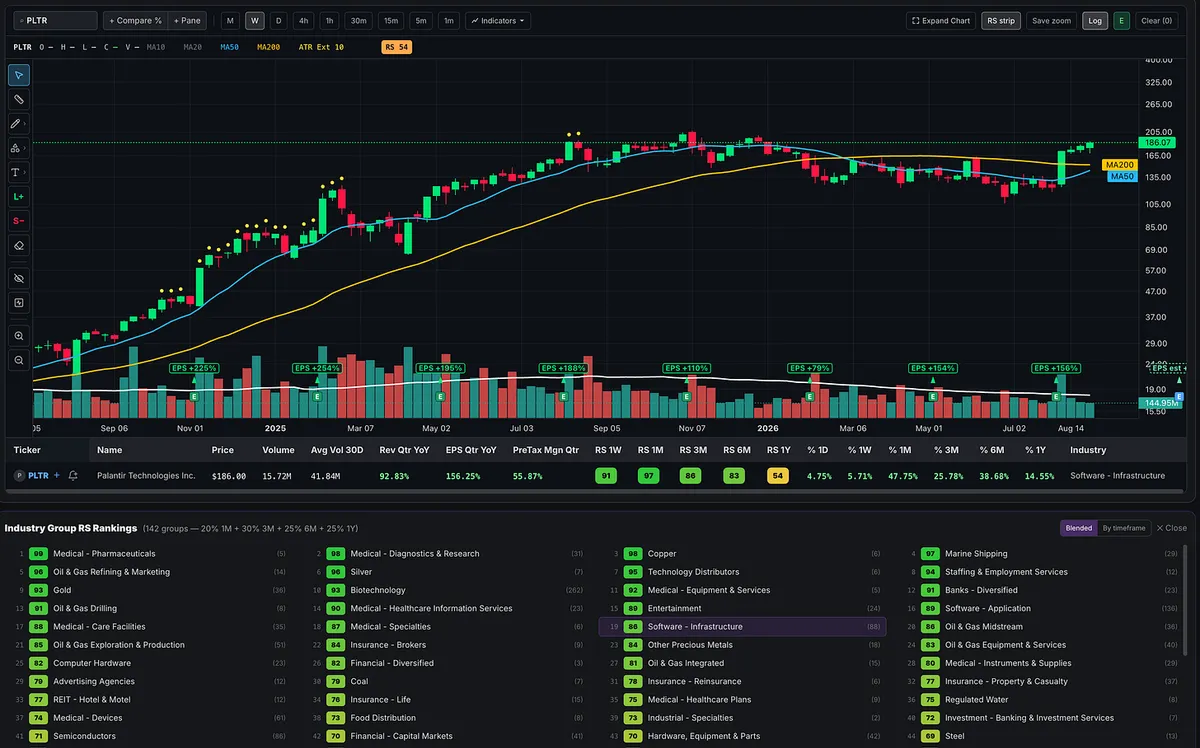
Remember When AI Was Supposed to Kill Software?

Just a few months ago, everyone was convinced that AI was going to destroy the software industry.

Now software stocks are delivering some of the market’s strongest moves and breaking out again.

Markets change quickly. Price tells the truth.

Looks like software is back.

View on Substack ↗

Great Fundamentals Can Still Be a Horrible Buy

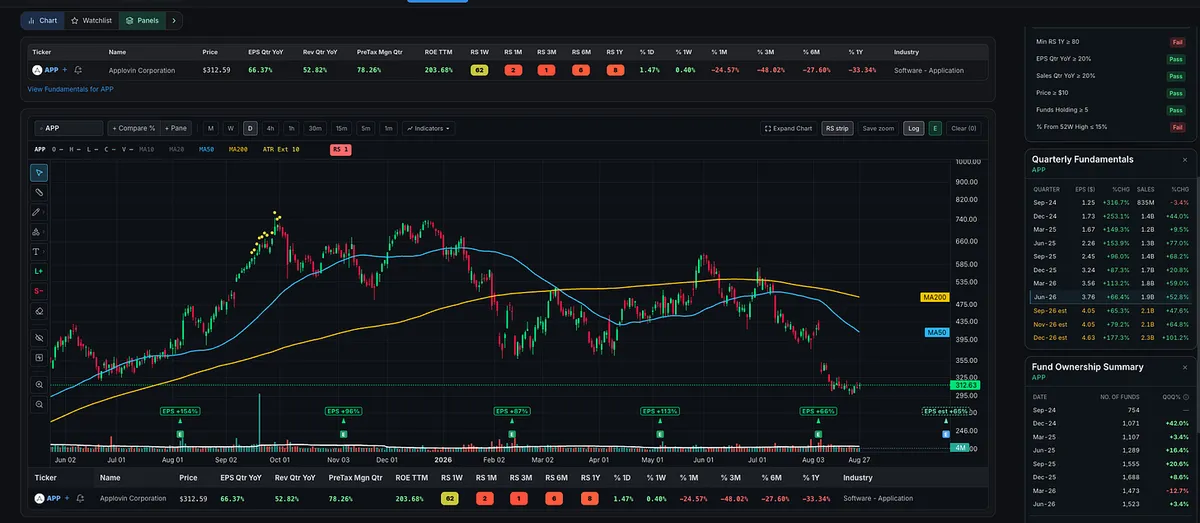
APP is a perfect example of why growth-stock investors need both fundamentals and price action.

The company’s numbers look exceptional:

  • Quarterly EPS growth: +66%

  • Quarterly sales growth: +53%

  • Pretax margin: 78%

  • ROE: 204%

These are exactly the types of fundamentals I look for.

But great fundamentals alone do not make a stock a great buy.

APP currently has a declining 50-day and 200-day moving average, an RS Rating of 8, and a price chart characterized by lower highs and lower lows. That is the complete opposite of the price action growth-stock and momentum traders should be looking for.

APP had several great tradable runs throughout 2023, 2024, and 2025. During those advances, price was above the 50-day and 200-day moving averages, with both moving averages trending higher.

The fundamentals were being confirmed by the price action.

That confirmation does not exist today.

I’m not saying APP cannot eventually have another strong run. But in its current technical condition, it is not a stock I would want to own. The last time its chart looked this weak was in 2022.

This is why I require both:

Strong fundamentals identify the companies with potential.

Strong price action confirms when the market agrees.

A great company can still be a horrible stock to buy at the wrong time.

View on Substack ↗

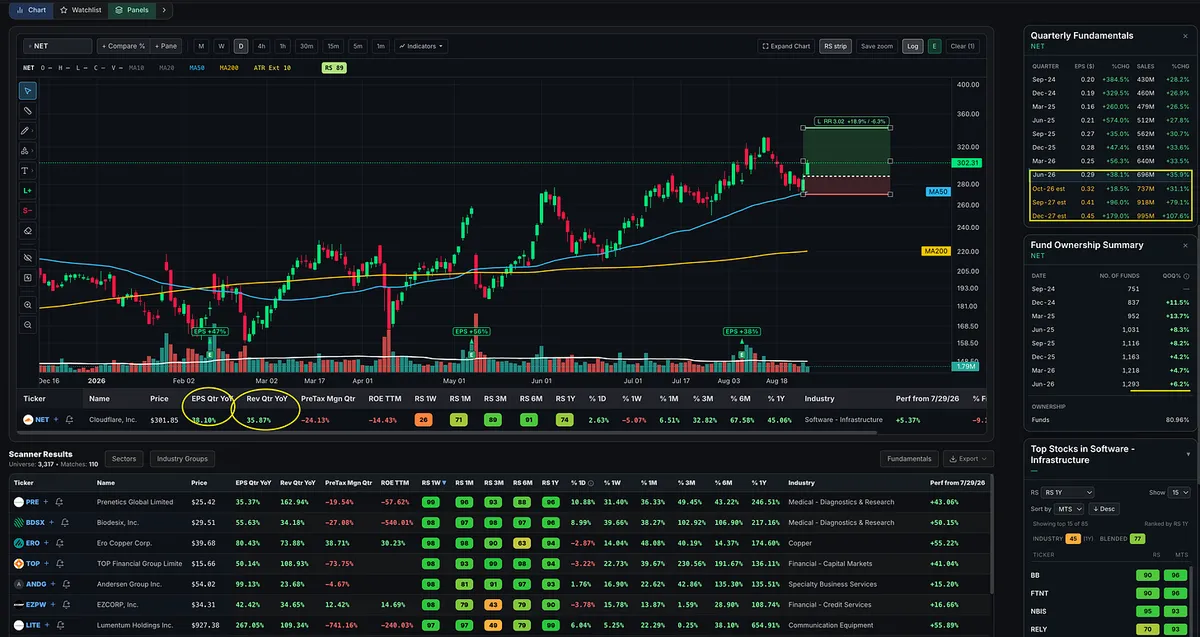
Anyone buy NET?

I like the earnings and sales growth on $NET.

  • EPS +38%.

  • Sales +35%.

  • Estimates look like they're accelerating on the sales side too.

  • Fund ownership is rising quarter after quarter.

  • Strong RS

I would like to see ROE or pretax margins strong, the way O'Neil talks about in his book. These aren't.

The other positives plus a low-risk, high-reward pullback off the 50-day still make this a great trade.

View on Substack ↗

Every Market Cycle Has a “Big Stock.” But the Real Clue Is Usually the Industry Group Behind It.

The market’s biggest winners rarely emerge alone. They are usually part of an industry group benefiting from a powerful new fundamental trend.

2023: AI Compute and Semiconductors

This marked the beginning of a new bull market and the emergence of the generative AI theme.

Big leaders:

  • $NVDA | Nvidia

  • $SMCI | Super Micro Computer

NVDA became the face of the cycle, but the leadership was much broader. Chips, servers, networking equipment, and the entire data-center buildout were beginning to move.

2024: AI Software, Data Platforms, and Power

Leadership expanded from companies building the AI infrastructure to those finding ways to monetize and support it.

Big leaders:

  • $PLTR | Palantir

  • $APP | AppLovin

AI adoption spread into software, data platforms, advertising optimization, networking, and power generation. The theme was evolving, but the underlying driver remained the same.

2025: Memory, Storage, and the AI Data Stack

The market’s attention shifted toward the next major bottleneck. AI systems required enormous amounts of high-performance memory, flash storage, and data-center capacity.

Big leaders:

  • $SNDK | SanDisk

  • $WDC | Western Digital

  • $STX | Seagate Technology

  • $MU | Micron Technology

These became some of the market’s biggest winners as demand for AI memory and storage accelerated.

2026: The Memory Supercycle Continues

Leadership continued into 2026 and semiconductors remerged as a leading group rather than transitioning into an entirely new theme.

Leaders:

  • $SNDK | SanDisk

  • $MU | Micron Technology

  • $STX | Seagate Technology

  • $WDC | Western Digital

But don’t overlook what happened outside the dominant AI theme.

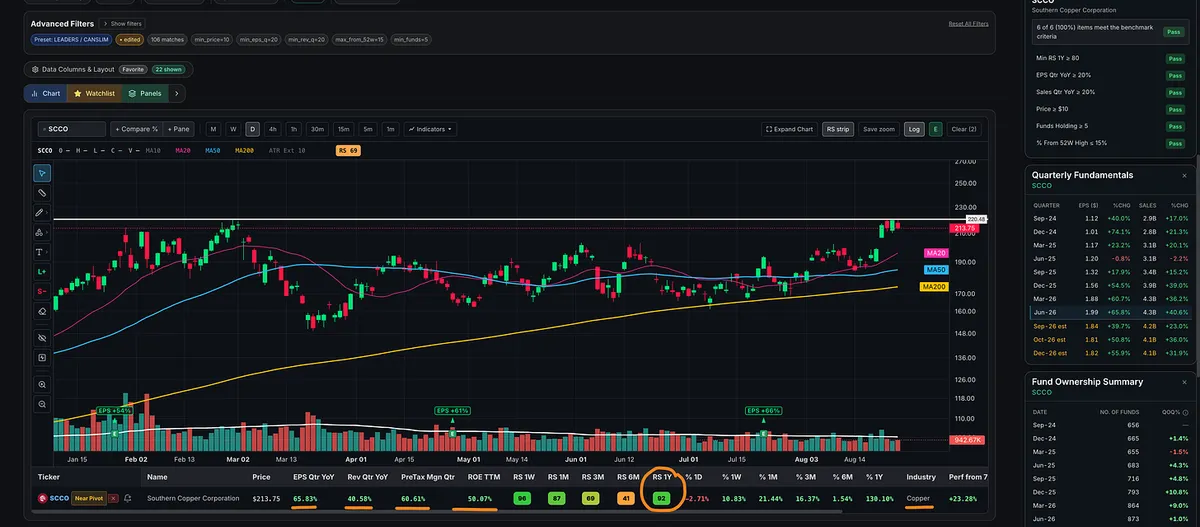
Metals and mining also developed into a major winning group during this bull market period 2024-2026. The market can have one dominant secular story while still producing powerful leadership in completely different areas.

The next monster winner probably won’t be random.

It will likely emerge from a strengthening industry group with accelerating earnings and sales, increasing institutional sponsorship, elite Relative Strength, and a chart that refuses to break.

2023: AI compute and semiconductors

2024: AI software, data platforms, and power

2025–2026: AI memory, storage, semis

Meanwhile, metals and mining proved that major leadership can still emerge outside the market’s primary theme.

What industry group do you think becomes the next true market leader for 2026–2027?

View on Substack ↗

Today’s Biggest Stock Movers 👀

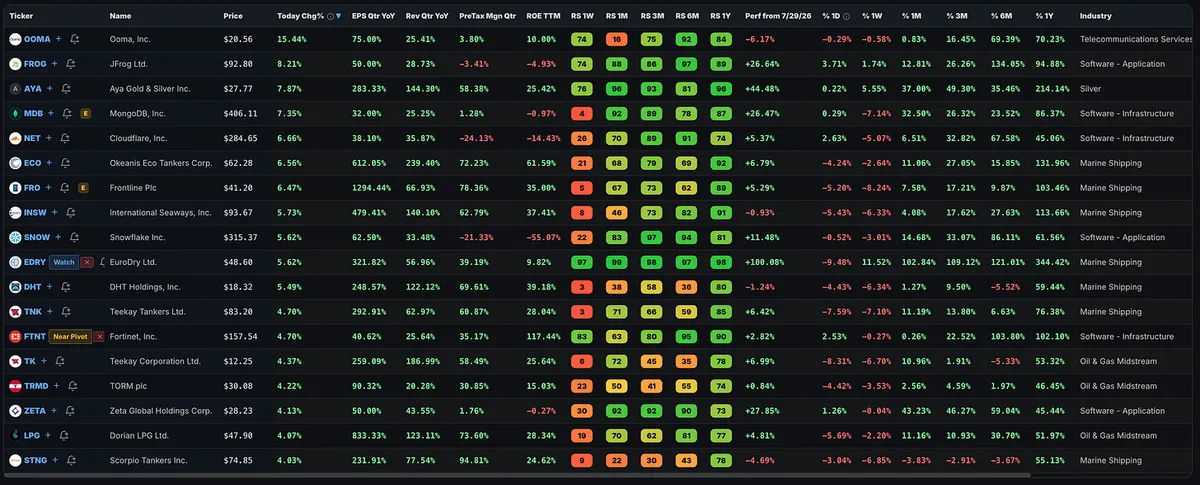
I screened for stocks that are:

  • Up at least 4% today

  • Priced at $10 or higher

  • Growing quarterly EPS by at least 20%

  • Growing quarterly sales by at least 20%

  • Within 15% of their 52-week highs

  • Listed on the Nasdaq or NYSE

Looking through the results, two groups are dominating the list:

🚢 Marine shipping

💻 Software

View on Substack ↗

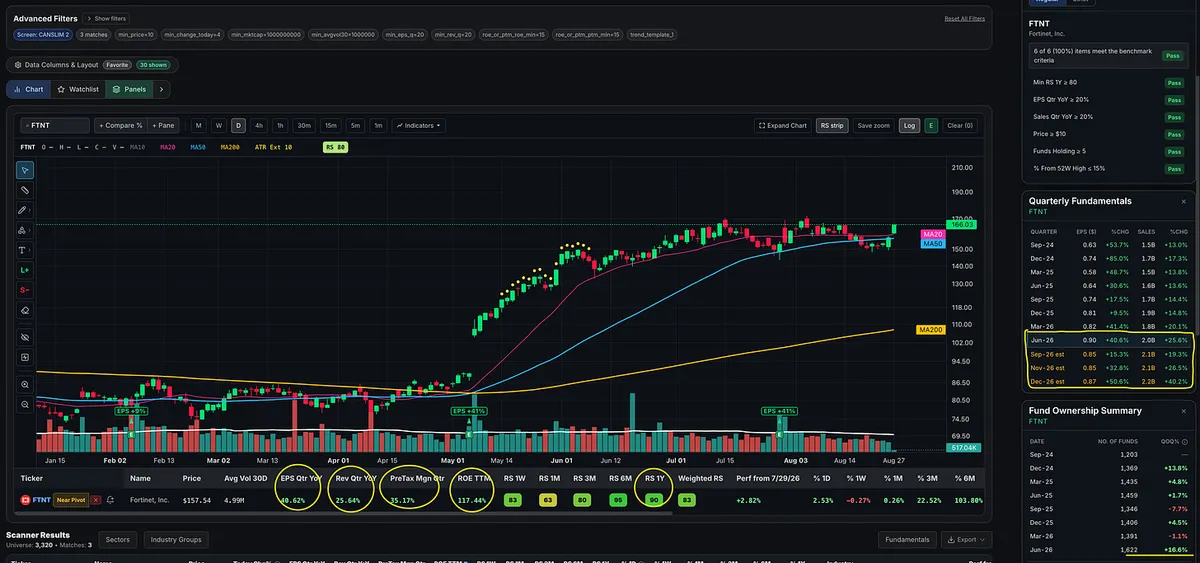
Hello, FTNT 👀

A lot of software stocks are moving today, and Fortinet is one of the names standing out.

  • Up nearly 5% today

  • 40% quarterly EPS growth

  • 25% quarterly sales growth

  • 35% pretax margins

  • 117% ROE

  • 90+ one-year Relative Strength

  • Fund ownership increased 16.6% last quarter

Big earnings. Big sales. Strong margins. Increasing institutional sponsorship.

Now FTNT is pushing back toward its recent highs.

View on Substack ↗

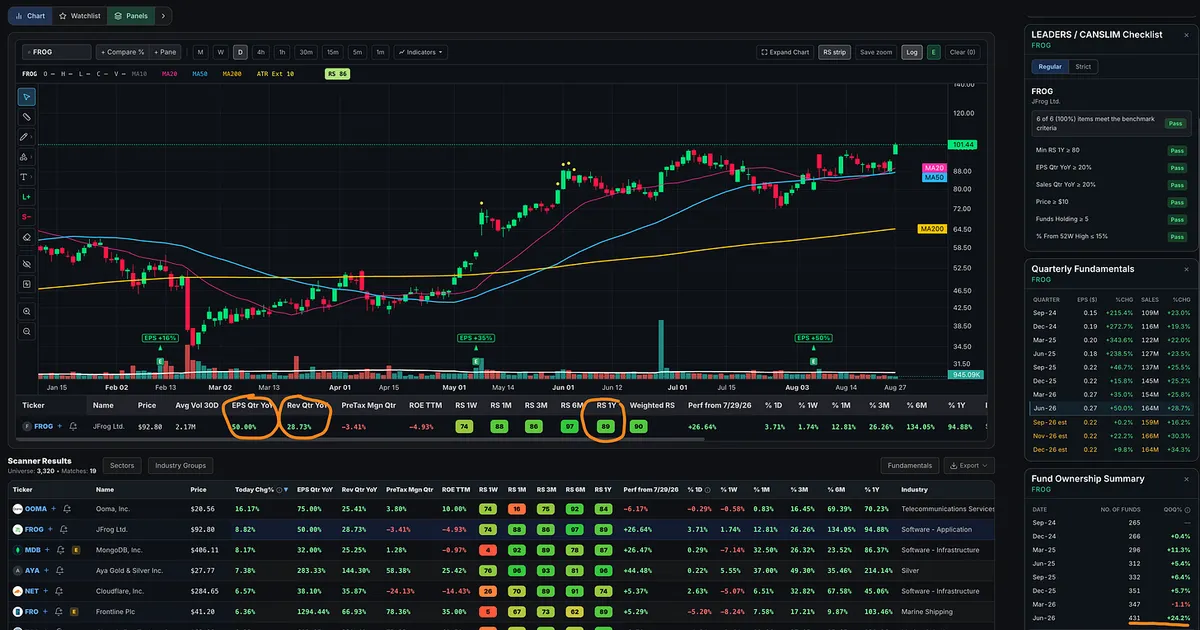
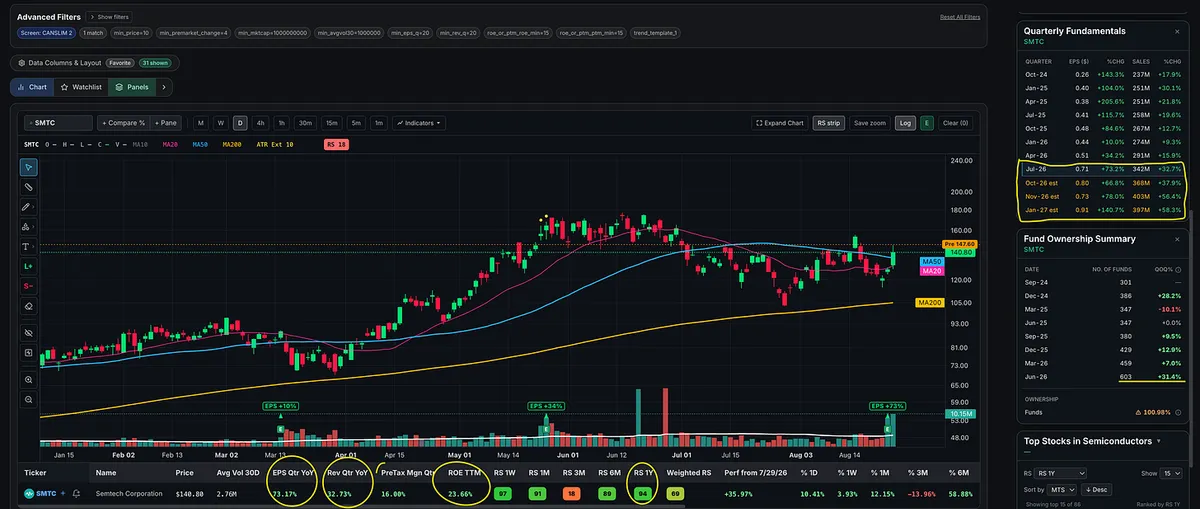
Hey MTS Velocity, Find Me a Fundamentally Strong Stock Moving Pre-Market 👀

Show me stocks with:

  • A minimum price of $10

  • A minimum market cap of $1 billion

  • A minimum 30-day average volume of 1 million shares

  • Quarterly EPS growth of at least 20% year over year

  • Quarterly sales growth of at least 20% year over year

  • ROE and/or pretax margins of at least 15%

  • Price above the 50-day and 200-day moving averages

  • The 50-day moving average above the 200-day

  • 1yr RS 80+

  • Up 4%+ pre-market

Here’s what came back: SMTC

EPS growth: +73%

Sales growth: +32%

ROE: 23%

One-year Relative Strength: 94

Fund ownership growth last quarter: +31%

Forward estimates point to continued acceleration in both earnings and sales, and the latest earnings report is now out of the way.