Momentum Trading Strategy

Notes

Short lessons on momentum trading, every day.

Every note from Substack, in one place: risk, setups, leading stocks, market conditions and the mindset behind them. Search them, browse by topic, or filter by stock.

Showing 1–16 of 16 notes

$NVDA ×
View on Substack ↗

The quietest volume can come right before a powerful move.

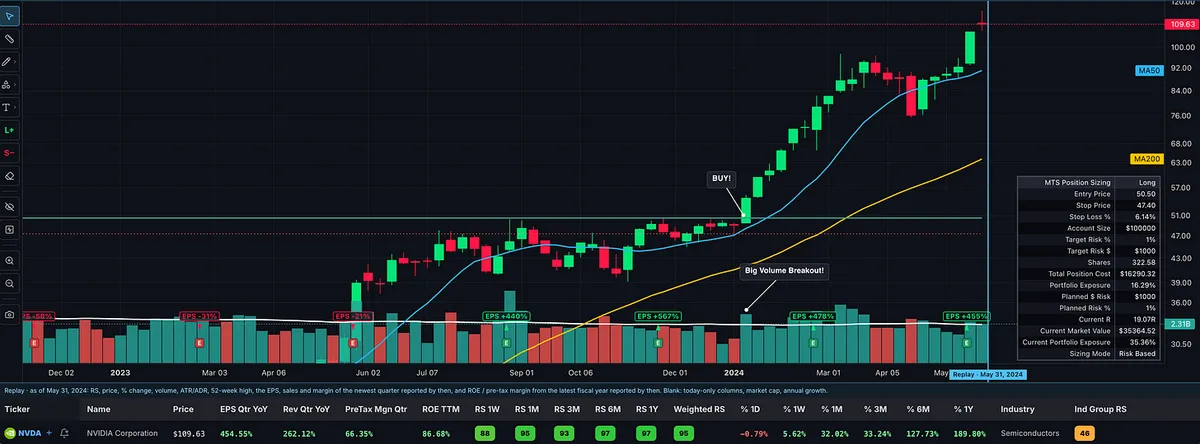
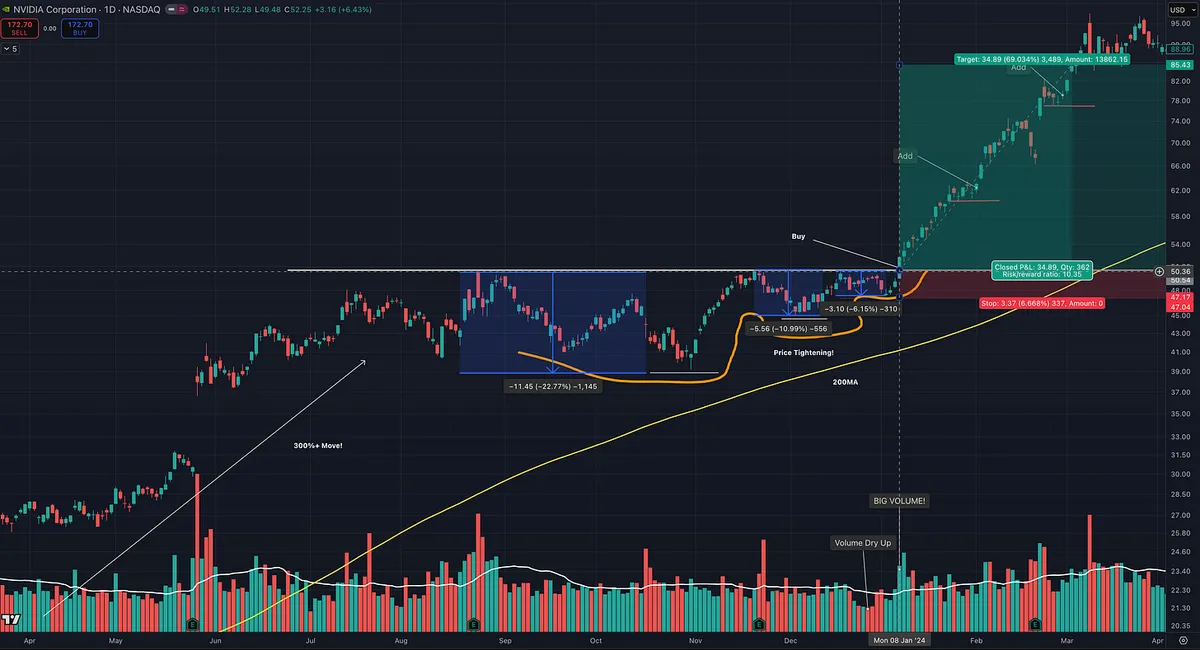
Look at $NVDA before and after its January 2024 breakout.

First, understand the context. As the market emerged from the 2022 bear market into 2023, AI became one of the new bull market’s defining themes. Semiconductors were a major leadership group, and NVIDIA was a standout leader.

Before these contractions developed, NVDA had already advanced more than 300% from its 2022 low.

That matters. A quality VCP starts with a stock that has already demonstrated powerful price performance and high relative strength, backed by the characteristics I look for in a potential market leader.

Then comes the tightening.

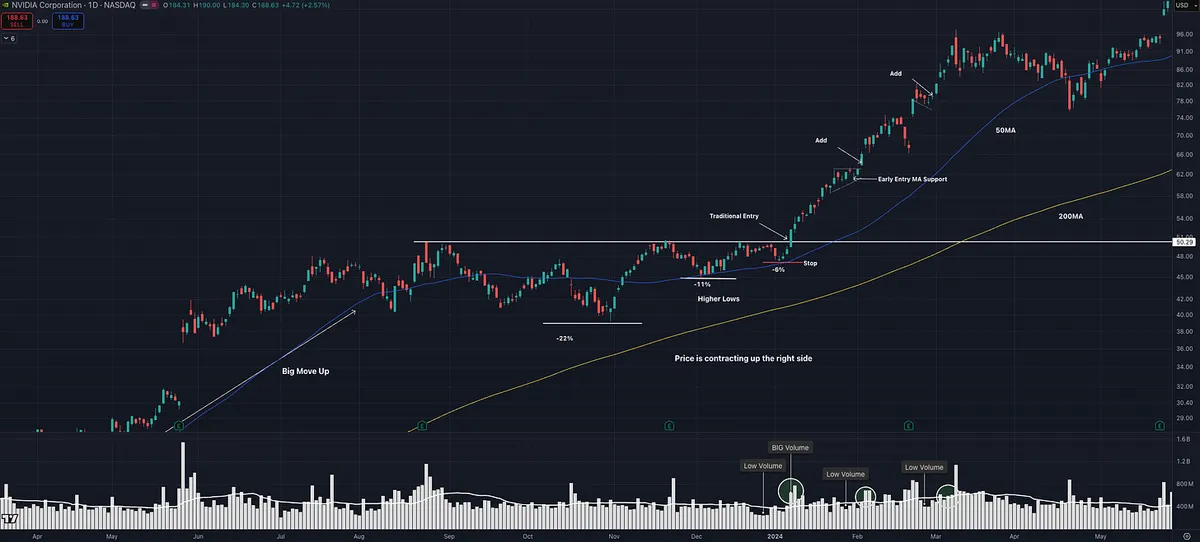
On the right side of this base, the pullbacks became progressively smaller: approximately 22% → 10.8% → 6–7%.

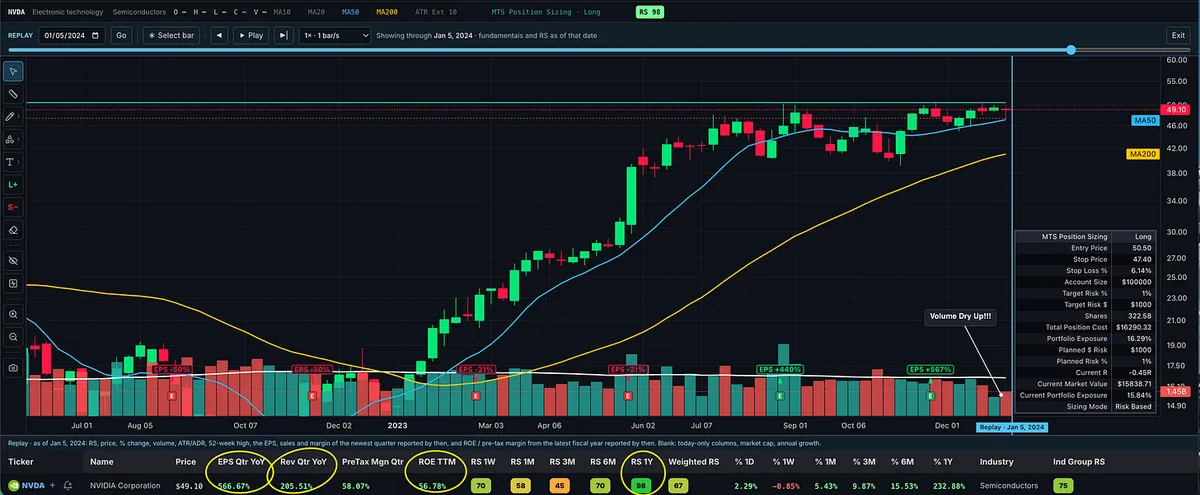
Before the move, price tightened near the $50.50 pivot. Volume dried up along the right side of the base.

Then demand showed up. Price broke through the pivot as volume expanded.

By May 31, NVDA was trading at $109.63.

But look closely at what happened BEFORE the breakout.

The tighter price action. The quieter volume. The stock holding near resistance instead of giving much ground.

That’s the character I look for in a VCP setup: volatility contracting and selling pressure easing as the stock approaches its pivot.

A lot of traders focus on the contractions and overlook the move that preceded them. I want proven strength coming into the base, followed by progressively tighter action that creates an entry.

The appeal is a clear entry with a nearby level to define risk. You don’t need to know how far the stock will run to plan where you’ll get out if the trade fails.

These before-and-after charts in MTS Velocity’s Replay make that transition easy to study.

My rule for this setup: Look for price tightening and volume drying up into the pivot, then volume expanding on the breakout. If that character is missing, I don’t force the trade.

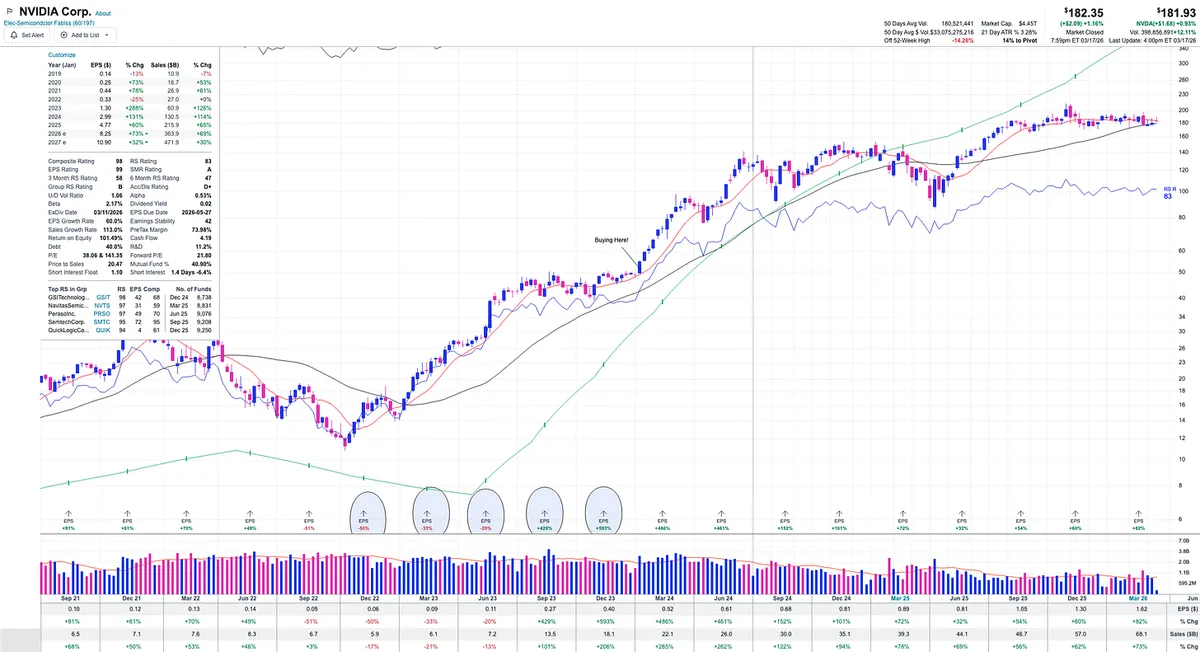
Also, look at the numbers BEFORE the breakout: quarterly earnings growth of 567% and sales growth of 206%, both year over year. A 58.8% pretax margin, 56.8% ROE, and a one-year RS rating of 98. All within an industry group ranked in the top third of the market.
View on Substack ↗

Watch What They Do. Not What They Say.

People ask why I pay more attention to the put/call ratio (PCC) than popular sentiment surveys.

It’s the same reason I study price instead of letting someone on television tell me what to think.

I care less about what investors say and more about what they actually do with their money.

The PCC compares put option activity with call option activity. Higher readings can reflect greater fear or caution, while lower readings can reflect greater optimism. It isn’t perfect, but it gives me a window into actual market behavior rather than simply asking investors how they feel.

The VIX gives me another perspective. It reflects the volatility being priced into S&P 500 options. It isn’t a direct measure of money flowing into or out of the market, but it shows what options market participants are actually pricing, rather than what they’re telling a survey.

I use both for context, not as standalone buy or sell signals.

Price still gets the final vote.

And this goes far beyond indicators.

Trading has a way of teaching you very quickly how much of what people say is bullshit. A compelling story is not evidence. Someone sounding certain does not make them right. If you can easily be influenced by what everyone around you thinks, trading is going to be a very difficult game.

Now, you might say: “But you’re a growth momentum trader. Aren’t you buying stocks when everyone else is buying them?”

Sometimes, absolutely.

My style of trading is heavily influenced by William O’Neil, Mark Minervini, Dan Zanger, and David Ryan. I’m looking for growth stocks with characteristics such as big earnings and sales growth, high relative strength, strong price and volume action, leadership within strong industry groups, and proper technical setups.

Sometimes the stock everyone is talking about is exactly the stock I want to own.

I bought NVDA in early 2024 when it was one of the biggest stories in the market because the evidence supported it. Big earnings. Big sales. High relative strength. New highs. A powerful market theme. A strong industry group.

It met the criteria.

Other times, the stock everyone is talking about doesn’t meet my criteria, and I’m perfectly comfortable watching it go without me.

The purpose isn’t to disagree with the crowd.

That’s just another form of letting the crowd control your thinking.

The goal is to develop enough independence that whether everyone agrees with you or disagrees with you becomes largely irrelevant.

You follow the evidence.

You follow your process.

And you make your own decision.

There’s a funny but revealing YouTube clip I’m going to share below showing just how powerful the human desire to conform can be. People begin standing up simply because everyone around them is standing up.

As you watch it, ask yourself:

Would I eventually stand up too, even if I had no idea why everyone was doing it?

Then ask yourself the trading version.

Am I buying because I see a legitimate opportunity, or because everyone else is excited?

Am I selling because the evidence changed, or because everyone around me is scared?

Am I holding because my analysis still supports the trade, or because someone else keeps reassuring me?

Trading can be a lonely game. Even when you have a great community around you, ultimately it’s you, your decisions, and the market.

You have to learn to lead yourself.

Let the crowd have its opinions. Let your process guide your decisions.

https://youtu.be/X6kWygqR0L8?si=8LV0dgTlNFxQ_DpN

youtube.comBrain Games Conformity Waiting Room
View on Substack ↗

Swing Trader or Position Trader? The Difference Is Management

The underlying strategy may be the same. What changes is the entry, holding period, and method used to manage the trade.

Time frame affects how long we hold a position and how we manage the trade. It does not necessarily change the foundation of the strategy.

Mark Minervini describes swinging in and out of stocks to compound capital, while David Ryan emphasizes holding winners as long as the uptrend remains healthy. These are tendencies, not rigid rules.

Minervini may hold an exceptional winner for multiple quarters, while Ryan will exit immediately if a new position hits his stop or doesn’t act right.

William O’Neil also combines profit-taking rules with provisions for holding exceptional winners longer. Position trading does not mean holding every purchase for years or tolerating big drawdowns. The longer holding period applies only to stocks that continue acting correctly.

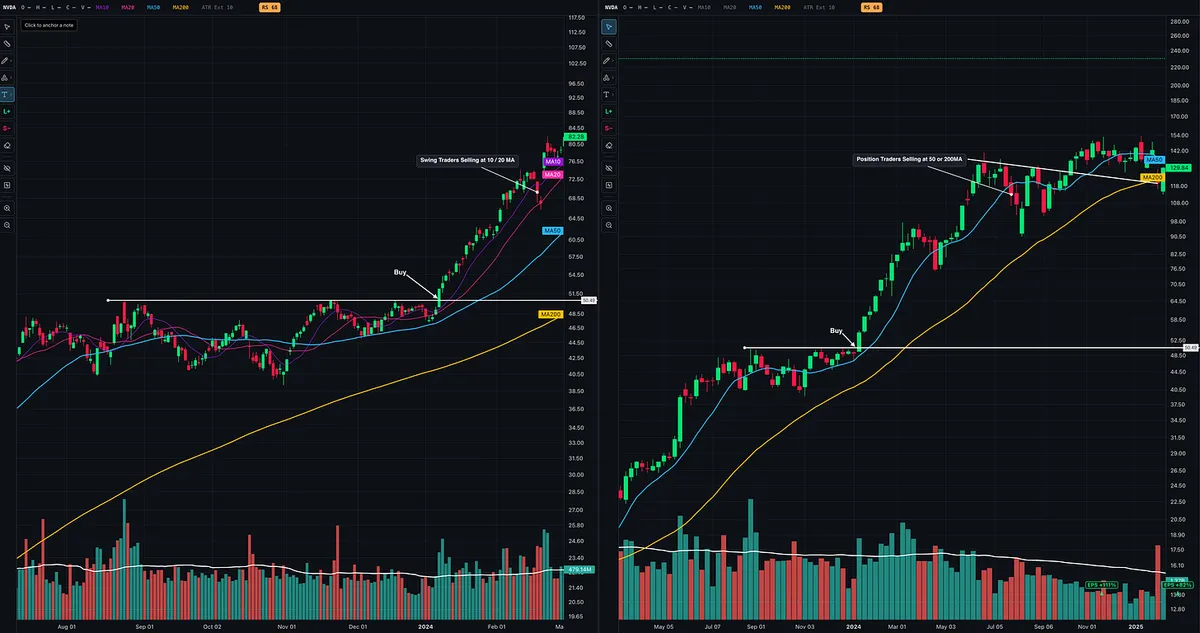
NVDA illustrates how the same opportunity can be managed differently depending on the trader’s time frame.

In this example, both traders enter at the same breakout.

The swing trader may capture the faster portion of the move and begin selling as the stock loses its shorter-term 10-day or 20-day moving averages. The position trader may give the stock more room and use the 50-day or even the 200-day moving average, along with the larger price structure, to participate in a longer advance.

They do not have to use the same entry, either.

One trader may enter on an early cheat, pullback, or pullback reversal, while another waits for the traditional breakout. These are differences in execution, not necessarily differences in the underlying strategy.

Many newer traders confuse a trader’s time frame with the time frame of the chart being viewed. They are related, but they are not the same thing.

A setup can be visible on the weekly chart that is not as clear on the daily chart. A shorter, tighter setup may also appear on the daily chart without creating a distinct pattern on the weekly chart.

Ideally, as we see in this NVDA example, the daily and weekly charts are aligned. The weekly chart confirms the larger Stage 2 uptrend and overall price structure, while the daily chart provides a more precise view of the setup, entry, and risk.

David Ryan is primarily a position trader, but he studies both daily and weekly charts. Minervini generally trades shorter-term swings, but he also uses both.

A swing trader may naturally rely more heavily on the daily chart for setups, entries, and trade management while using the weekly chart for context. A position trader may rely more heavily on the weekly chart for the larger trend and base structure while using the daily chart to refine entries and manage risk.

The chart time frame is the lens being used. The trading time frame is how the position is managed.

A position trader generally seeks to compound capital by giving winning stocks more time to produce larger gains. A swing trader seeks to compound the account through greater trade frequency.

What they share is more important than what separates them.

Both are buying a high-relative-strength leader in a confirmed Stage 2 uptrend with constructive price and volume characteristics. The opportunity may be the same. The difference is how each trader chooses to manage it.

View on Substack ↗

Every Market Cycle Has a “Big Stock.” But the Real Clue Is Usually the Industry Group Behind It.

The market’s biggest winners rarely emerge alone. They are usually part of an industry group benefiting from a powerful new fundamental trend.

2023: AI Compute and Semiconductors

This marked the beginning of a new bull market and the emergence of the generative AI theme.

Big leaders:

  • $NVDA | Nvidia

  • $SMCI | Super Micro Computer

NVDA became the face of the cycle, but the leadership was much broader. Chips, servers, networking equipment, and the entire data-center buildout were beginning to move.

2024: AI Software, Data Platforms, and Power

Leadership expanded from companies building the AI infrastructure to those finding ways to monetize and support it.

Big leaders:

  • $PLTR | Palantir

  • $APP | AppLovin

AI adoption spread into software, data platforms, advertising optimization, networking, and power generation. The theme was evolving, but the underlying driver remained the same.

2025: Memory, Storage, and the AI Data Stack

The market’s attention shifted toward the next major bottleneck. AI systems required enormous amounts of high-performance memory, flash storage, and data-center capacity.

Big leaders:

  • $SNDK | SanDisk

  • $WDC | Western Digital

  • $STX | Seagate Technology

  • $MU | Micron Technology

These became some of the market’s biggest winners as demand for AI memory and storage accelerated.

2026: The Memory Supercycle Continues

Leadership continued into 2026 and semiconductors remerged as a leading group rather than transitioning into an entirely new theme.

Leaders:

  • $SNDK | SanDisk

  • $MU | Micron Technology

  • $STX | Seagate Technology

  • $WDC | Western Digital

But don’t overlook what happened outside the dominant AI theme.

Metals and mining also developed into a major winning group during this bull market period 2024-2026. The market can have one dominant secular story while still producing powerful leadership in completely different areas.

The next monster winner probably won’t be random.

It will likely emerge from a strengthening industry group with accelerating earnings and sales, increasing institutional sponsorship, elite Relative Strength, and a chart that refuses to break.

2023: AI compute and semiconductors

2024: AI software, data platforms, and power

2025–2026: AI memory, storage, semis

Meanwhile, metals and mining proved that major leadership can still emerge outside the market’s primary theme.

What industry group do you think becomes the next true market leader for 2026–2027?

View on Substack ↗

The Best Thing About a VCP Isn’t the Breakout

One of my favorite quotes in Market Wizards comes from Bruce Kovner:

“Whenever I enter a position, I have a predetermined stop. That is the only way I can sleep. I know where I’m getting out before I get in. The position size on a trade is determined by the stop, and the stop is determined on a technical basis. For example, if the market is in the midst of a trading range, it makes no sense to put your stop within that range, since you are likely to be taken out. I always place my stop beyond some technical barrier.”

- Bruce Kovner, Market Wizards

That quote explains one of the biggest reasons I love the Volatility Contraction Pattern.

Most people focus on the obvious part of a VCP.

  • Price tightens.

  • Volume dries up.

  • Supply appears to diminish.

It is almost like a rubber band being pulled tighter and tighter, creating the potential for an explosive move once demand overwhelms the remaining supply.

All of that is great, but that is not my favorite part.

My favorite thing about a VCP is that it can give you a very clear technical level where you have decided the trade is wrong.

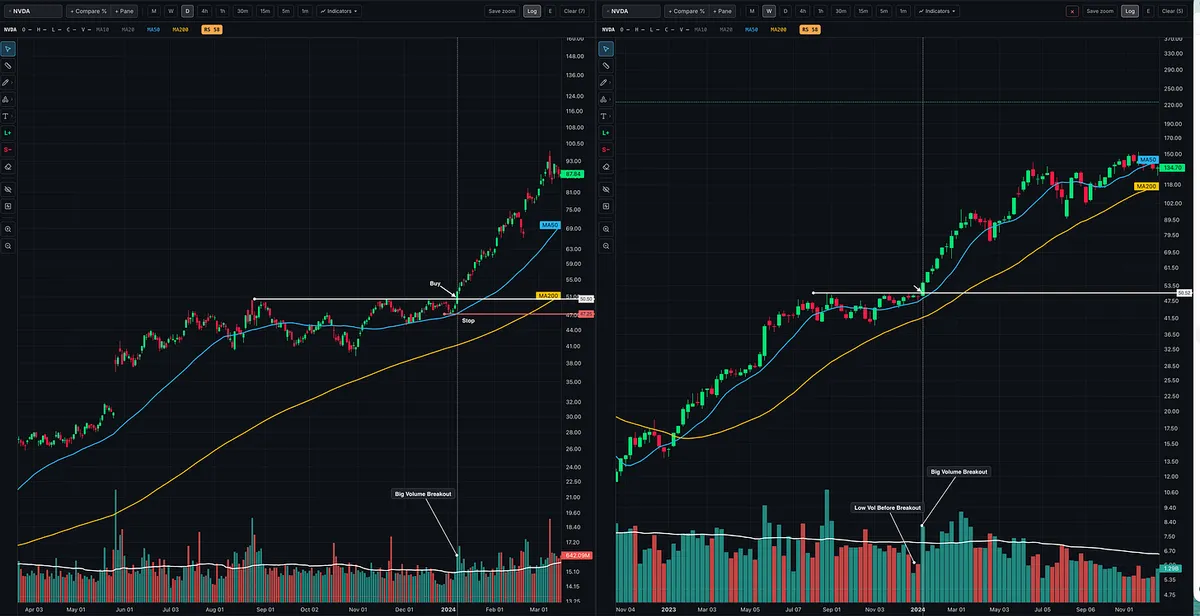
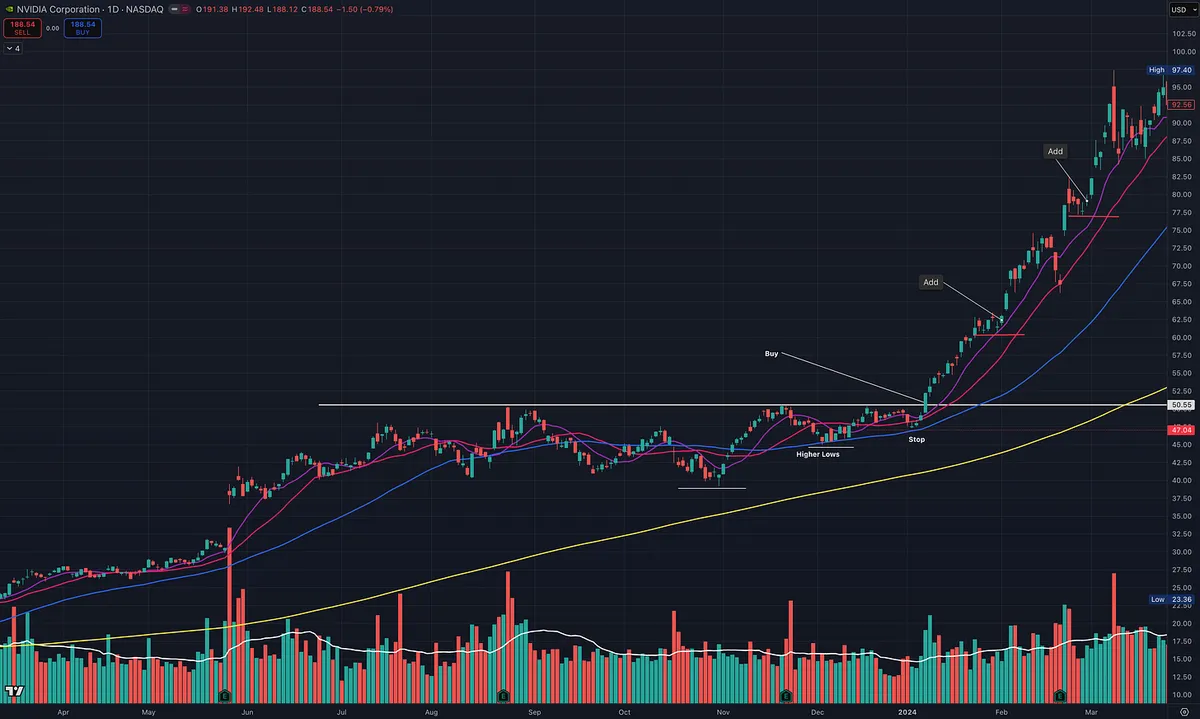
Look at NVIDIA in early 2024.

The stock tightened up near the pivot. Volume dried up. Then price broke through the line of least resistance on expanding volume.

But before the breakout ever happened, I could already identify my risk.

I knew where I wanted to enter.

I knew where the technical structure would begin to fail.

And because I knew my stop, I could determine my position size before putting capital at risk.

That is the part many traders get backwards.

They decide how many shares they want to own first, then try to squeeze a stop somewhere underneath the trade.

I prefer the opposite:

  • Find the setup.

  • Find the technical level that invalidates the setup.

  • Set the stop beyond that level.

  • Then size the position.

The chart determines the risk.

Your desired position size should not determine the chart.

And this is why a tight, well-formed setup can be so powerful. It is not simply that the stock might explode higher.

It is that you can potentially participate in that move while knowing where your idea no longer makes sense.

View on Substack ↗

Everyone Saw the AI Chips. Few Saw the AI Plumbing.

William O’Neil called this the “cousin stock” theory.

When a major theme is working, most traders focus on the obvious leader.

But sometimes the better opportunity is hiding one step away.

  • The supplier.

  • The equipment maker.

  • The parts provider.

  • The infrastructure company.

O’Neil used Boeing as an example.

Boeing was the obvious winner during the airline boom, but every new jet also needed parts from suppliers. One of those supplier stocks, Monogram Industries, went on to make a massive move.

Same theme. Different angle.

That still happens today.

In the AI boom, Nvidia was the obvious AI leader.

Everyone saw the GPUs.

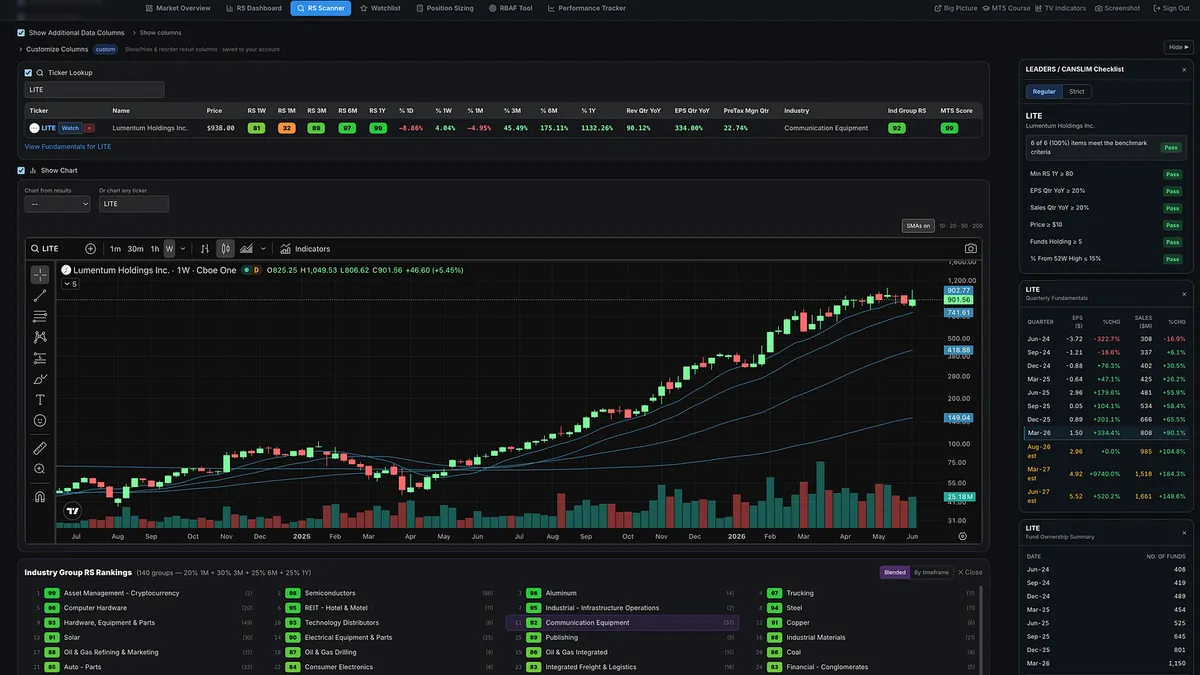
But AI data centers also need high-speed optical connections to move data between GPUs, servers, switches, and storage systems.

That is where Lumentum (LITE) became a modern cousin/follow-on stock.

LITE does not make Nvidia’s GPU.

It does not need to.

It supplies advanced lasers, optical modules, transceivers, and photonic components that help AI data centers scale.

Then Nvidia made the connection even clearer by announcing a strategic partnership and investment in Lumentum.

NVDA was the obvious leader in 2023–2024.

LITE was a related supplier benefiting from the same AI infrastructure demand, which helped it become one of the leading stocks in 2025–2026.

Most traders ask:

“What stock should I buy?”

Better traders ask:

“What theme is driving the market, which group is leading, and who are the cousin stocks benefiting from the same demand?”

That is where leadership leaves clues.

The crowd usually sees the main story first.

The best traders look for the ecosystem forming around it.

That is why industry group and relative strength matters.

This is why I built the Momentum Trading Strategy RS Scanner.

Not just to find strong stocks, but to help identify the strongest groups, and related names moving with institutional demand.

View on Substack ↗

How to Hold Winners Longer Without Guessing the Top

In the Master Trader Program, Mark Minervini talked with David Ryan about something every trader struggles with.

How do you hold on to a great stock… longer?

Not just take a quick gain. But stay in it when it has the potential to make a much bigger move.

He introduced what he calls the 50-day breakeven or better rule.

It is simple.

And it is powerful.

This is not how you enter the trade.

You still take your entry the same way. You still define your risk the same way. You still place your initial stop based on the chart.

Nothing changes there.

The shift happens after you are in a winning position.

As the stock moves higher, the 50-day moving average starts to rise.

At some point, that 50-day will catch up to your breakeven.

That is the key moment.

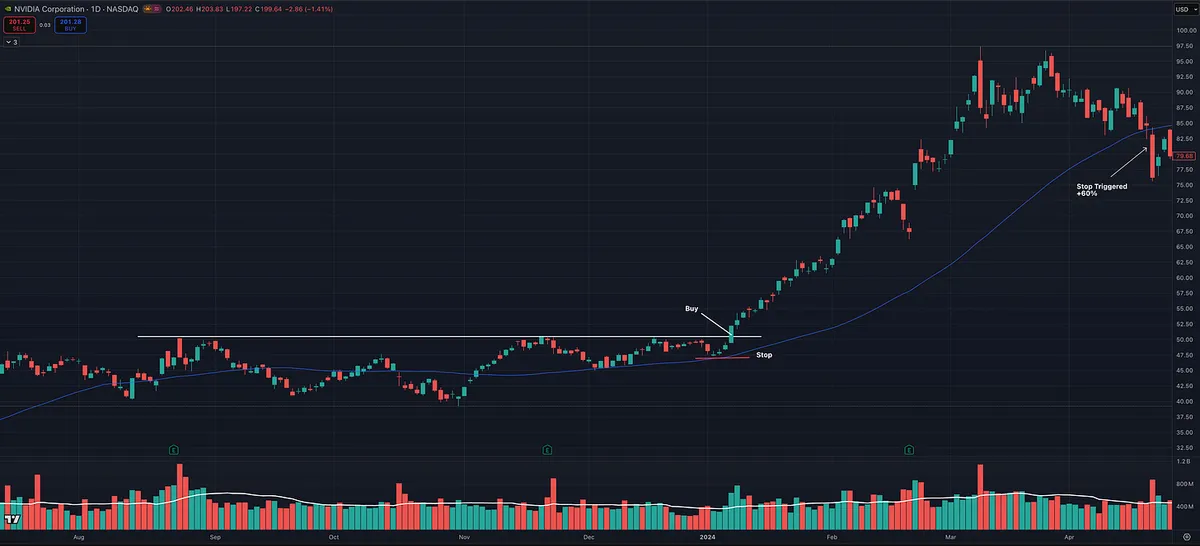
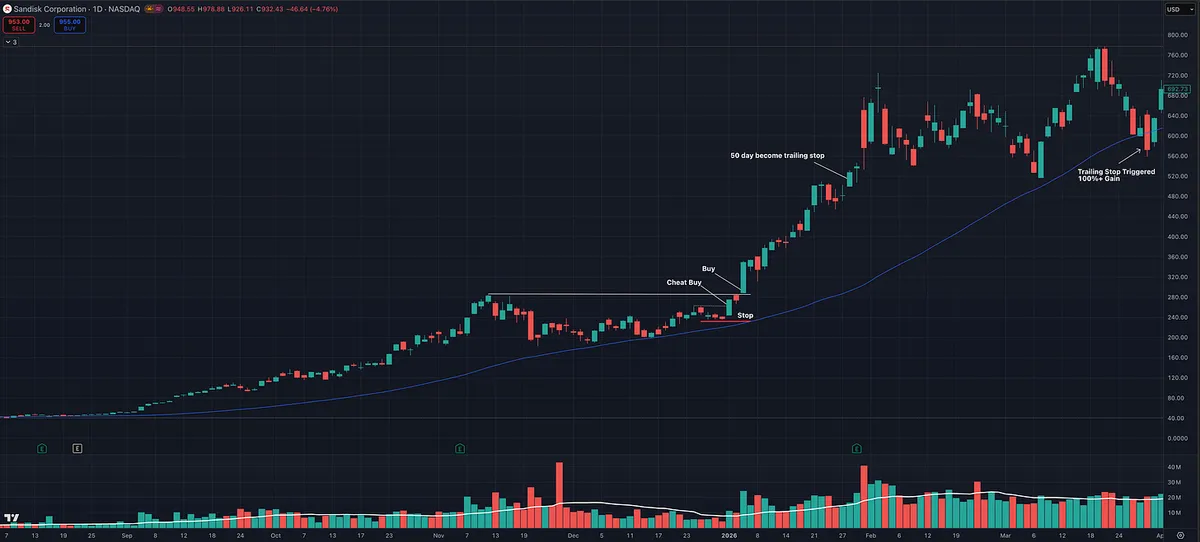
Once the 50-day reaches breakeven or better, it can become your trailing stop.

From there, you let the stock work.

You are no longer guessing where to sell. You are letting the trend decide.

Minervini even said he does not rely heavily on moving averages.

But in the early stages of a bull market, this is where it becomes extremely useful.

Because the best stocks can go a long distance before they ever break the 50-day.

That is the whole idea.

Give strong trends room to develop.

Without giving back your gains.

Now look at these examples.

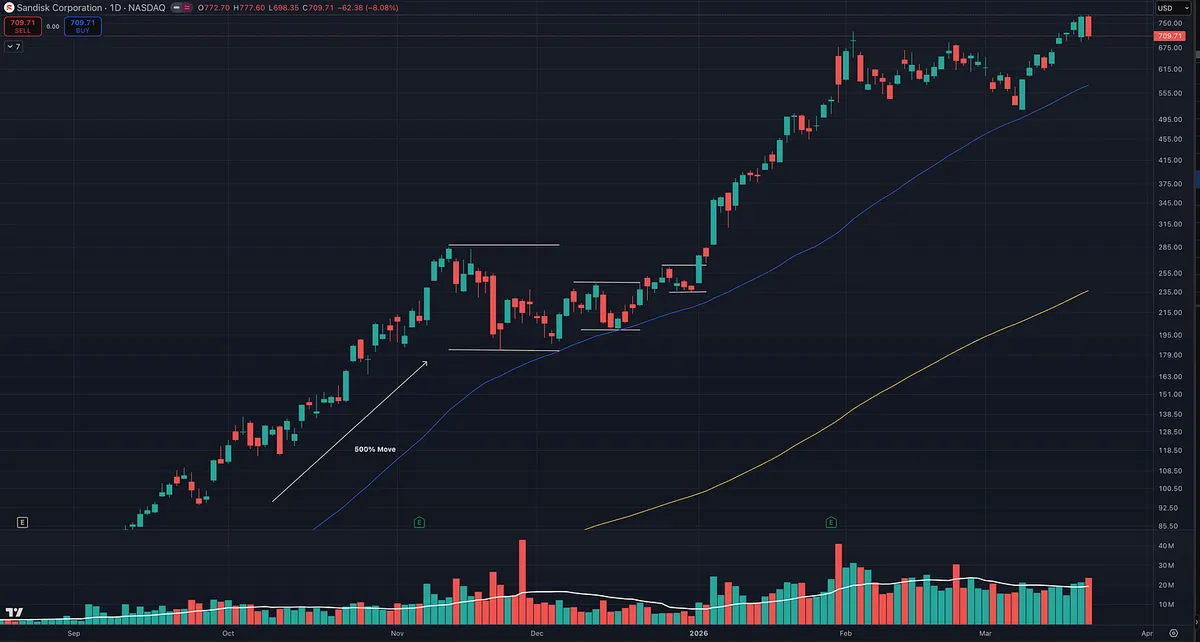
One from NVIDIA in 2024. One from SanDisk in 2025–2026.

Both show the same thing.

A proper entry. A defined stop. Then the 50-day catching up… and taking over as the trailing stop.

That is how you stay in a winner long enough to matter.

Most traders sell too early.

Not because the stock is done.

But because they do not have a process to stay in it.

This solves that.

It is not about predicting the top.

It is about staying with the trend as long as it remains intact.

If you want to go deeper, I cover this and several other ways to manage trades using a few key indicators in Module 5 of my course, available to all paid subscribers.

View on Substack ↗

Is a 5% Stop Too Tight in Today’s Market?

I got a great comment recently:

“It’s just that -5% is not much in today’s markets. Not enough not to get whipsawed. What’s your view?”

Here’s my answer.

I disagree.

There are still plenty of setups where you can risk 5 percent or less.

If that wasn’t the case, traders like Kristjan Kullamägi wouldn’t be as successful as they are.

Same with Mark Minervini. He won the U.S. Investing Championship in 2021. He’s still finding tight entries in today’s market.

It comes down to tactics and timing.

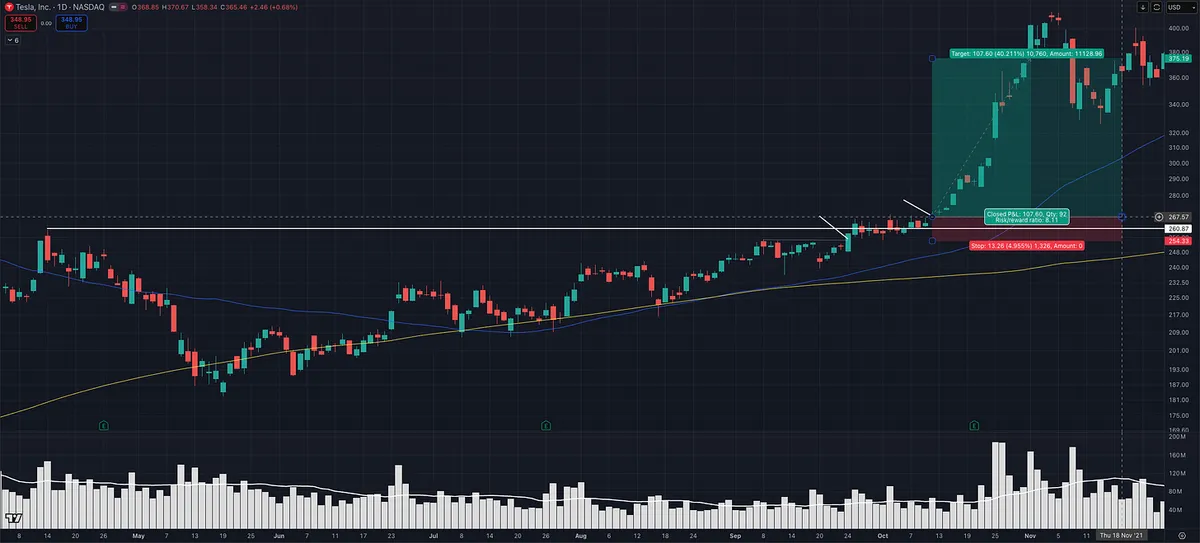
This TSLA example is a good illustration.

On the right side of the base, price was tightening and structure was clean. That created multiple opportunities where risk could be kept at 5 percent or less.

Recently (2025-2026), with many of the big winners already extended in Stage 2 uptrends, it’s a different environment.

If you’re only buying standard breakouts here, then yes, your stop likely needs to be 7 to 10 percent.

But that’s just one way to play it.

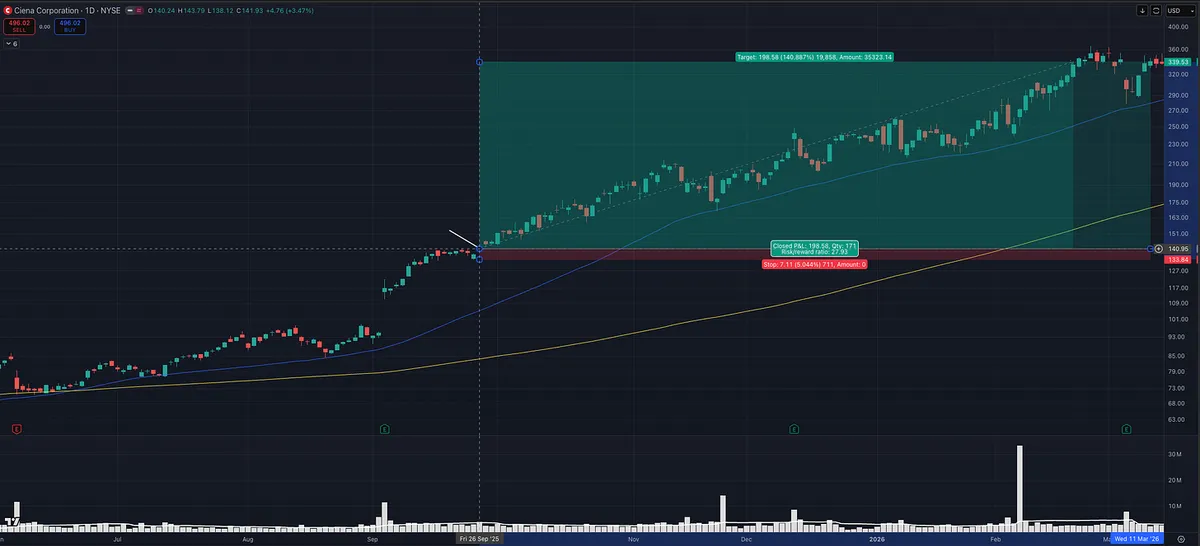
A lot of the big winners from 2025 to now in areas like computer data storage and telecom, names like LITE, SNDK, MU, CIEN, WDC, were harder to trade with tight risk using traditional breakout entries.

Their ADR% was higher, and there was less contraction into the pivot, so traders had to adapt.

Pullback entries. Low cheats. Intraday entries like ORB.

Those allow you to define risk much tighter and still participate without getting shaken out.

CIEN is another good example.

After an episodic pivot on earnings, price ran, then tightened sideways. That created a clean opportunity to enter with defined, tight risk.

This isn’t about forcing a fixed 5 percent stop on every trade.

It’s about finding entries with proven setups where tight risk actually makes sense.

Timeframe matters. Setup matters. Execution matters.

And just like Minervini, I’m not rigid with it.

Some trades might be 3 percent risk. Some 5 percent. Some 6 to 8 percent depending on the setup.

I’ll even go up to 10 percent and adjust position size, but I prefer tighter risk when the setup allows it.

Another good example is NVDA in 2024. I had about 6 percent risk. Someone else could have taken the same trade and used the breakout day opening range low as a stop and risked closer to 1.82 percent and likely wouldn’t have been stopped out.

Like David Ryan often emphasizes, the best trades tend to be hard to buy, work right away, and don’t look back.

The principle stays the same.

Keep losses small. Don’t let one trade do real damage.

And at the end of the day, we all trade differently and that’s ok.

That’s what makes a market.

Different styles can still make money.

View on Substack ↗

Why You Can’t Find VCPs Right Now (And Why That’s Not a Problem)

Received a great question today about VCPs that I think a lot of traders are struggling with right now.

They mentioned how hard it has been to actually find clean VCP setups, even after studying charts and screening for them.

This is a great question, and honestly what you’re experiencing is completely normal.

The first thing to understand is that most VCPs are not going to look like the textbook examples. The clean, perfectly staged contractions that many show are the exception, not the rule.

Minervini is not teaching you to find a perfect pattern. He is teaching you to recognize behavior.

What you are really looking for is:

  • volatility contraction over time

  • tighter price action

  • controlled pullbacks instead of sharp selloffs

  • volume drying up into the pivot

  • price tightening up the right side of the chart

Those things can show up in many different ways, and often they are subtle.

The second part of this is the environment.

Right now, it is harder to find clean setups. That is not a coincidence.

The best looking VCPs tend to show up earlier in a bull cycle when institutions are aggressively building positions and leadership is expanding. As the market matures, stocks become more extended, price action gets looser, and breakouts become less reliable.

So when you are scanning and thinking “these don’t look like the examples,” that is actually information.

It is telling you that either:

  • the setup is not truly there

  • or the environment is not ideal for it

A good way to think about it is this:

You are not trying to find a perfect VCP. You are trying to identify when supply is being absorbed before a potential expansion move.

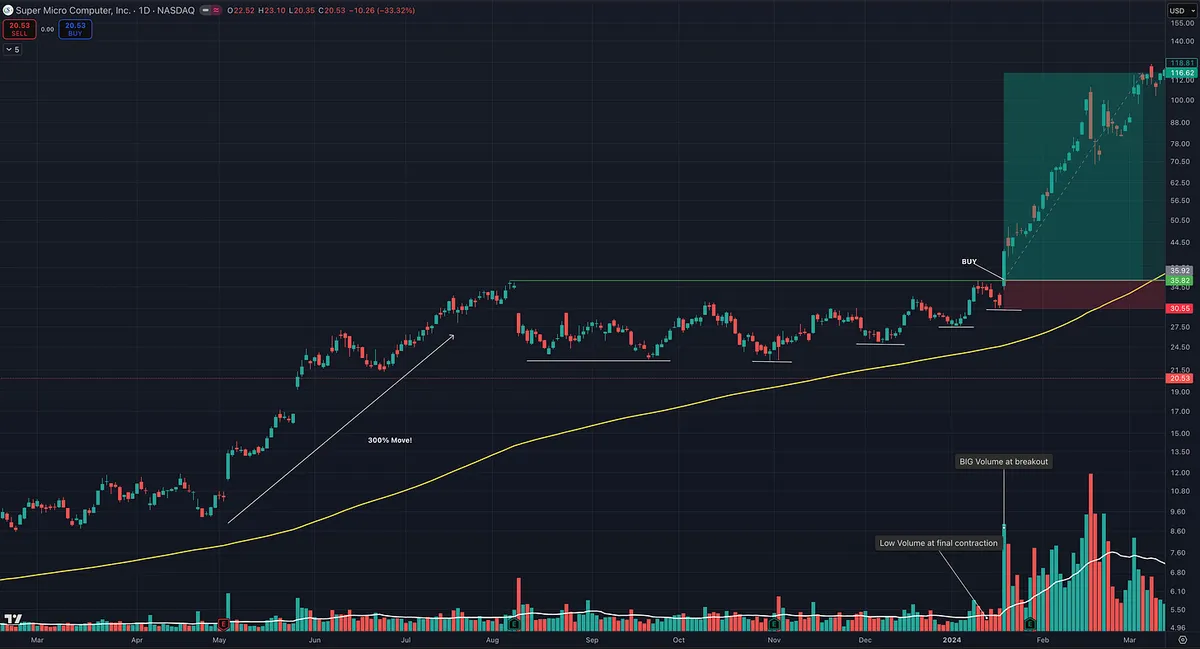
Sometimes that will look very clean like NVDA earlier in 2024 or slightly less perfect like SMCI. Other times it will look much messier, like SNDK in 2025, and require more experience to recognize.

If you are struggling to find them right now, that might not be a skill issue. It is very likely a reflection of the current market conditions.

Over time, you will get better at spotting these. It comes from screen time and reviewing charts over and over. What looks unclear now will start to stand out much more with experience.

Also, you do not need to master every setup to be successful. Some traders naturally see certain patterns better than others.

For example, you might find that:

  • cup with handle setups stand out more to you

  • or flat base breakouts are easier to recognize

That is completely fine.

The goal is not to trade every setup. The goal is to find the ones you can consistently recognize and execute well, and focus on those.

View on Substack ↗

Earnings Acceleration Matters

Big earnings and sales growth can absolutely drive stocks higher.

You will see stocks with strong numbers move, even without perfect acceleration.

But this is where many traders get confused.

Sometimes a company reports:

• Big earnings

• Big sales

• Strong margins

And the stock drops or goes nowhere.

Why That Happens

Because the market is forward-looking.

It is not just about how big the numbers are.

It is about whether they are improving or slowing.

If growth is:

• Peaking

• Decelerating

• Already expected

Then it may already be priced in.

Institutions may even be selling into those strong reports.

What Acceleration Tells You

Acceleration is not required for every move.

But it is an important piece of the puzzle.

Minervini and David Ryan look for:

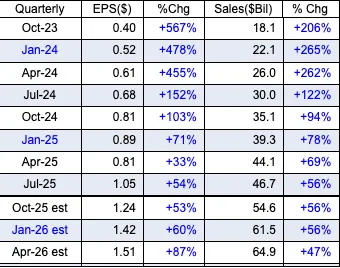
3 quarters of accelerating earnings and sales, along with 1–2 quarters of strong forward estimates

Especially early in a move.

Important Detail

Acceleration does not need to start from strong numbers.

It can begin from weakness.

For example:

-50% → -33% → -20% → +429% → +593%

That is powerful acceleration.

Each quarter is improving, even before the numbers turn positive.

Then once they do, the growth expands rapidly.

This is often where institutions begin building positions.

The Sweet Spot

Acceleration in the first few quarters of a move can signal:

• The trend is building

• Demand is increasing

• Institutions are accumulating

This typically occurs before the major breakout.

Not too early

Not too late

NVDA Example

NVIDIA showed multiple quarters of improving earnings and sales before its major breakout.

The numbers did not start perfect.

They improved, then turned positive, then accelerated aggressively.

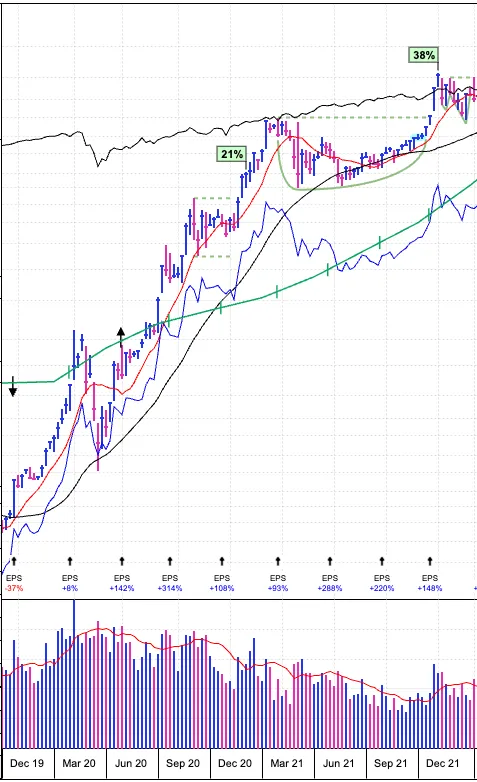
You can see on the chart that the stock began its move higher while earnings were still negative, but improving. The first two major positive earnings reports occurred during a period of tight consolidation. From there, the stock broke out and advanced roughly 50% before the third major earnings report.

Takeaway

Big earnings matter and strong numbers can move stocks.

But acceleration provides additional context.

Improving numbers, especially when growth is building and gaining momentum, often signal the move before it happens.

By the time the numbers look obvious, the move is usually already underway.

View on Substack ↗

The Most Important Trading Skill Nobody Talks About: Position Sizing

Most traders obsess over finding the perfect entry.

But the truth is, position sizing is what determines whether you survive long enough to compound real gains.

I receive a lot of questions about this because it is rarely discussed in detail in most trading books. There are several ways to position size and manage risk, but here is a very basic example that should help illustrate the concept.

Below is a response I recently sent to a reader.

—

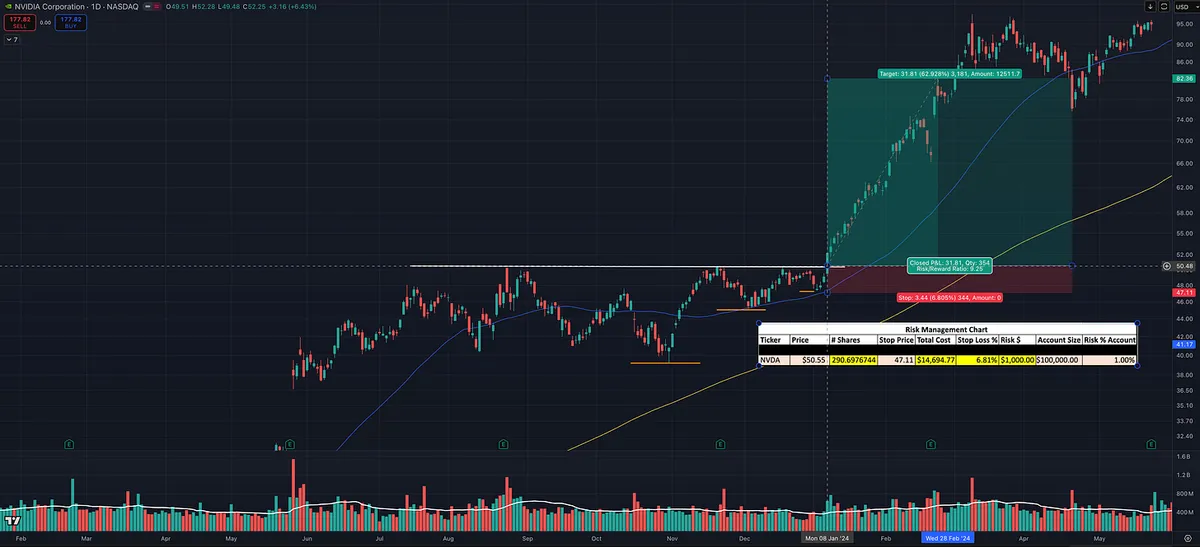
Here’s a simple method I use (see chart).

Let’s say I want to buy a breakout in NVDA at $50.55. I would place my stop at a technical level, right under the previous higher low and near the 50 day moving average at $47.11.

I always base my stop on technical level, not on the percentage I want to lose.

Bruce Kovner said it well in Market Wizards:

“Whenever I enter a position, I have a predetermined stop. That is the only way I can sleep. I know where I’m getting out before I get in. The position size on a trade is determined by the stop, and the stop is determined on a technical basis.”

In this example, the distance from entry ($50.55) to the stop ($47.11) is about 6.81%, which happens to be under the 8% rule that William O’Neil talks about, but that percentage alone does not determine your overall risk.

Once you know your entry and stop, then you determine position size based on how much of your portfolio you are willing to risk.

For example:

If you have a $100,000 account and you only want to risk 1% on the trade, that means you are risking $1,000 total.

With the stop distance in this example, that would equal about 290 shares ($14.6k worth).

Now let’s say you don’t want about $14,600 (14.6% of your account) tied up in this one trade. You could instead calculate position size based on portfolio exposure.

For example:

• If you only want 10% of your account in NVDA, you would buy about 197 shares, risking roughly 0.68% of the account if the stop is hit.

• If you’ve been doing well and want to press harder with 25% of your account, you could take about 494 shares, risking roughly 1.7% of the account if the stop gets hit.

Hopefully that helps.

A lot of people misunderstand the 8% rule from William O’Neil. That rule refers to the distance from entry to the stop, not necessarily the percentage of your total portfolio you are risking on the trade.

View on Substack ↗

Stanley Druckenmiller on Letting Winners Run

Cut losers short. Let winners run.

Anyone who has been reading my notes is probably sick of hearing it.

But this is foundational.

Rookies struggle with taking losses. Pros struggle with sitting with big gains.

Druckenmiller tells on himself with Nvidia.

After riding it from around 150 to 800, he said:

“So then the stock goes to 800 and I violated everything I said in the interview. I couldn't stand success. I'd gone from 150 to 800. I was long term in it. I couldn't deal with it and I sold it. And then it was 1,400 like five weeks later and I was sick.”

Beginners fear losses.

Professionals can take losses.

But even the greats feel the discomfort of big gains.

The skill is not just cutting losers.

It is having the discipline to let a true leader keep working.

View on Substack ↗

Stanley Druckenmiller on NVDA, AI, and Not Being an Expert

In 2022, Druckenmiller noticed something simple but powerful.

The “kids at Stanford” were shifting from crypto to AI.

That told him where the next wave was forming.

His partner said Nvidia was the way to play AI. So he bought a position.

Then ChatGPT launched. When he saw what it could do, he realized how big the shift was and doubled the position.

Here is what is important.

He openly admitted most of the AI discussion went over his head.

He was not an AI engineer. He was not a semiconductor expert.

He followed the theme. He recognized the transition. He pressed when confirmation came.

You do not need to understand every technical detail.

You need to understand where capital, talent, and momentum are going.

Themes change. Leadership rotates.

The money goes to those who recognize it and act.

View on Substack ↗

Buying Pullbacks vs Buying Breakouts

Most traders think you have to pick one.

You don’t.

You just need to know what each one does for you.

Buying Breakouts

You buy strength.

You buy as price clears resistance.

You buy as the stock moves into new high ground.

Why I use it:

• It confirms demand

• Overhead supply is gone

• Risk is clearly defined below the pivot

• Momentum is aligned

Breakouts increase probability.

When the market is in a strong uptrend, this is the cleanest way to initiate a position.

But there is a tradeoff.

• You pay up

• Everyone sees the same level

• Shakeouts are common

• Cost basis rises quickly if you keep adding

Breakouts are powerful.

They are also crowded.

Buying Pullbacks

You are not buying weakness in a downtrend.

You are buying weakness inside a confirmed uptrend.

Higher highs. Higher lows.

Rising 10-day, 21-day, or 50-day moving average.

Why I use it:

• Lower cost basis

• Better risk to reward

• Easier to accumulate shares

• Less competition

• Opportunity to add size without chasing

But the key to buying pullbacks is not guessing.

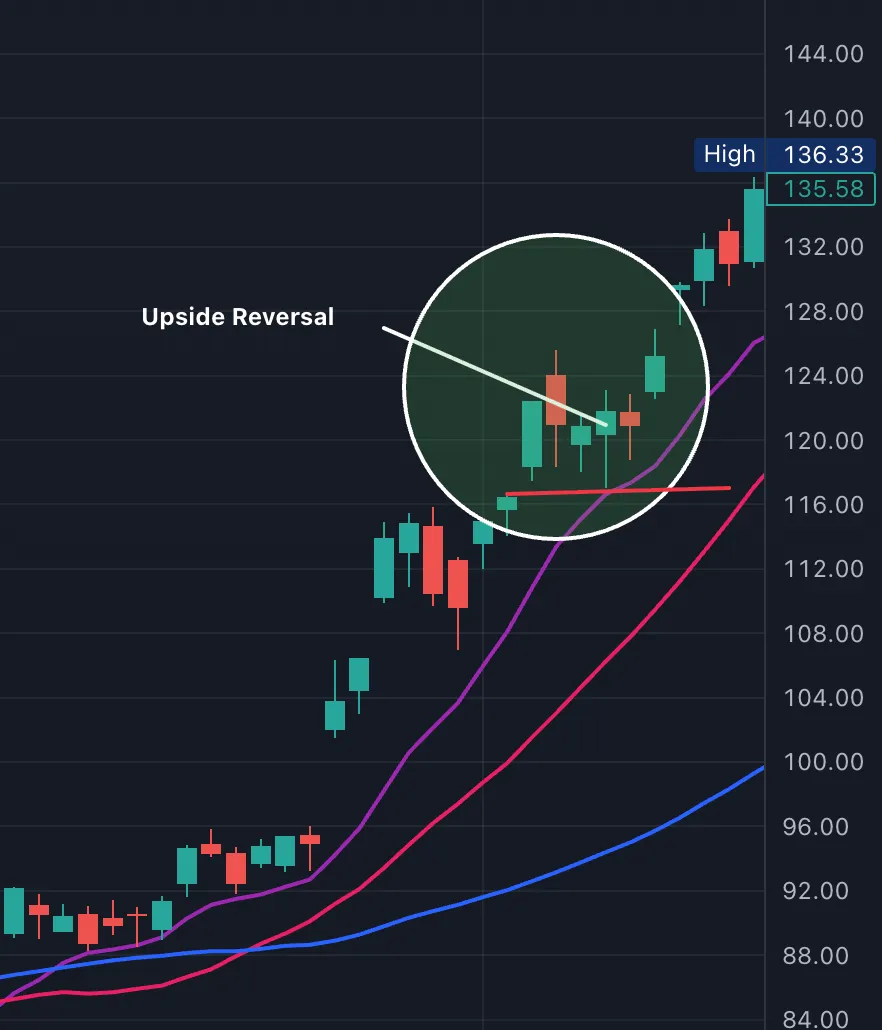
It is waiting for an upside reversal at support.

A shakeout.

A reclaim.

A strong close near the highs of the day.

That upside reversal becomes your signal.

The low of that reversal day becomes your stop.

If price undercuts it, you are wrong.

Without that trigger, you are just catching a falling knife.

Pullbacks improve positioning.

But they require:

• A strong general market

• A stock in a defined uptrend

• Clear support levels

• Absolute risk control

If support breaks, you are wrong.

How I Actually Trade It

Many times I do both.

I buy the traditional breakout.

Then I add on pullbacks.

Breakouts get me involved. Pullbacks help me build size.

If the stock is truly a leader, it will:

• Break out

• Pull back to the 10, 21, or 50

• Stage an upside reversal

• Resume higher

That is where real position building happens.

The goal is not to be right once.

The goal is to build size in the right stock while controlling risk.

Some uptrends reward breakouts more.

Some reward pullbacks more.

You need to be aware of what is working best right now.

NVDA Example

NVDA provided a textbook example of this sequence.

Flat base breakout from VCP to initiate.

Then a controlled pullback into the rising 10-day.

On that pullback, price:

• Touched support

• Reversed higher

• Closed above the prior day’s close

• Traded above the prior day’s high

That is buying a pullback within an uptrend.

The low of that reversal day or low of pullback becomes the stop.

Breakout to get involved.

Pullback to add.

That is how real leaders let you build a position.

View on Substack ↗

Most traders study charts after the big move.

That’s why they keep missing the best setups.

The real edge is learning to recognize what a stock looks like before it breaks out. Tightening price action. Drying volume. Quiet strength on the right side of the base.

I just published a post on how to train your eye to spot winning setups in real time, using NVDA as a real example.

If you want to stop chasing and start anticipating, this is worth reading.

👇

https://tradingmomentum.substack.com/p/how-to-train-your-eye-to-spot-winning

ArticleHow to Train Your Eye to Spot Winning Stock Setups Before the Breakout
View on Substack ↗

NVDA — Same Story, Different Cycle

It’s always funny to see the chatter every time $NVDA consolidates. Just like people who think a stock or asset will never go down, there’s always another camp convinced “the top is in.” Then NVDA goes up, consolidates, and does it again, more times than I can count. 😂

That’s exactly why it’s so important to focus on price action and volume, and to look for good risk/reward opportunities until the trend actually confirms it’s over. Until then, the key is to stay unbiased and keep making smart, high-probability bets. If you study the greatest market winners of all time, as William O’Neil did, the pattern is clear: leaders in leading industry groups tend to dominate bull markets far longer than most people expect before finally topping out.

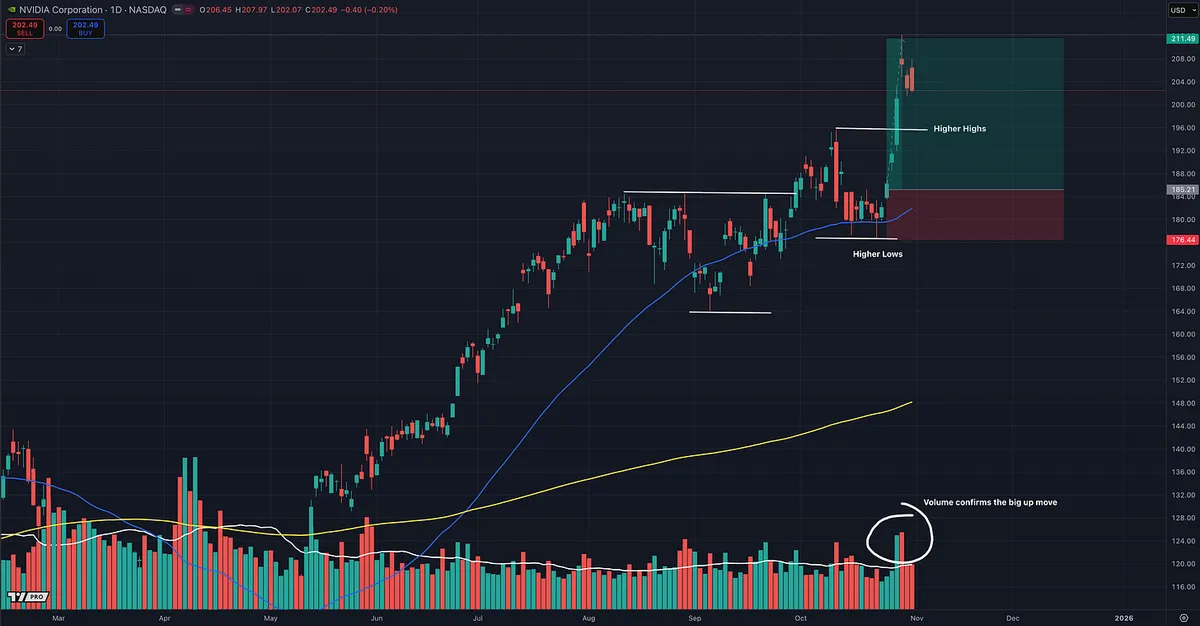
Plenty of bulls don’t rely on stochastics or oscillators, just price action and volume — the purest read of supply and demand. From that view, NVDA continues to show strength with higher lows and higher highs through its consolidation, and now it’s broken up out of that range, a textbook bullish continuation.

Price sits above all key daily moving averages (10, 20, 50, and 200 SMA). The last pullback found support at the 50-day on lighter volume, while the recent breakout came on big volume, confirming real institutional buying interest.

From a risk/reward standpoint, this setup is clean: defined support, strong momentum, and volume confirmation — everything you want in a continuation move.

And fundamentally, NVDA remains an absolute leader. It holds an IBD Relative Strength Rating of 90, meaning it has outperformed 90% of all stocks in the market over the past 12 months. That’s not the same as the RSI or Stochastic “relative strength” indicators. IBD’s RS Rating measures true performance versus all other stocks, not short-term momentum.

When you combine that kind of technical strength with fundamental dominance like strong earnings, consistent sales growth, and market leadership, it’s hard not to stay bullish.

NVDA continues to do what great stocks do: Climb, consolidate, shake out the doubters, and climb again.