
Trading articles/How to Train Your Eye to Spot Winning Stock Setups Before the Breakout
Dec 17, 2025 · Momentum Trading Strategy
How to Train Your Eye to Spot Winning Stock Setups Before the Breakout
How to study winning stocks the right way so you can recognize setups in real time
Originally published on Substack.
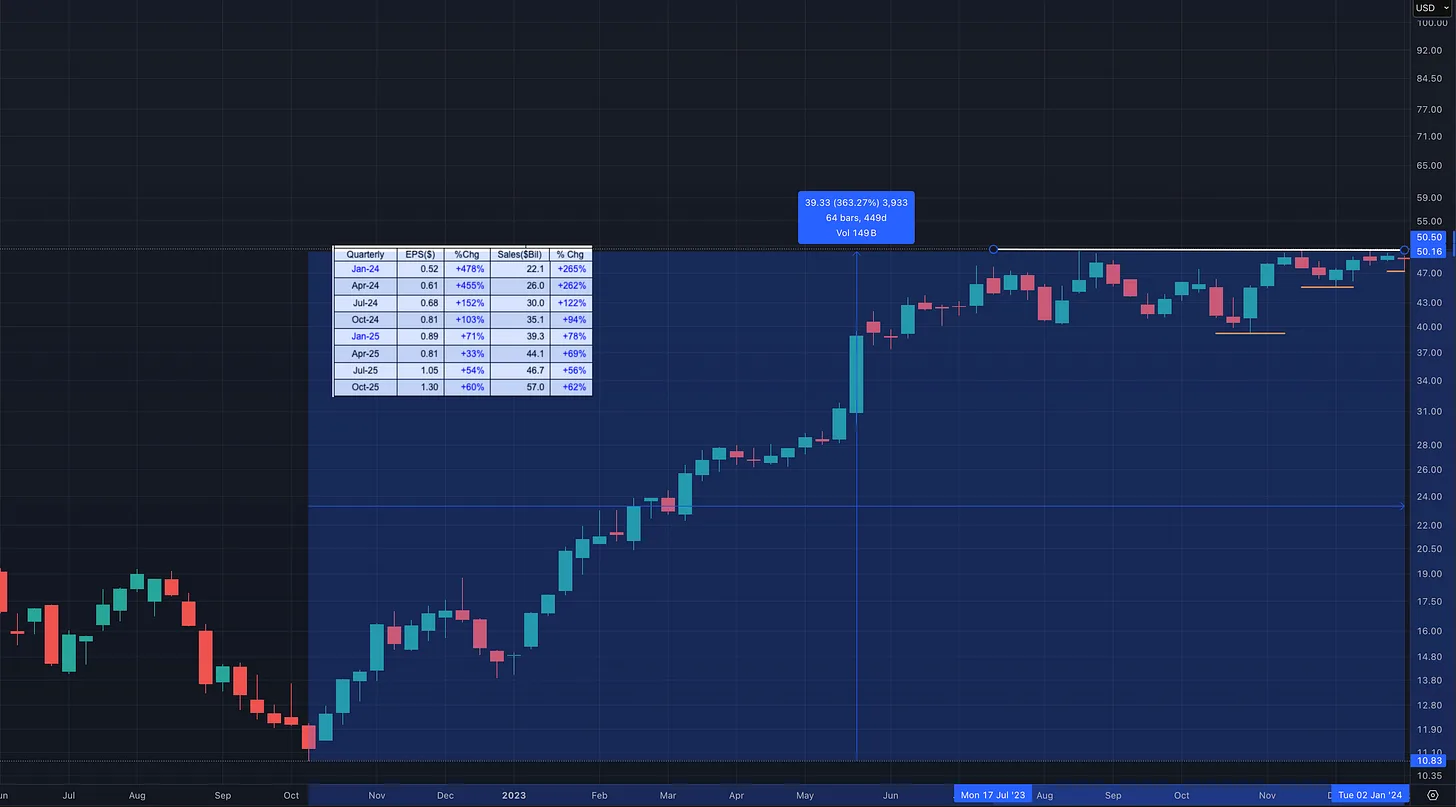
Most traders study charts after the big move.
That habit quietly holds them back.
Anyone can circle a breakout candle once a stock is already up 40, 60, even 100 percent. The real edge comes from learning to recognize what the chart looked like before the move ever happened.
If you want to spot winning stock setups in real time instead of hindsight, this mental shift changes everything.
Why Most Traders Miss the Best Setups
When you constantly look at charts after the breakout, your brain gets trained to recognize results, not conditions.
You start associating winning trades with:
- Big green candles
- Explosive volume
- Vertical price action
But by the time those show up, the lowest risk opportunity is already gone.
Some of the best trades feel quiet before they work.
They do not announce themselves.
The Exercise That Trains Real Pattern Recognition
Here is one of the most effective ways to level up your chart reading.
Review some of the biggest winning stocks of past cycles and hide what happens next.
Most charting platforms have a replay feature. Use it. If not, simply scroll the chart so you cannot see the breakout or the run that follows.
Then move forward bar by bar and stop right before the move.
Ask yourself one simple question:
Would I be interested in this stock right here, with no knowledge of what comes next?
This forces your brain to operate the way it must in real time.
- No hindsight
- No confirmation
- Just probabilities
What Winning Setups Usually Look Like Before the Move
When you do this enough times, patterns start repeating.
Before major advances, strong stocks often show:
- Tightening price ranges on the right side of the base
- Shallow pullbacks with quick recoveries
- Higher lows with reduced downside volatility
- Closes near the upper half of the range
- Failed breakdown attempts that quickly reverse
- Volume that dries up
This is not excitement.
This is pressure building.
Supply is being absorbed quietly. Sellers are losing control. The breakout is simply the final outcome of this process.
NVDA: What the Chart Looked Like Before the Breakout
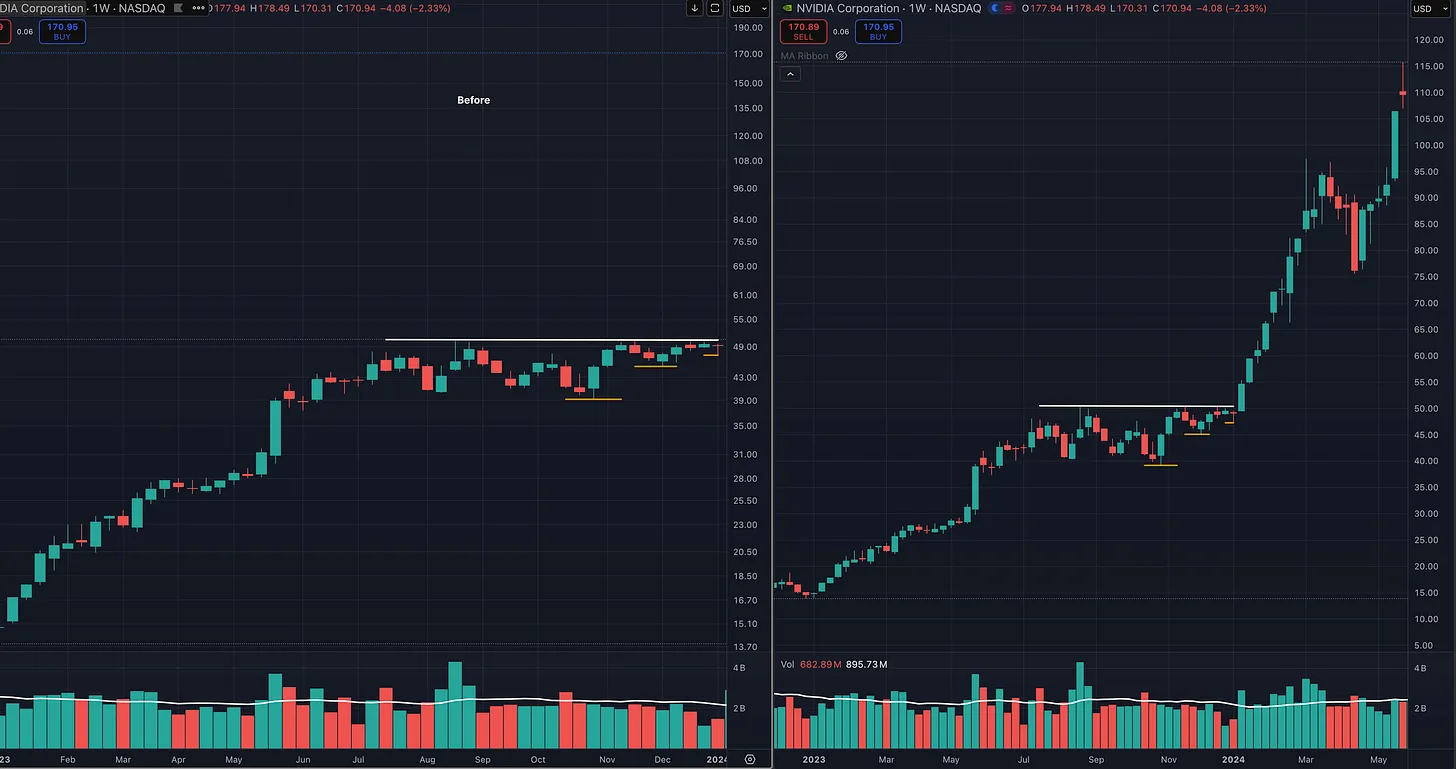
NVDA is a perfect example of this.
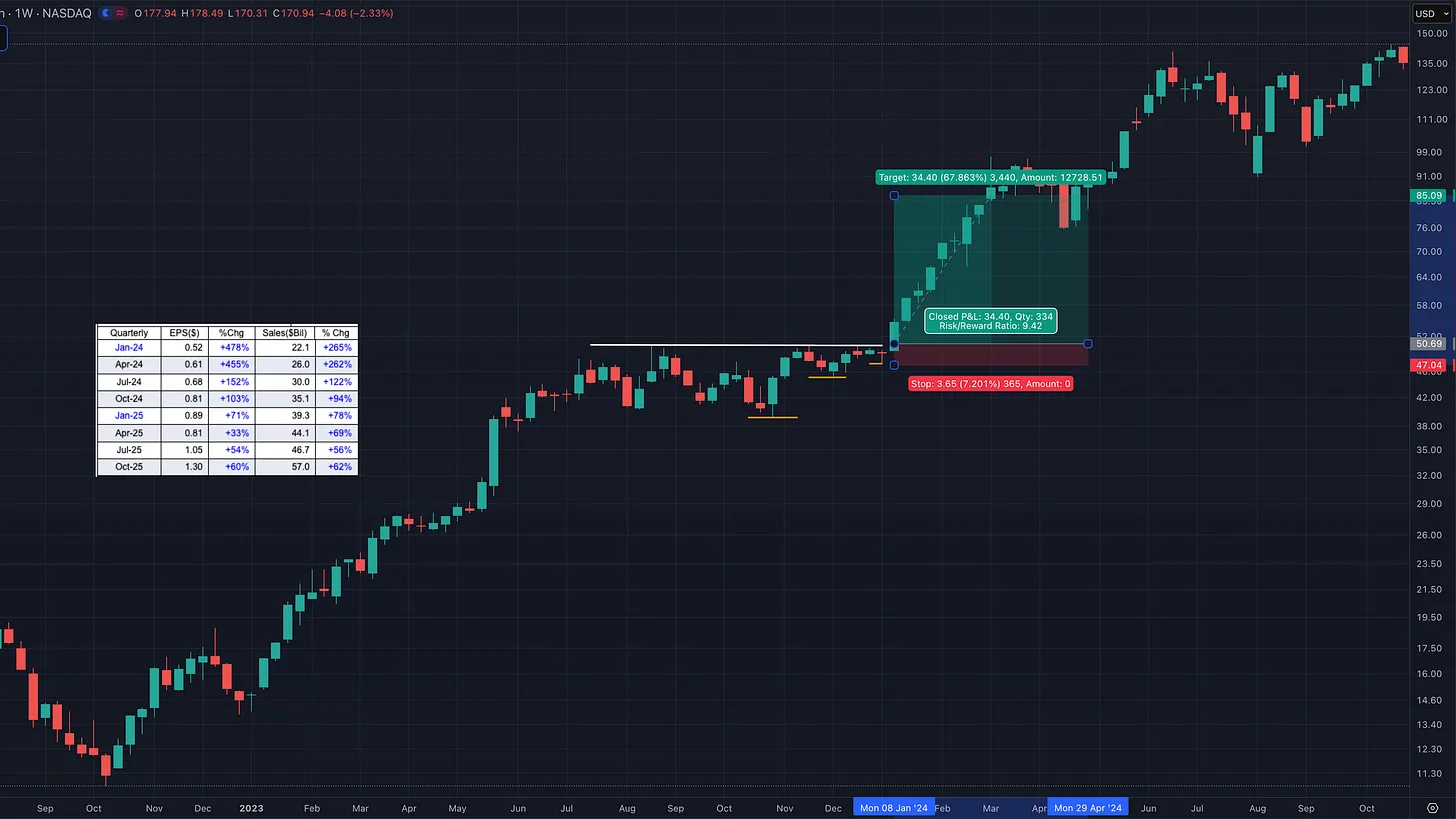
Before the breakout that everyone remembers, NVDA was not doing anything exciting. Price had already made a strong advance and then transitioned into a consolidation with tightening price action on the right side of the base. Volatility contracted. Pullbacks became shorter and shallower, and volume dried up. The stock stopped violating prior lows and began closing consistently near the top of the range. Nothing looked urgent, which is exactly why most traders ignored it. But this tightening action was the signal. Sellers were losing control, supply was being absorbed, and pressure was quietly building. The breakout that followed was not the setup. It was simply the result of the work that had already been done beforehand.
Why This Makes Trading Easier in Real Time
Once your eye is trained on pre-breakout behavior, several things change naturally.
- You stop chasing extended stocks
- You become more patient
- Your entries improve
- Your risk tightens
- Your confidence increases without forcing trades
Instead of reacting to strength, you enter trades tactically at pivot points that provide low risk, high reward opportunities.
Why Scanners and AI Are Not Enough
Scanners can help narrow the universe. They are useful tools.
But nothing replaces manually flipping through charts.
Pattern recognition is built through repetition, not shortcuts. Seeing hundreds and then thousands of charts is what trains your eye to recognize subtle changes in behavior.
Even with AI and advanced analytics, this part of trading has not changed.
Many of the greatest traders spent countless hours manually reviewing charts long before modern tools existed.
That edge still comes from experience.
How to Practice This Weekly
Here is a simple framework you can use:
- Pull up former market leaders
- Hide the breakout and the run
- Study the right side of the base
- Identify tightening, structure, and volatility contraction
- Repeat across many stocks
Do this consistently and something shifts.
- You stop looking for the result
- You start recognizing setup conditions
Final Thought
Great traders do not have better indicators.
They have better eyes.
They have trained themselves to see when a stock is getting ready, not when it is already gone.
If you want to improve your timing, reduce risk, and catch more leaders early, this is one of the highest leverage skills you can build.
And it is available to anyone willing to put in the work. You do not need fancy indicators, just price and volume.
More in Strategy & Tactics
All Strategy & Tactics articles →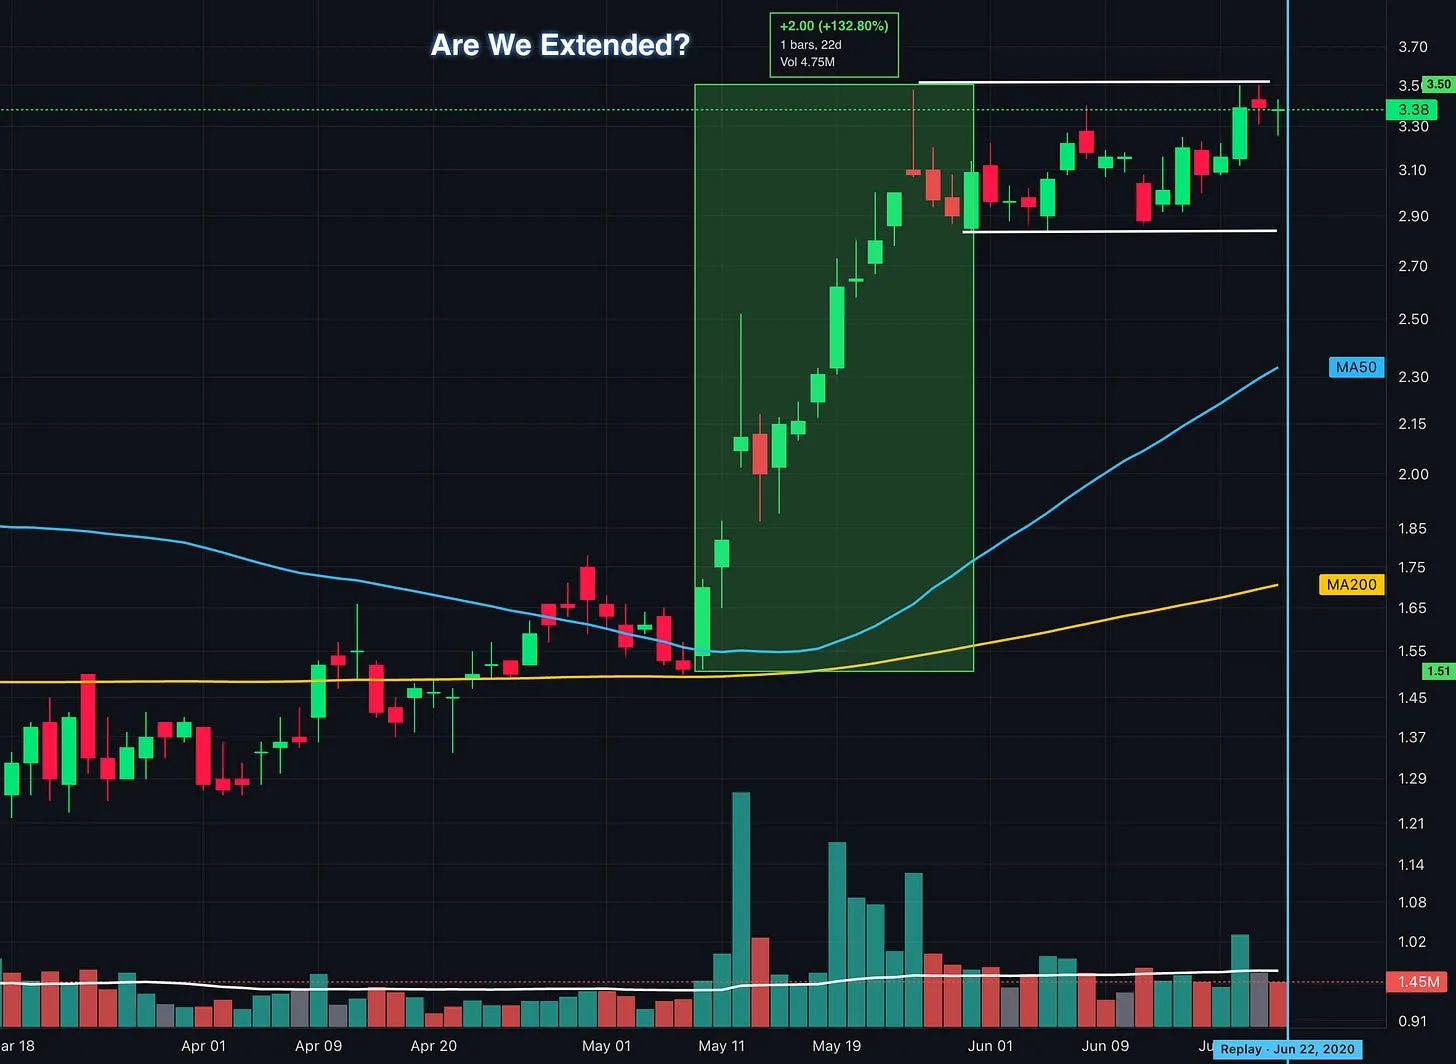
Oct 8, 2026 · Strategy & Tactics
Up 100% and Still Buyable? What Traders Get Wrong About Extended Stocks
How to identify proper buy points, avoid chasing stock breakouts, and manage entry risk using lessons from William O’Neil, Mark Minervini, David Ryan, and Dan Zanger.
- Momentum Trading
- VCP
- position trading
- Growth Stock Trading
- David Ryan
- Flag Pattern
- chart patterns
- Cup and Handle
Sep 27, 2026 · Strategy & Tactics
Should You Follow Leading Stocks or Wait for Market Confirmation?
How to read the market, industry groups, and individual stocks together so you can recognize opportunities, build exposure, and respond when conditions change
- growth stocks
- CANSLIM
- Trading
- position trading
- Stan Weinstein
- William O'Neil
- Momentum Trading Strategy
- Trade stocks
Sep 25, 2026 · Strategy & Tactics
Stage Analysis: How to Spot Stage 3 in Real Time
Recognize a developing Stage 3 using Stan Weinstein’s framework, with real chart examples, warning signs, and lessons for protecting your gains
- Momentum Trading
- Nasdaq
- technical analysis
- CANSLIM
- position trading
- Stan Weinstein
- QQQ
- Find True Market Leaders