
Trading articles/Should You Follow Leading Stocks or Wait for Market Confirmation?
Sep 27, 2026 · Momentum Trading Strategy
Should You Follow Leading Stocks or Wait for Market Confirmation?
How to read the market, industry groups, and individual stocks together so you can recognize opportunities, build exposure, and respond when conditions change
Originally published on Substack.
You wait for the market to confirm a new uptrend, only to discover that several stocks on your watchlist have already broken out. Next time, you decide to get ahead of the move, but the market rolls over and your early buys get stopped out. After enough rounds of that, it starts to feel like you have two choices: buy too early or arrive too late. So which should you follow, the individual stocks or the market?
The problem is expecting both to give their signals at the same time. Leading stocks, industry groups, and the major indexes can strengthen or weaken on different schedules. Some leaders move first, some break out alongside the market, and others offer proper entries after the rally is underway. Missing the first breakout does not necessarily mean you missed the opportunity to participate.
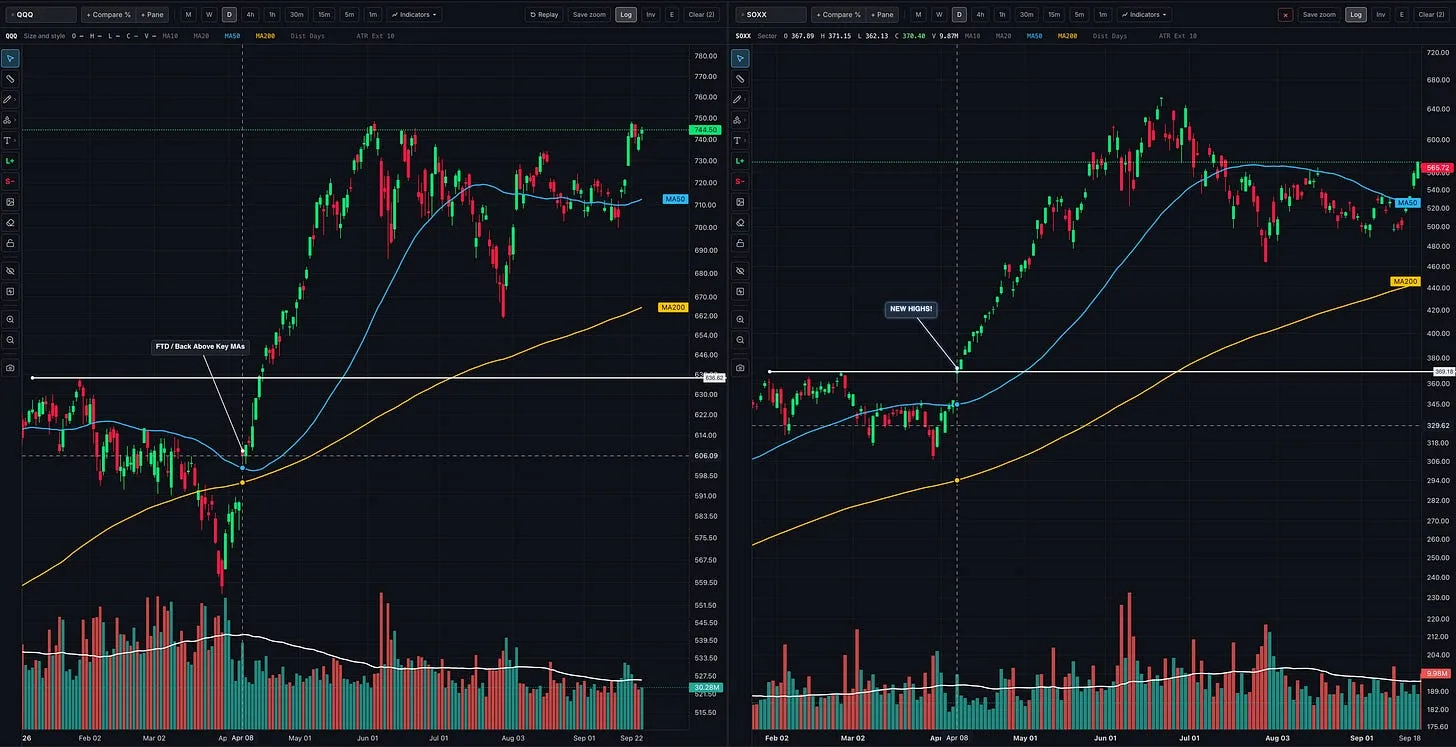
In the video below, I walk through the April through June advance using QQQ, the semiconductor ETF SOXX, and leading stocks including AXTI and Micron (MU). The charts show how those differences in timing created separate opportunities to get involved. They also show why the same principle matters when an advance begins to deteriorate.
Market Confirmation Is Not the Same as a New High
Before comparing the charts, we need to define what we mean by confirmation. A follow-through day, a recovery above key moving averages, and a return to new highs are different events. They may occur days or weeks apart, and waiting for each one means waiting for a different amount of evidence. Saying “I waited for confirmation” can describe very different entry decisions.
In William O’Neil’s approach, a follow-through day helps confirm an attempted market rally through the action of a major index. It does not require that index to have already recovered to new highs, and it does not guarantee that the rally will succeed. It provides confirmation to begin acting on qualifying setups, with risk controls still in place. Waiting until the index reaches new highs is a later threshold, which helps explain why some stocks may already look extended by then.
The Industry Group Moved First
For this comparison, I use QQQ as a proxy for the Nasdaq-100 and SOXX as a proxy for the semiconductor group. As QQQ recovered from its March decline and reclaimed key moving averages, SOXX was already reaching new highs. The group was demonstrating relative strength while the broader growth-stock benchmark was still repairing its chart. That was useful information about where to focus my attention.
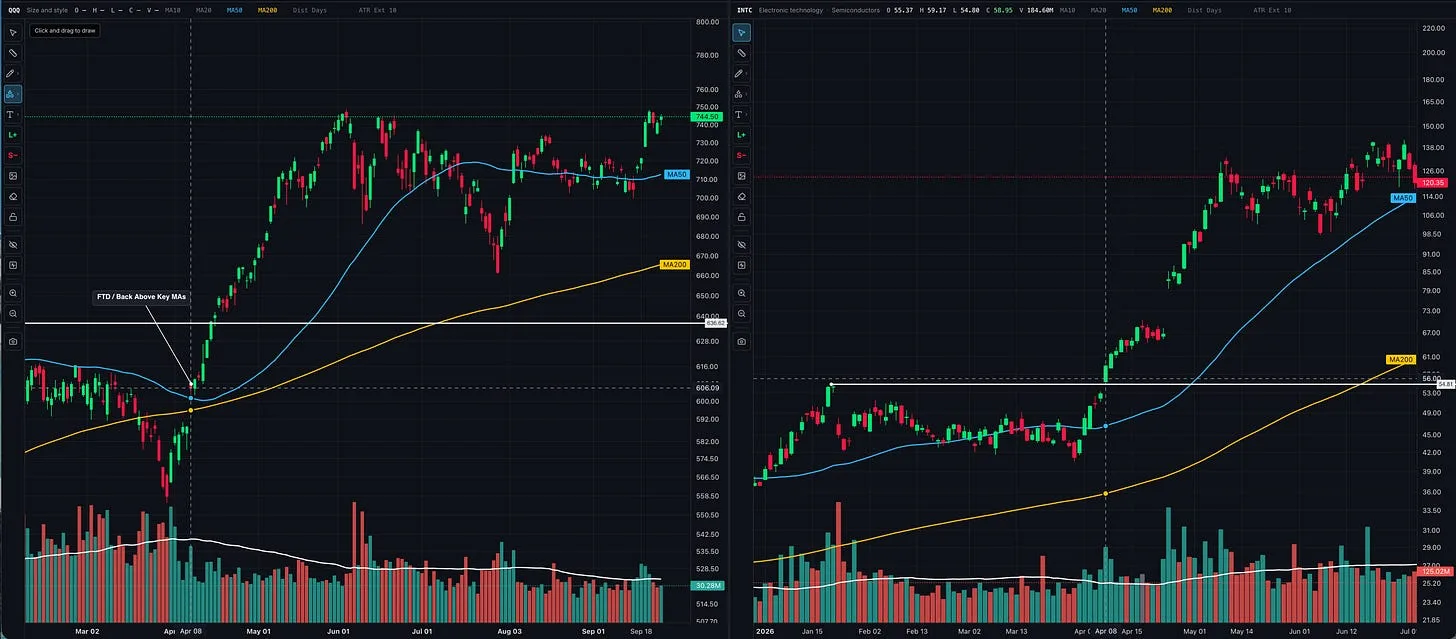
Intel (INTC) provided an example of that leadership at the individual-stock level. INTC reached new highs on April 8, a week before QQQ did on April 15. The strength we were seeing in SOXX was already appearing in individual semiconductor leaders while the index was still recovering.
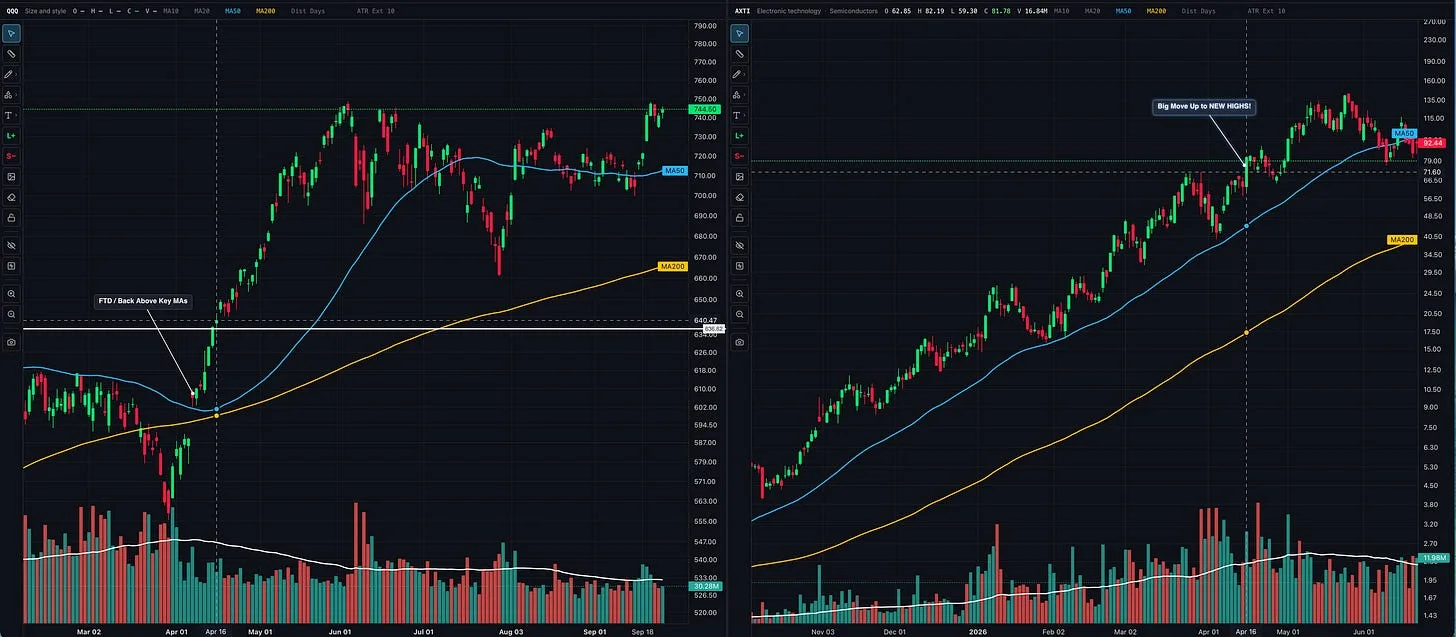
AXTI followed a different schedule. It had shown relative strength during the correction, holding around its 50-day moving average while QQQ suffered deeper damage. But AXTI did not reach new highs until April 16, one day after QQQ. Its move into new-high ground arrived essentially alongside the market’s (AMD too).
These were leading stocks within a leading industry group, but their breakouts did not arrive together. INTC moved ahead of the index, while AXTI moved with it. Micron adds the third part of the picture: a major semiconductor leader whose breakout came after the market had already reached new highs.
Micron Offered a Later Opportunity
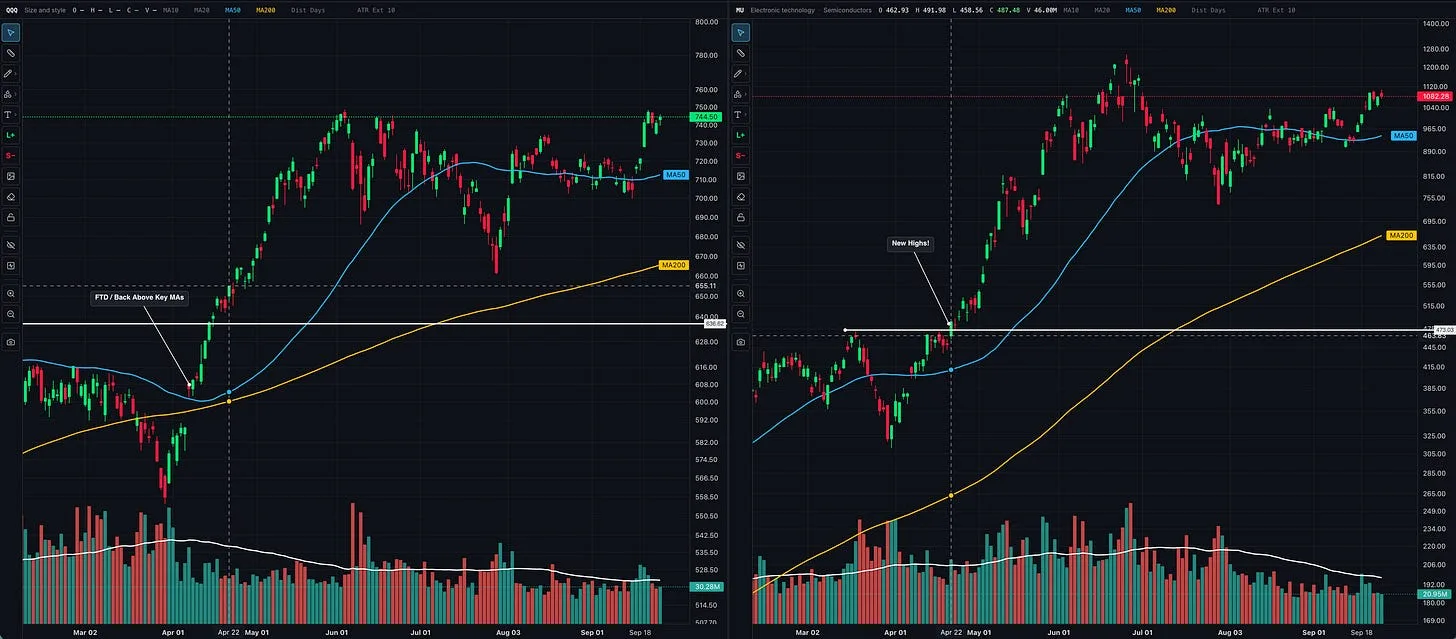
Now look at MU. It did not break into new-high ground until April 22, about a week after QQQ. While some earlier movers were already extended, MU was tightening up, with volume drying up ahead of its breakout. A trader who kept reviewing the watchlist could still identify a developing setup after the index had recovered its highs.
That is the distinction I want to emphasize: A later breakout does not automatically make a stock a laggard, and an earlier breakout does not automatically make it a better purchase today. MU was an important stock within the semiconductor group, supported by strong earnings and sales. Its setup simply developed on a different schedule.
This does not mean every rally will hand you another ideal setup. It means you should keep looking for qualifying opportunities instead of assuming that a few missed breakouts have ended your chances. Chasing an extended early mover and buying a later, properly formed setup are very different decisions. In this advance, MU illustrated why that difference mattered.
What O’Neil, Minervini, and Weinstein Have in Common
O’Neil and Mark Minervini are sometimes presented as opposing approaches: one follows the market, while the other follows individual stocks. Their books support a more nuanced reading. The M in CAN SLIM stands for Market Direction, and in How to Make Money in Stocks, O’Neil explicitly includes both the indexes’ price-and-volume behavior and the action of individual market leaders. His emphasis on market confirmation does not remove stock selection or leadership analysis from the process.
Minervini places considerable emphasis on leading stocks and on whether his own trades are working. In Trade Like a Stock Market Wizard, he explains why relying exclusively on the general market to time purchases can cause you to miss emerging leaders, while also stressing the importance of the market’s primary trend. He describes starting with smaller commitments and increasing exposure as those trades gain traction. They share important inputs, even though their timing rules and the weight they give those inputs are not identical.
Both evaluate the market, industry groups, and individual stocks. The confusion comes from emphasizing Minervini’s comments about stock action while emphasizing O’Neil’s comments about market confirmation. In both approaches, the behavior of leading stocks helps inform the assessment of the market, and the market’s behavior helps inform decisions about those stocks.
Stan Weinstein makes the market, group, and stock relationship explicit in Secrets for Profiting in Bull and Bear Markets. His “Forest to the Trees” approach begins with the market trend, narrows to the strongest groups, and then selects the best individual stock patterns. He also explains that a stock can offer a fresh Stage 2 breakout within a group whose uptrend is already well established. The charts do not have to be at the same point in their advances, but he wants the market and group trends working in the purchase’s favor.
You Do Not Go from Cash to Fully Invested
The question becomes easier when you stop treating participation as an all-or-nothing decision. For example, suppose a stock on my watchlist triggers a qualifying entry on a strong follow-through day. I buy an initial position with defined risk, moving from cash to some exposure. That gives me a position to evaluate as the rally develops.
Over the next several days, the market advances toward its previous highs, and another stock in a leading industry group sets up. If my first position is working and conditions remain constructive, I can take that next trade and increase exposure. As the market moves past new highs, another qualifying setup may appear, such as MU’s breakout on April 22. Each purchase becomes a separate decision supported by the stock, the market, and the progress of my existing positions.
Through April and into May, that process might take an account from cash to 20% invested, then 40%, then 60%, and eventually 80% or even 100%. The pace and eventual exposure depend on the opportunities available and how the trades perform. Working trades and additional qualifying setups support the next increase in exposure. If the initial trades fail, I take the losses and pull back instead of continuing to add.
Along the way, I am also managing the positions I already own. I may sell some into strength, hold the remainder, and put capital into another qualifying opportunity. Sometimes a stock I trimmed will consolidate and produce a fresh entry, allowing me to buy back if the new setup and risk qualify. Exposure can rise and fall during an advance as I take profits, exit failed trades, and act on new setups.
As the market and its leaders begin to weaken, the process can reverse. In this example, that might mean reducing exposure from late May through June, or from June into early July, depending on the tickers and their sell signals. I may sell weaker positions, protect gains, and become more selective about committing new capital as market conditions deteriorate. A gradual deterioration may allow staged reductions, while a sharp breakdown can require a much faster response. The evidence determines how quickly I build exposure and how quickly I reduce it.
Leading Stocks Also Top at Different Times
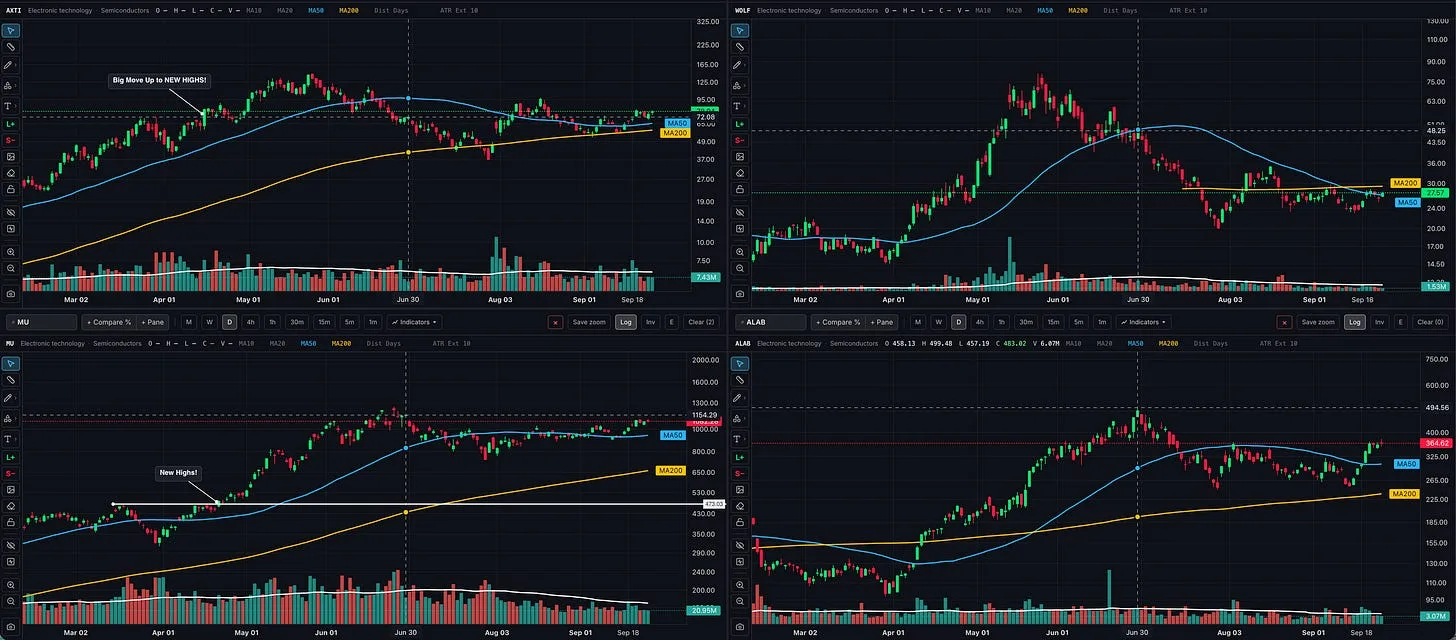
The same differences appeared near the end of this advance. AXTI and WOLF reached their peaks on May 26, ahead of QQQ’s June 3 peak. The technology sector ETF XLK also peaked on June 3, while SOXX continued to a June 22 peak. MU peaked on June 25, and MXL followed on June 30.
Those dates are easy to identify after the fact, but a peak date is not the same thing as an actionable sell signal. On June 3, we did not know with certainty that QQQ had reached its final high for the move. The heavy selling on June 5 and June 9, followed by a recovery that failed to regain the high, provided evidence that its behavior was changing. The practical task was to respond to that developing evidence according to our rules.
MU illustrates why the response still required attention to the individual stock. It pulled back on June 5, then recovered to new highs by June 15 while QQQ failed to do the same. We also noticed the deterioration in the broader market and the earlier weakness in other leaders. A strong stock can resist a weakening market for a while; that does not make it immune to the risk around it.
Let the Market, the Group, and the Stock Guide Your Decisions
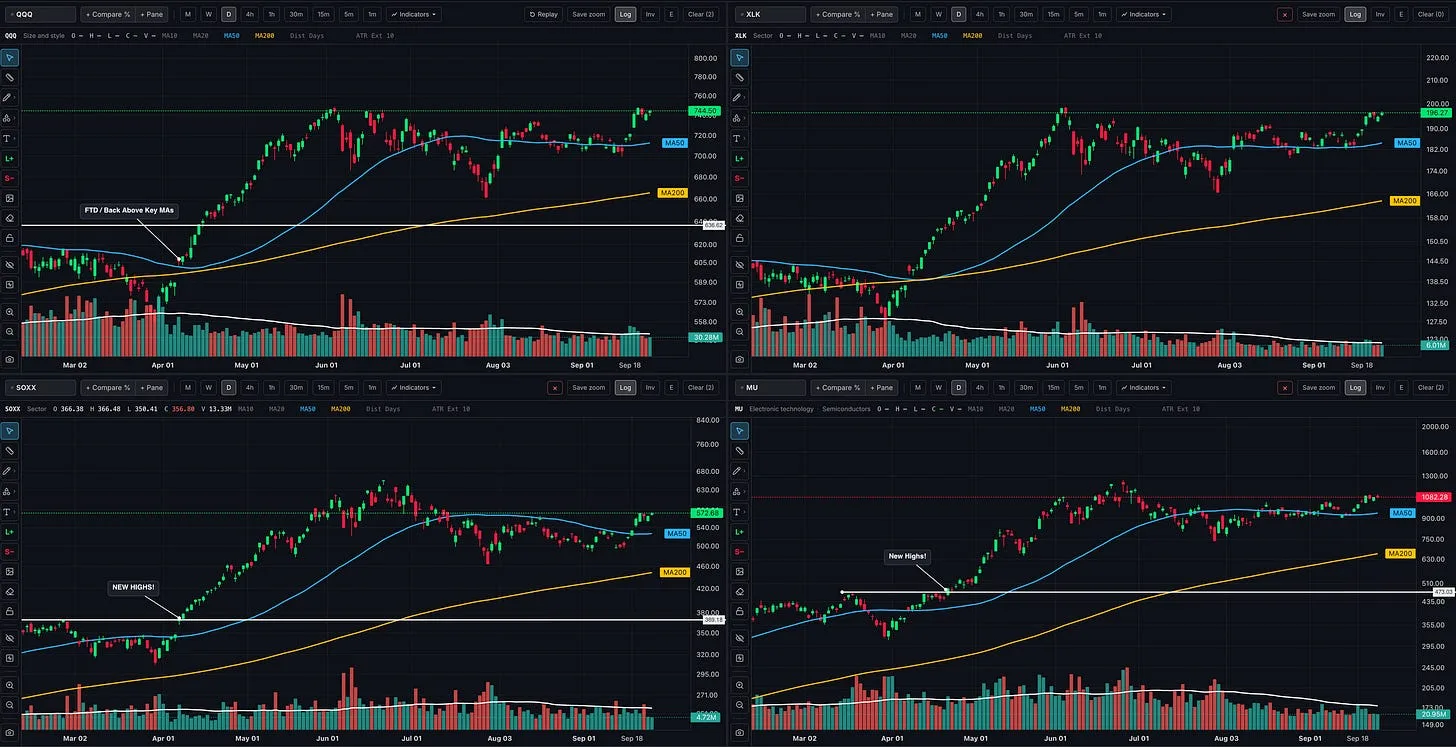
Even when I own MU, I want to know what AXTI, WOLF, and other leaders in the group are doing. Weakness spreading through those stocks can change how aggressively I want to trade, whether I want to add exposure, and how closely I need to protect existing gains. One weak peer is not an automatic instruction to sell every position. But repeatedly dismissing weakness because my own stock is still rising can leave me slow to recognize a broader change.
If a stock triggers my sell rules, I do not need to wait for the index to confirm that something has gone wrong. Sufficient deterioration in the market can also require me to reduce overall exposure, even while some holdings remain relatively strong. That does not mean every down day requires selling or that every holding must be handled identically.
Missing the First Move Does Not End the Process
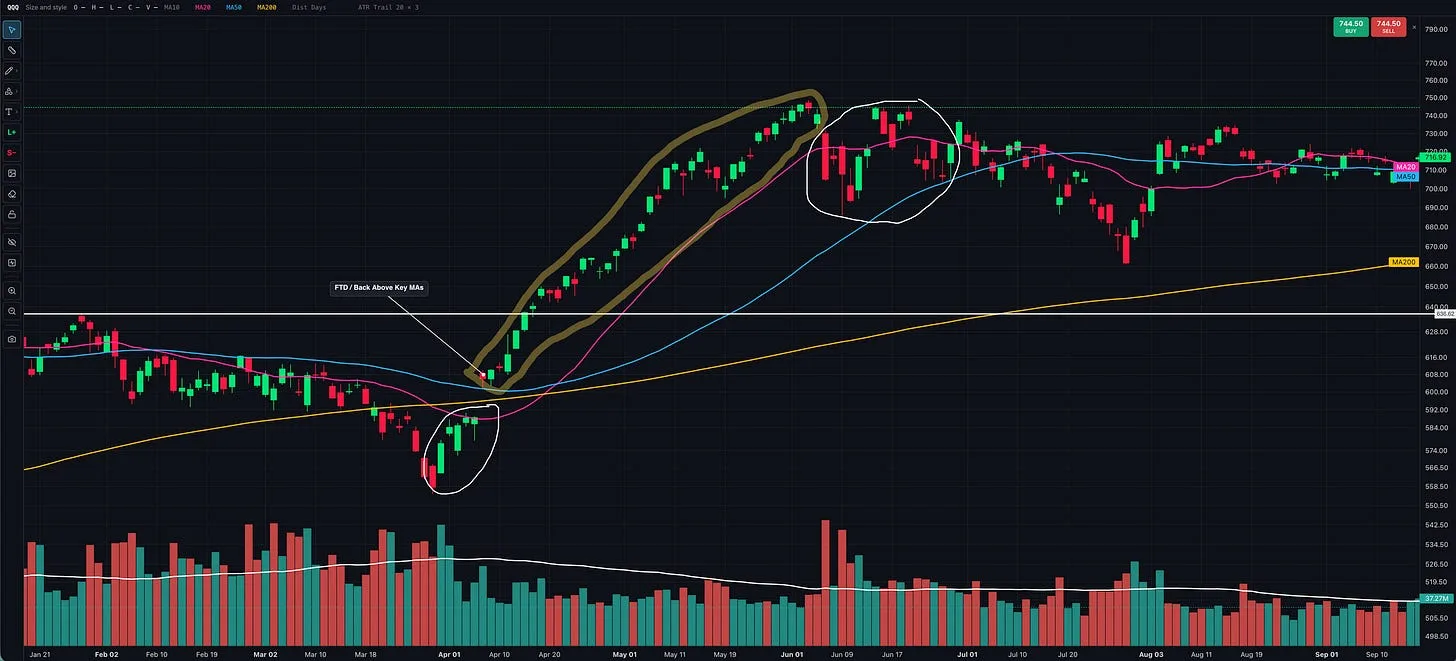
Our goal is not to buy the exact bottom or sell the exact top. We want evidence from price and volume that conditions are improving or deteriorating. Waiting for that evidence means accepting that part of a move may already have occurred. Our job is to recognize qualifying opportunities, commit capital as conditions support it, and respond when the evidence changes. The market, the industry group, and the individual stock all contribute to those decisions.
If you missed an early breakout, return to your watchlist and look for the next qualifying setup. If you are already invested, keep reviewing the leaders and the market around them, even while your own positions are working. You do not need every chart to move at the same time. You need a process for responding when they do not.
Ready to Learn More?
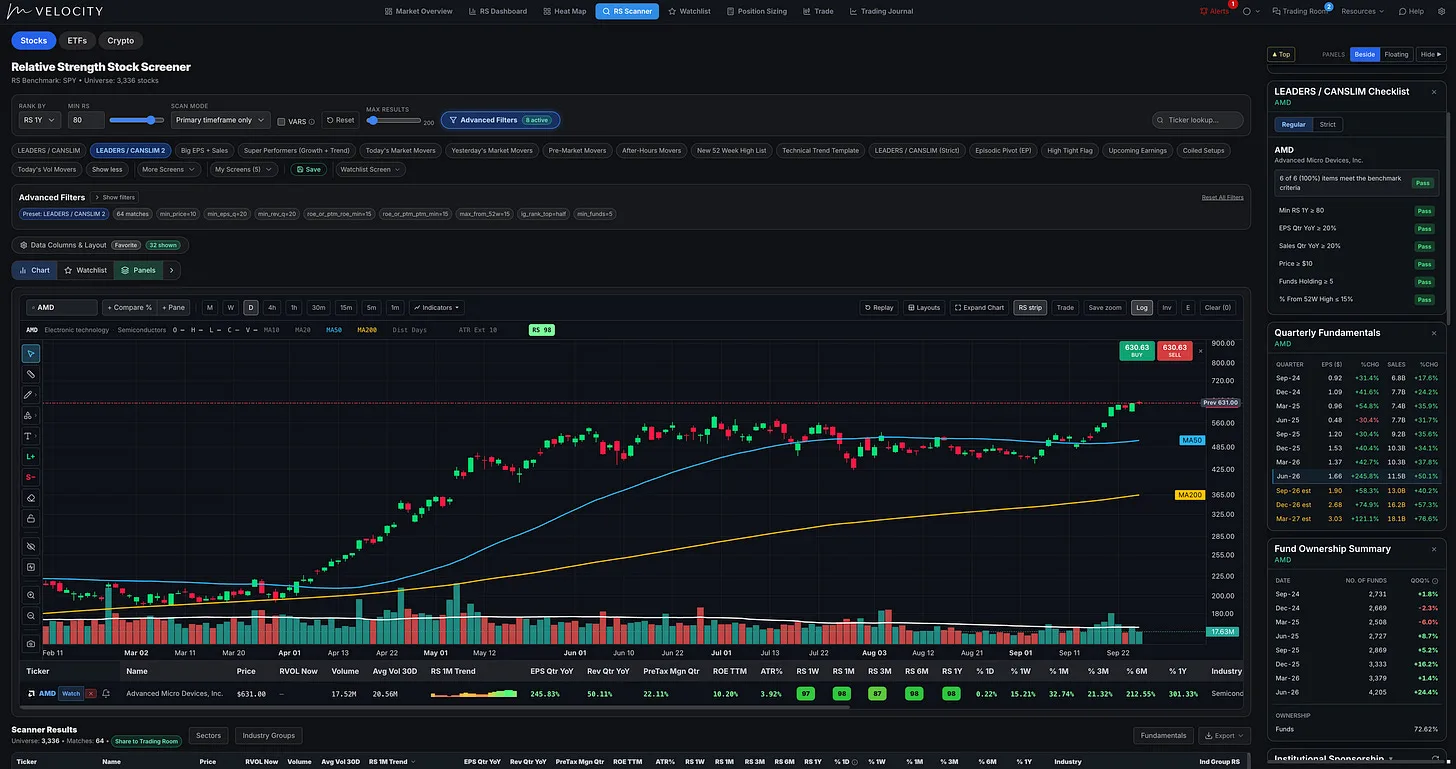
To learn how to apply this process, get access to the Momentum Trading Strategy Course and MTS Velocity. The software includes a Stock Screener, Trading Journal, Trading Room, and additional tools to help you find candidates, plan trades, and review your decisions. Build a repeatable process for knowing what to look for, when to act, and how much to risk.
More in Strategy & Tactics
All Strategy & Tactics articles →
Oct 8, 2026 · Strategy & Tactics
Up 100% and Still Buyable? What Traders Get Wrong About Extended Stocks
How to identify proper buy points, avoid chasing stock breakouts, and manage entry risk using lessons from William O’Neil, Mark Minervini, David Ryan, and Dan Zanger.
- Momentum Trading
- VCP
- position trading
- Growth Stock Trading
- David Ryan
- Flag Pattern
- chart patterns
- Cup and Handle
Sep 25, 2026 · Strategy & Tactics
Stage Analysis: How to Spot Stage 3 in Real Time
Recognize a developing Stage 3 using Stan Weinstein’s framework, with real chart examples, warning signs, and lessons for protecting your gains
- Momentum Trading
- Nasdaq
- technical analysis
- CANSLIM
- position trading
- Stan Weinstein
- QQQ
- Find True Market Leaders

Sep 9, 2026 · Strategy & Tactics
100+ Years of Winning Stocks: The Patterns That Keep Repeating
A decade-by-decade video walkthrough of the trends, setups, and buy points behind some of history’s biggest stock market winners.
- how to make money in stocks
- Momentum Trading
- technical analysis
- position trading
- Growth Stock Trading
- biggest winning stocks
- William O'Neil
- Cup with handle