Momentum Trading Strategy

Notes

Short lessons on momentum trading, every day.

Every note from Substack, in one place: risk, setups, leading stocks, market conditions and the mindset behind them. Search them, browse by topic, or filter by stock.

Showing 1–20 of 1222 notes

View on Substack ↗

19 for 19. But Don’t Buy the Headline.

Across the 19 midterm elections from 1950 through 2022, the S&P 500 finished higher twelve months later every single time.

A 100% historical record. Not a guarantee of what happens next.

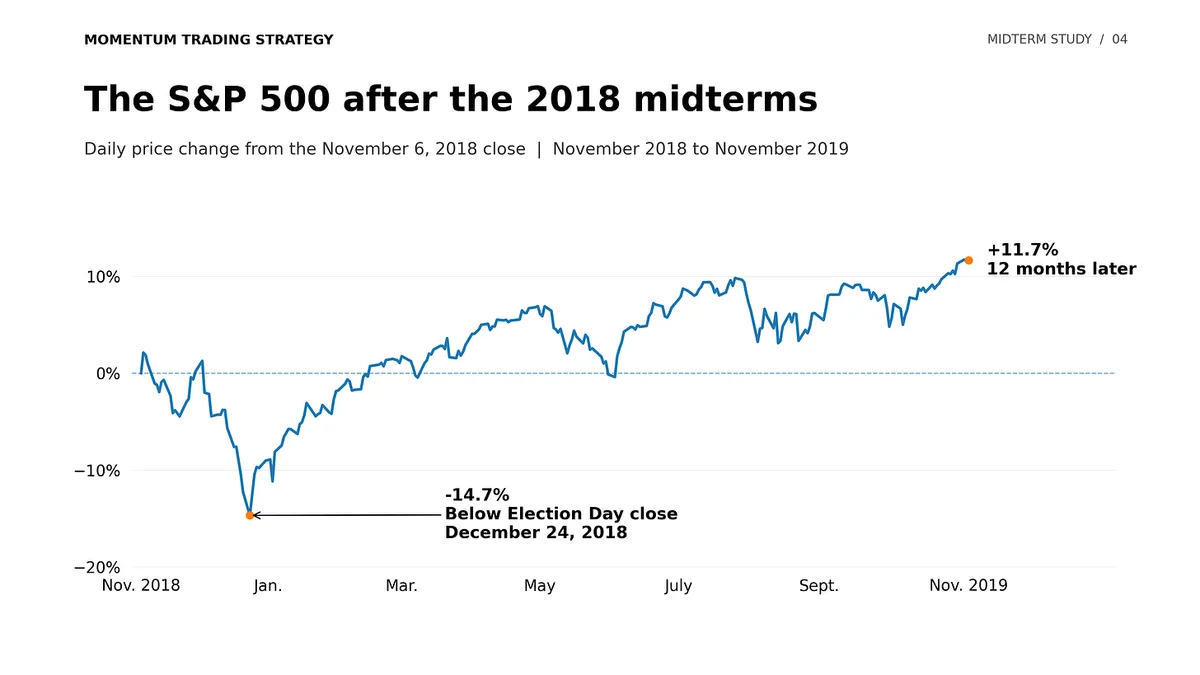
But before anyone decides to buy the index as soon as the election is over, look at 2018.

The market finished 11.7% higher twelve months later. Another win for the statistics.

But first, it fell 14.7% below its Election Day close, bottoming in late December.

Higher twelve months later does not mean higher tomorrow.

That’s the distinction between an interesting market fact and an actual trading signal.

If conditions begin to improve, you can bet I’ll be ready with my watchlists and an eye on the stocks and industry groups showing strength in MTS Velocity, but the market still has to confirm the turn.

I broke down all 19 elections, the three, six, and twelve-month results, and the path behind the headline in the short post below.

https://tradingmomentum.substack.com/p/19-for-19-but-dont-buy-the-headline

View on Substack ↗

Great Traders Know When to Do Absolutely Nothing.

Great traders get aggressive when market conditions are right. Often far more aggressive than the average trader.

But what separates them from the average trader is their behavior when conditions are poor.

They go quiet. Trading activity drops dramatically, sometimes to practically zero.

Meanwhile, the average trader keeps trading.

I think social media has made this problem worse. Even experienced traders can feel pressure to share tickers, discuss setups, and stay active when they know conditions aren’t conducive to their strategy.

There’s always an audience looking for the next stock idea. New traders are entering the market at different times, many eager to get started regardless of the environment.

But the market doesn’t care when you’re ready to trade.

And this brings me to an even more important point.

Great traders don’t just know when to shift from aggressive to defensive, or even completely dormant.

They know how to use those dormant periods to become better traders.

They’re reviewing mistakes from the last active period, refining their setups and processes, improving their stock screens, and backtesting to understand which criteria have consistently identified the biggest winners.

They’re doing the work that most traders find boring.

Meanwhile, the average trader is trying to improve by simply trading more.

But in poor market conditions, that time might be far better spent opening a book, taking a course, reviewing brokerage statements, and studying every mistake from the last several months.

I’d bet on the trader doing that work over the trader who feels compelled to trade every day, nine times out of ten.

Now, don’t misunderstand me. Experience and repetition are absolutely necessary to become a great trader.

But repetitions aren’t automatically productive. Not when you’re reinforcing bad habits or forcing a strategy into an environment where it has little edge.

If you truly want to trade constantly, you need to develop different systems for different market environments.

A strategy designed for a sideways, range-bound market isn’t necessarily going to work during a powerful Stage 2 advance driven by breakouts. And vice versa.

But trying to master two completely different systems simultaneously is considerably harder than mastering one first.

Learn your strategy. Understand the conditions where it performs best. Get aggressive when those conditions appear. And when they disappear, have the discipline to step aside.

Use that time to improve.

Because sometimes the work that makes you a better trader has absolutely nothing to do with placing another trade.

View on Substack ↗

Different Patterns. The Same Thing I’m Buying.

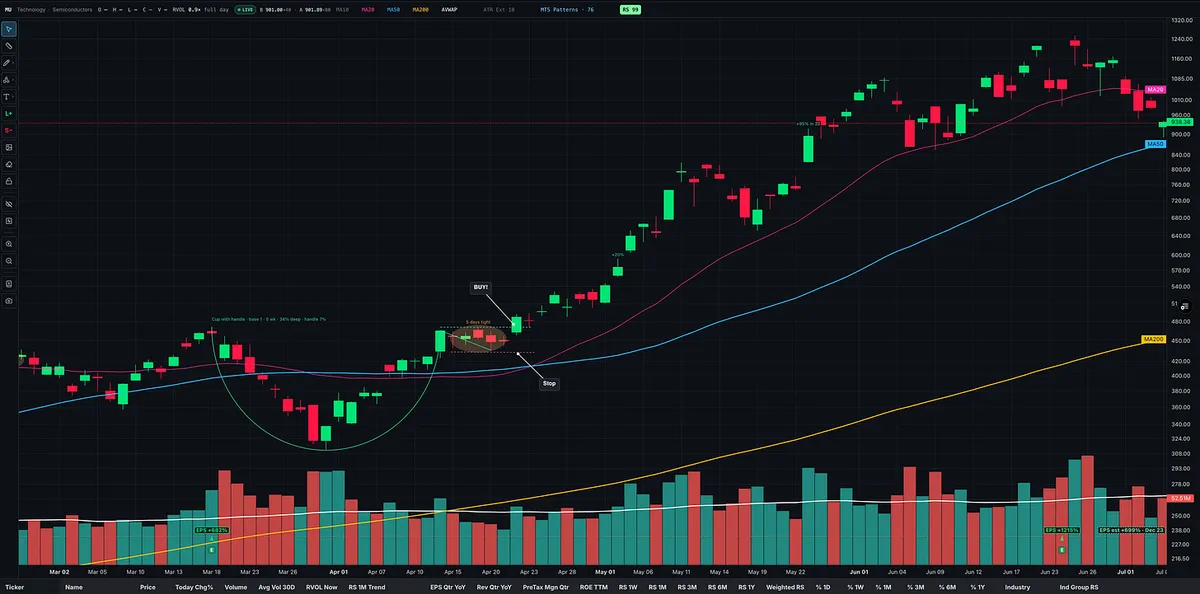
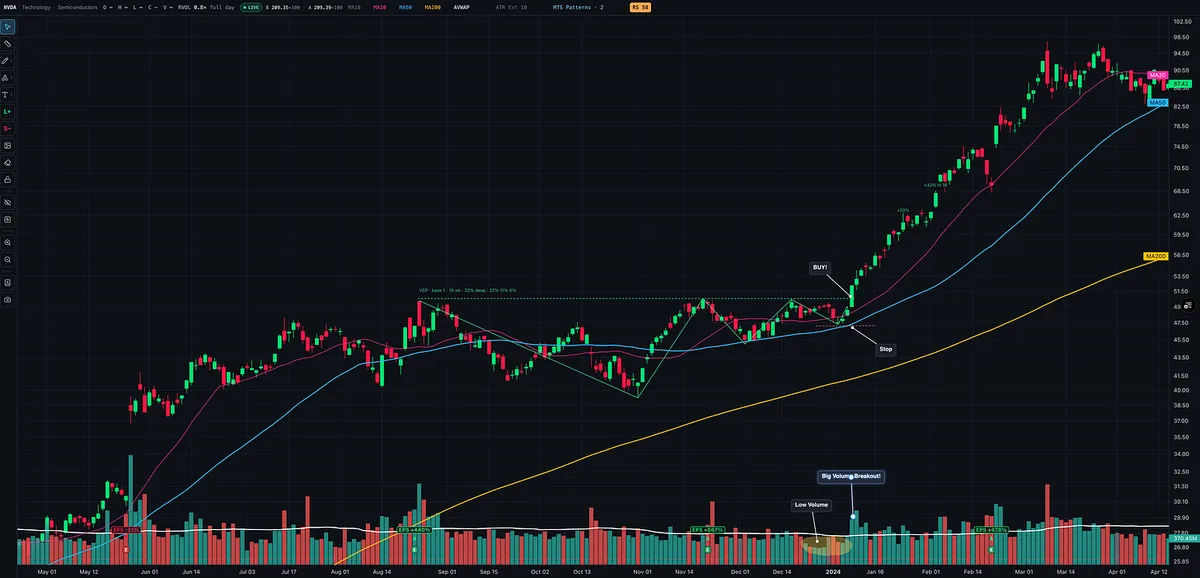
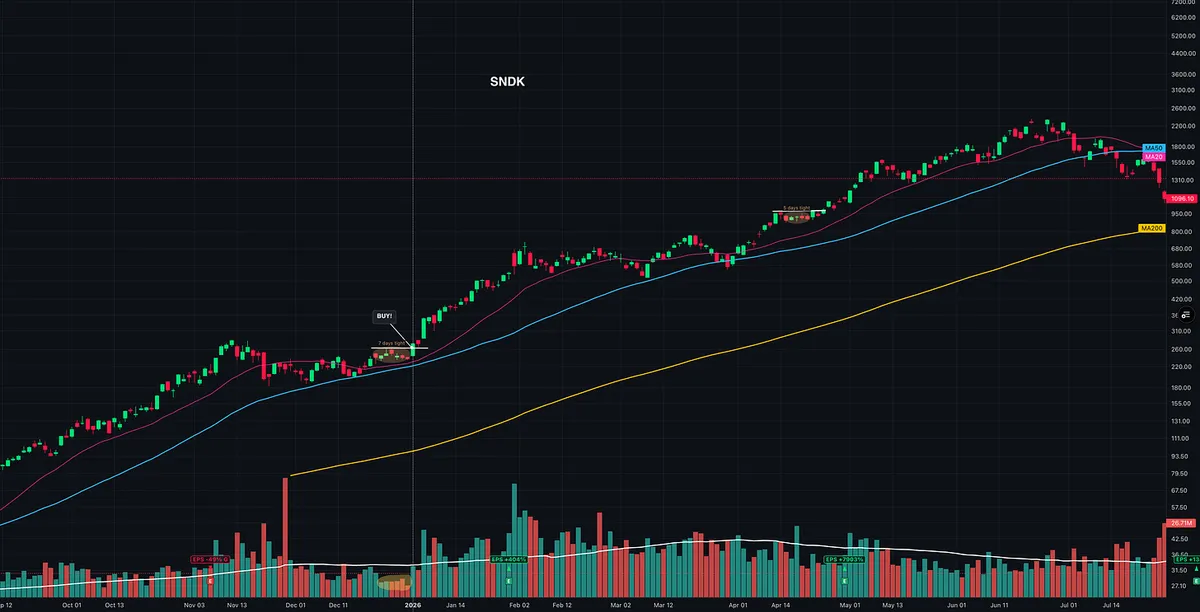
Cup with handle. VCP. Flat base.

The names differ, but many of these setups share something important: price tightens before the next potential advance.

After studying charts and trading long enough, you start paying more attention to that behavior than to what you call the pattern.

I’ll be honest: I don’t put a name to every setup anymore. A cup with handle can also have VCP characteristics. Several patterns can overlap on the same chart.

What interests me is the sequence:

  • A high-momentum stock makes a strong advance, ideally on heavy volume.

  • It consolidates or pulls back, with price ranges narrowing.

  • Volume dries up or falls below average as the action tightens.

  • Price begins moving higher through an actionable level.

That tightening is where I start looking for an entry.

The context matters. I’m looking for this behavior in a strong stock within an established uptrend. Quiet trading by itself doesn’t make something worth buying.

Ideally, volume expands as price breaks out. Sometimes that expansion arrives a day or two later, adding confirmation while price continues acting right.

The tight area also helps me identify a logical point where I’m wrong. That might be a nearby price low or the bottom of the consolidation, depending on the setup. I want the structure to justify the stop and the potential reward to justify the risk.

A stop shouldn’t be tight simply because I want to buy more shares.

Pattern names and textbook examples are useful for learning. They help beginners understand what constructive price action can look like.

But they can also hold you back if you start looking for an exact match.

Real charts have variations. The handle might look a little different. The contractions might be less symmetrical. A setup might have characteristics of several patterns rather than fit neatly into one category.

If you insist on finding the perfect textbook picture, you can miss the actual opportunity.

After a year of teaching here on Substack, this is one of the biggest things I see beginners struggle with. They’re searching for the exact shape they memorized instead of recognizing the price and volume behavior that makes the setup worth considering.

The chart doesn’t have to look exactly like the illustration in a book to offer a good entry.

I’m looking for strength, followed by tightening price action and quieter volume, then an entry as price turns higher with a clear place to exit if it fails.

Call the pattern whatever you want. That’s the behavior I’m buying.

View on Substack ↗

Your Stock Has a Personality. Learn to Read It.

So much of trading comes down to recognizing a trend and finding a place to participate where the potential reward justifies the risk.

Stocks can also develop their own personality. Watch them closely enough, and you begin to recognize how they advance, pull back, and find support.

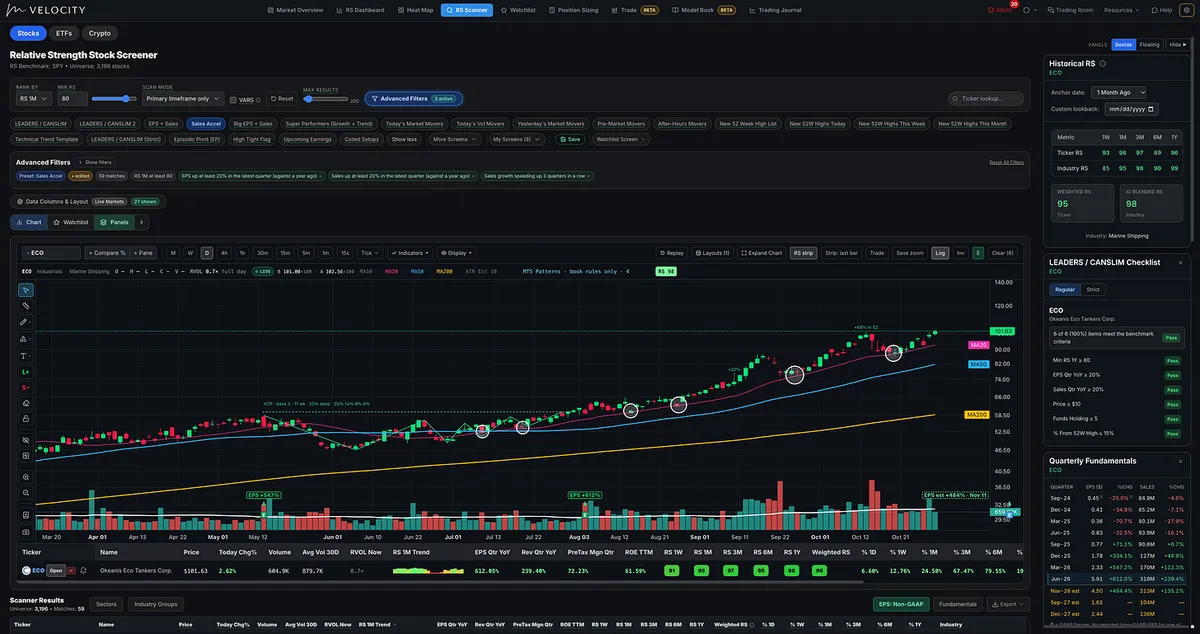
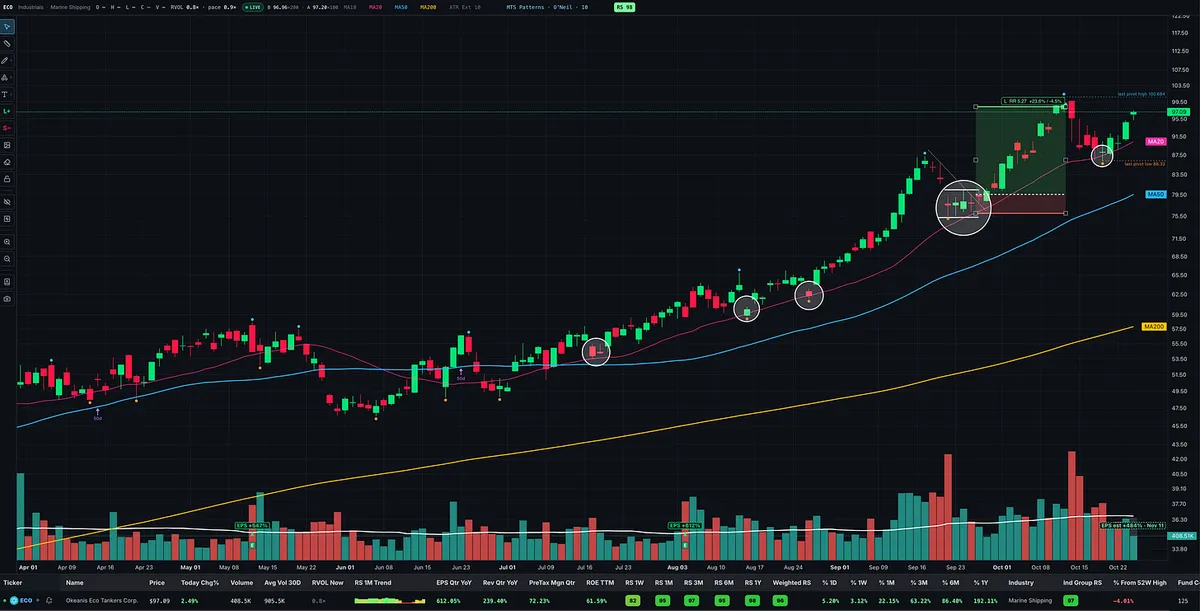
ECO is a good example.

While the broader market has been chopping sideways, oil and gas and marine shipping have been among the more consistent pockets of strength.

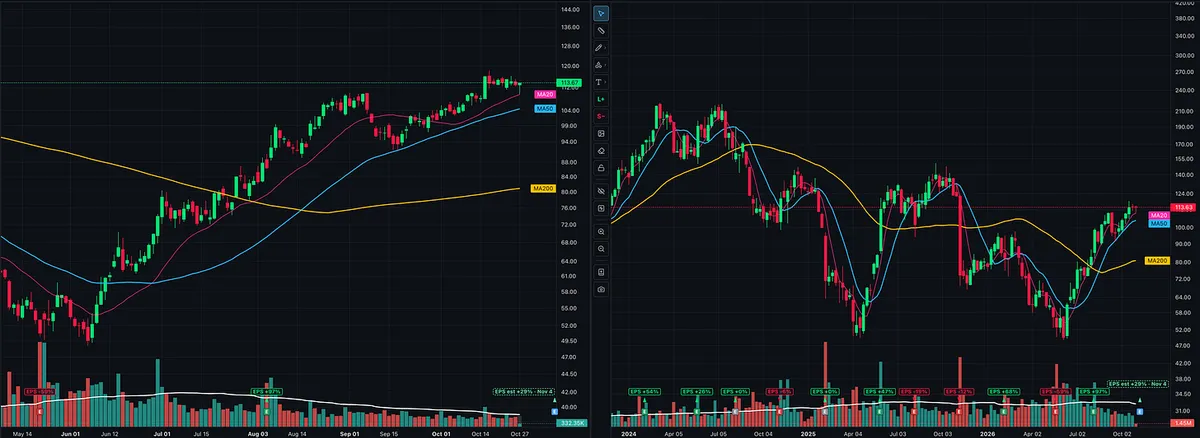
ECO sits in marine shipping, with strong recent earnings and sales growth, strong margins, and excellent relative strength. Then look at its behavior on the chart: repeated pullbacks and sideways pauses near the rising 20-day moving average before the advance resumes.

You don’t have to recognize that behavior on the first pullback, but you want to recognize it while there’s still a constructive entry, without chasing after price has stretched far above support. For more on how I approach these entries, read my article on pullbacks or take the MTS course.

Another stock might ride its 10-day. Another might repeatedly find support near its 50-day. Others won’t show a useful relationship with any moving average.

The moving average is a reference point. The stock’s response around it is what deserves your attention.

A touch of the line alone isn’t a reason to buy. I want to see how price behaves, whether support actually develops, and whether the stock begins turning higher.

Then I need an entry with a clear point where I’m wrong. Depending on the setup, that could be the day’s low, the prior day’s low, or the low of the pullback. That level might sit just above or below the moving average.

This is pattern recognition in action. It goes beyond identifying a cup with handle or a VCP. It includes recognizing recurring behavior within an individual stock and understanding it in context:

  • Where is strength in the market?

  • Which stocks are leading those groups?

  • Do their fundamentals and relative strength support the picture?

  • Is there an actionable setup with clearly defined risk?

Studying past winners helps you know what to look for.

The opportunity comes from connecting those observations while the potential reward still justifies the bet.

View on Substack ↗

The Most Expensive Words in Trading: “I’m Still Right.”

Watch how your thinking changes after you buy a stock.

Before the entry, you scrutinize every weakness. After the entry, you start explaining those weaknesses away.

The breakout fails. You give it more room. Selling pressure increases. You look for someone with a bullish opinion. The exit you planned becomes negotiable.

At what point did you become more interested in defending the trade than evaluating it?

Marcus Aurelius wrote in Meditations:

“It’s the truth I’m after, and the truth never harmed anyone. What harms us is to persist in self-deceit and ignorance.”

That’s a demanding standard for a trader.

You spent countless hours researching the company. You liked the earnings, the chart, the story. Maybe you even told other people it was going higher.

Now changing your mind feels like admitting something about yourself.

  • How could I have been so wrong?

  • What will people think?

  • What if I sell and it goes right back up?

Those questions can keep you holding long after your original reason for owning the stock has disappeared.

Becoming a better trader requires being willing to disappoint the version of yourself that placed the trade.

That means deciding what would invalidate your setup before you enter, then honoring that decision when it becomes uncomfortable.

It also means being willing to revisit a stock you sold if a new setup develops. Your previous loss doesn’t disqualify the next opportunity.

Ask yourself: What evidence would change my mind, and have I already seen it?

Your research deserves an honest review. Your capital deserves a decision based on what’s happening now.

Do you want to be right, or do you want to make money?

View on Substack ↗

The Market Can Go Nowhere and Still Wear You Out.

Brian Shannon has a saying: “If they don’t scare you out, they’ll wear you out.”

That’s one of the best descriptions of the market we’ve been in.

A sharp selloff tests your nerves. A sideways market tests your patience. Rallies get your hopes up, reversals take them back, and weeks of activity produce very little progress.

Eventually, the frustration starts affecting your decisions. You force a trade. Lower your standards. Take a bigger position because you’re tired of waiting. Start questioning your process because the environment isn’t rewarding it right now.

That’s how a sideways market wears you out. It chips away at your discipline.

For many of you who have been struggling, consider how much of that struggle comes from fighting a sideways, highly rotational, choppy market. Our style of growth and momentum trading depends on sustained trends. When leadership keeps rotating and moves keep reversing, pushing harder can just dig a deeper hole.

This year has been a great example of how a few productive months can make your entire year. If you traded April through June well, you could have accomplished that. The challenge is keeping those gains through the stretches that follow.

You don’t have to make money every month, but you do have to avoid giving back your progress trying to force opportunities.

If you’ve been doing well, great. Keep doing what’s working, but if you haven’t, ask yourself:

Why am I pushing so hard in conditions that don’t favor my strategy?

My job is to protect my capital, stay selective, and let the setups earn my exposure.

The market doesn’t owe me an opportunity every day, and my frustration isn’t a buy signal.

View on Substack ↗

Great Fundamentals Don’t Cancel a Sell Signal.

You can spend hours analyzing earnings, valuations, economic data, and every headline on your screen, but price gets the final word.

That’s what I respect most about systematic trend followers. They follow their rules even when the news makes it uncomfortable.

If the trend remains intact, they stay with it. Scary headlines alone aren’t a reason to sell.

When their exit signal triggers, they get out. A compelling story isn’t a reason to keep holding.

That’s the discipline I take from William O’Neil, David Ryan, and Mark Minervini:

Fundamentals and technicals help me decide what to buy. Technicals and price action tell me when to sell.

Every pullback isn’t an exit signal, but when my sell rules trigger, strong earnings, an exciting product, or my conviction in the company don’t get to overrule them.

I can still love the business after I sell the stock and I can always get back in.

My job is to protect and grow my capital. When my sell signal hits, that's all that matters.

View on Substack ↗

Don’t Fight the Fed. Let the Market Have the Final Word.

William O’Neil. Martin Zweig. Mark Minervini. Dan Zanger. David Ryan.

On Fed day, the common thread across their books is worth remembering: your opinion must yield to what the market is actually doing.

Zweig explains why the Fed matters: falling interest rates can lower companies’ borrowing costs and make stocks more attractive relative to interest-bearing alternatives. Rising rates can work in the opposite direction.

O’Neil identifies Fed rate changes as valuable indicators. Zanger explicitly names interest rates and Fed liquidity among the forces driving stocks.

The shared discipline across all five: let price action guide your decisions and keep risk under control.

That means watching whether leading stocks are breaking out and holding their gains, whether buying has volume behind it, and whether your own positions are working. Increase exposure as the evidence improves. Get defensive when it deteriorates. Keep losses small.

“Don’t fight the Fed” deserves a place beside “don’t fight the tape.” A favorable policy backdrop still needs confirmation from stocks.

Here’s how I’m applying that today:

Don’t confuse the first reaction with confirmation.

The announcement comes at 2:00 p.m. ET, followed by the press conference at 2:30. That first move can reverse as the market processes more information. An initial rally can fade. An initial selloff can turn into strength. The next 24-48 hours will tell us a lot.

For swing and position traders, give the announcement and press conference time to unfold. Watch the close and subsequent follow-through, while respecting your existing stops and risk limits. Waiting for confirmation never means ignoring a sell signal.

The first reaction doesn’t have to be the lasting direction.

Respect the Fed’s influence, let the market confirm, and never let a prediction become an excuse to ignore a loss.

View on Substack ↗

Trend Follower or Contrarian? You Can Be Both.

People talk about trend following and being a contrarian as though you have to choose one.

But going against the crowd’s opinion is not the same as going against the price trend.

As growth and momentum traders, we’re looking to identify leading stocks early in their Stage 2 advances and give our strongest positions room to run. We’re also taking profits, protecting gains, and cutting losses according to our rules. We don’t need to capture an entire move to make substantial money.

That’s a form of trend following, but there can also be a contrarian element to when we get involved.

George Soros understood both sides. He described following trends most of the time while continually watching for major inflection points, where conditions were changing and taking the other side could create an opportunity.

As he put it:

“Most of the time we are punished if we go against the trend. Only at an inflection point are we rewarded.”

The lesson isn’t to constantly fight the crowd. It’s to participate in a trend without becoming so attached to it that you cannot recognize a turn.

Think about what we’re looking for coming out of a bear market.

Investors may still be discouraged. The headlines may still sound terrible. After months of declines and failed rallies, buying stocks can feel like the last thing you should be doing.

But we’re watching for a change in character: improving price-and-volume action, an emerging pattern of higher highs and higher lows, and potential leaders breaking out of sound bases.

A leading stock might be emerging from a cup with handle or a double bottom. We’re not buying because it looks cheap or because we think the market has fallen enough. We’re buying because it is demonstrating strength.

The contrarian element is being willing to buy emerging strength while the prevailing opinion remains bearish.

Paul Tudor Jones described probing for market turns in Market Wizards, sometimes while a market was still declining, while cutting losses and reducing position size when wrong.

O’Neil’s approach emphasized confirmation of a new market uptrend and stocks reaching proper buy points. Minervini, Ryan, and Zanger have also described taking selective positions in strong individual stocks before the broader market confirms.

Those aren’t identical entry methods. Buying a leader that is already breaking out before the broader market confirms is different from buying a declining market in anticipation of a reversal. The common ground is taking controlled risks and adjusting as the evidence develops.

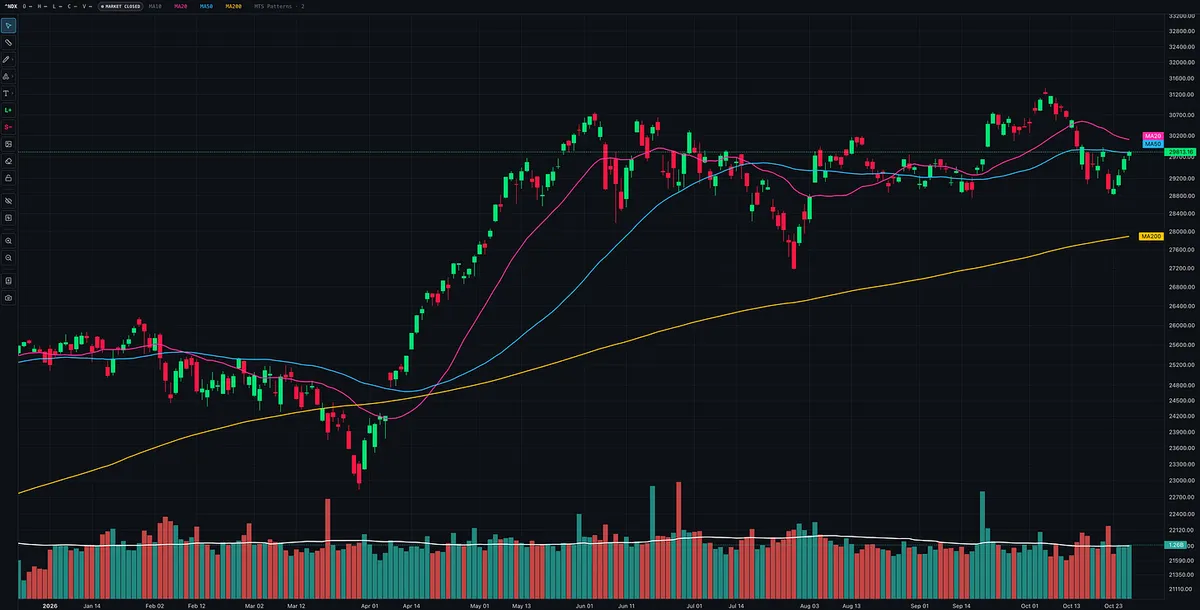
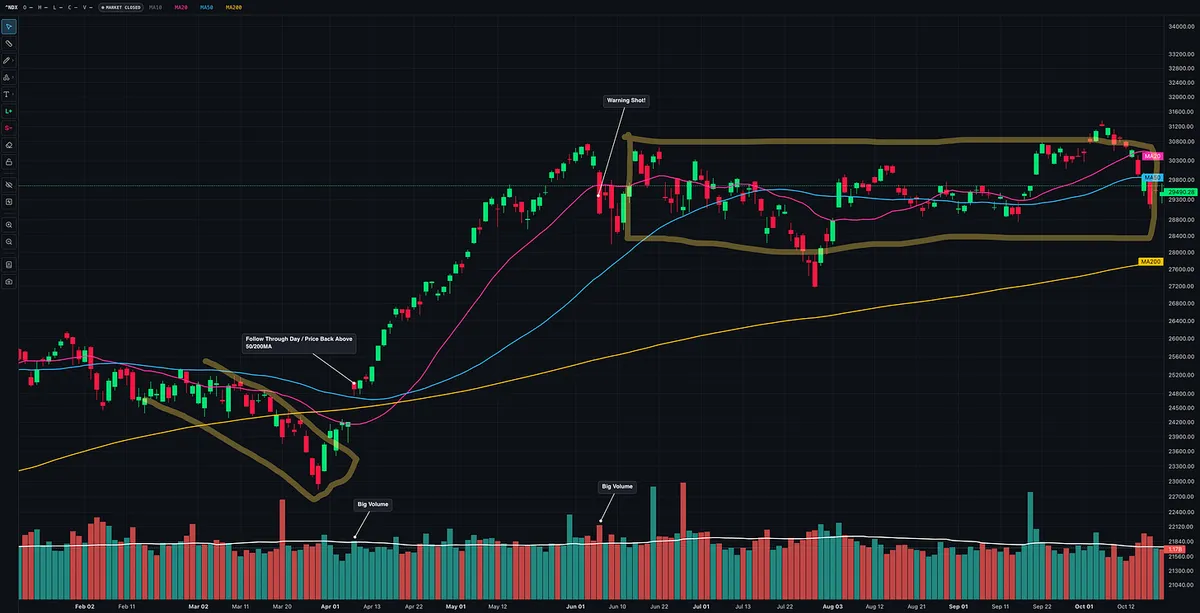
April 8 was a good example of how this works in practice.

We got a powerful gap up and a follow-through day, with price reclaiming the 50-day and 200-day moving averages. Many growth stocks were outperforming the indexes and setting up.

Just a week earlier, I had been bearish with price below the 200-day. But the evidence changed, so my outlook changed. I began sharing names in the Substack chat and explaining that the follow-through day was a signal to start testing the market with pilot buys in stocks offering proper entries.

That did not mean buying anything or immediately going all in. It meant taking initial positions with defined risk and increasing exposure as those trades proved themselves.

Sentiment around me was still largely bearish to neutral. The Iran conflict and supply-chain disruptions were weighing heavily on investors, but I wasn’t waiting for everyone to feel comfortable before acting on improving price action.

Then came the June 5 warning shot I wrote about.

After the powerful April and May advance, enthusiasm had returned. I had already sold some into strength while continuing to ride my winners, but the June 5 selloff signaled a change in character, and I tightened up to protect more of those gains.

That wasn’t a declaration that the bull market was over. I still left room for my strongest stocks to continue higher. But I wasn’t going to ignore deteriorating price action simply because people were still bullish. By late June - July, many of those leaders broke down.

Eventually, my remaining positions hit their stops as the market moved into a choppier, sideways environment.

That’s what I mean by being contrarian as a growth and momentum trader. When I began buying, sentiment was still cautious or bearish. By the time enthusiasm had returned, I was already taking profits, and the warning signs gave me reasons to tighten up further.

I wasn’t buying because people were bearish or selling because they were bullish. I was responding to price action while sentiment was still catching up.

For us, the objective isn’t to call the exact bottom or top. It’s to recognize emerging leadership, build exposure as our trades work, and protect ourselves when the evidence changes.

Be willing to act before the crowd feels comfortable. Stay with a winning trend while it works. And don’t let the crowd’s optimism talk you out of protecting your gains when the character changes.

View on Substack ↗

“Overbought” Can Keep You Out of the Biggest Winners

William O’Neil warned that a market could become heavily overbought near the beginning of a new bull move, or deeply oversold as a major decline was getting started. Those readings could lead traders to fight the very trend they needed to recognize.

Think about the environment we seek as momentum growth stock traders: a Stage 2 uptrend.

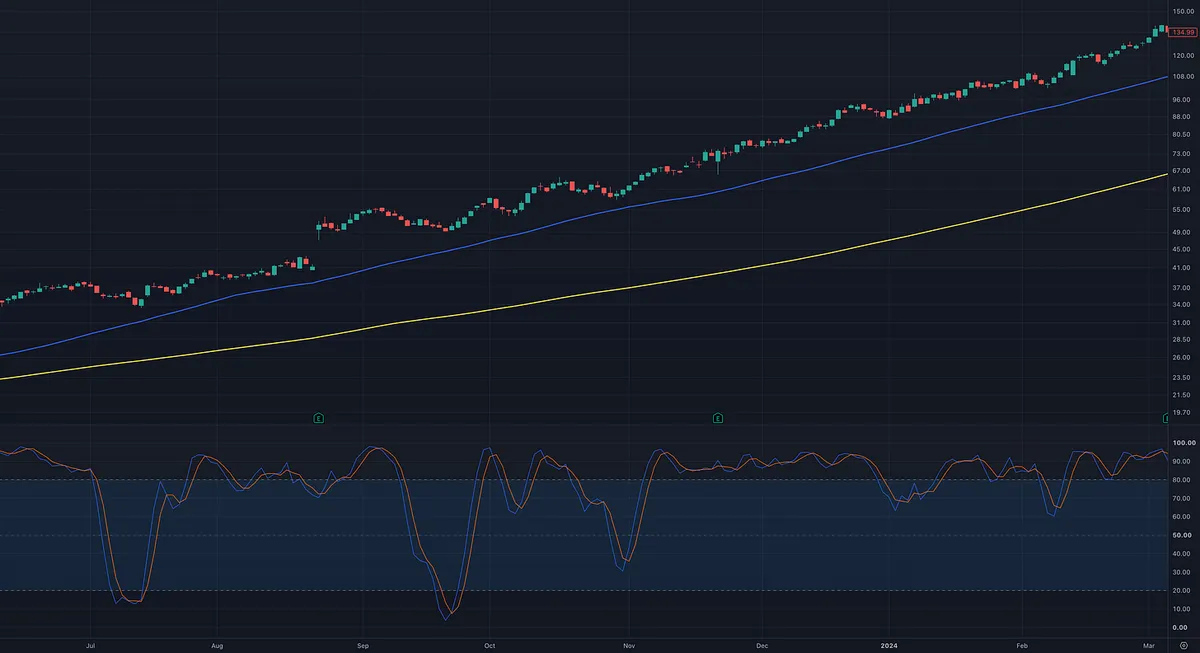
During a strong advance, oscillators such as RSI and stochastics can stay overbought for an extended period while price keeps climbing. The same thing happens in reverse during a Stage 4 decline: oversold can stay oversold as price keeps falling.

If you interpret those readings as automatic reversal signals, you can spend an entire advance nervous that the stock is about to collapse. You sell a winner prematurely, hesitate to buy a proper setup, or even short strength and get run over.

Now look at those same indicators during a sideways trading range.

With price moving between support and resistance, overbought and oversold readings can be more useful for identifying potential turns. Stochastics, for example, are generally better suited to broad trading ranges or slower trends. But those signals still need confirmation from price, and the range will eventually break.

The mistake goes both ways.

Traders sell strength in an uptrend because an oscillator says “overbought.” Then, in a sideways market, they keep buying breakout attempts and expecting the sustained follow-through of a strong Stage 2 advance.

In both cases, their expectations clash with the environment.

Oscillators can also help assess trend strength. The trouble comes from assuming every extreme means a reversal is imminent.

Understand the environment you’re trading, the behavior your strategy depends on, and what your indicator is actually measuring.

For a growth stock trader, that can also mean recognizing when conditions call for fewer trades and more patience.

View on Substack ↗

Your Setup Looks Great. Have You Zoomed Out?

One of the biggest mistakes I see is traders becoming so fixated on the type of trader they are that they only study one chart time frame.

They’re swing traders, so they focus exclusively on the daily chart. Or they’re position traders, so they assume the weekly chart is all they need.

Your intended holding period shouldn’t limit the information you use to evaluate a trade.

Look at David Ryan. He’s a CANSLIM position trader, yet he studies daily charts, just as a swing trader does. But he also examines the weekly and monthly charts to understand how that daily setup fits into the bigger picture.

An attractive daily setup isn’t enough when the longer-term picture looks poor, and the reverse matters just as much: a strong weekly or monthly chart doesn’t automatically mean the daily chart offers a good entry.

He’s looking for alignment, not just an attractive pattern on one chart.

This isn’t something I do simply because Ryan does it. I’ve been using multiple time frames in my own trading, and I’ve found much greater success when those time frames align. His approach reinforces something I’ve found valuable through my own experience.

A stock can look like it’s breaking out on the daily chart while the weekly chart reveals that it’s rallying directly into a substantial area of overhead resistance. Conversely, the weekly chart might show a promising longer-term structure while the daily chart tells you the entry still needs time to develop.

Looking at only one can leave you with an incomplete picture.

That doesn’t mean you need ten charts open or that alignment guarantees a winning trade. It means evaluating the setup in context rather than treating your preferred time frame as the entire story.

Being a swing trader doesn’t mean you should ignore the weekly chart. Being a position trader doesn’t mean you should ignore the daily.

Trade your chosen holding period, but stop letting that holding period dictate the only chart you’re willing to study.

View on Substack ↗

The Trading Quote Beginners Skip and Veterans Understand

“Win or lose, everybody gets what they want out of the market. Some people seem to like to lose, so they win by losing money.”

Ed Seykota

I would argue that many rookie and amateur traders will read this, think, “Who would want to lose money?” and move on. They’re looking for the next stock or setup, not a reason to examine themselves.

And dismissing this side of trading may be part of what keeps them stuck.

A seasoned trader who has spent years confronting their own mistakes reads it differently. They recognize that what you say you want from the market and what your behavior reveals can be two very different things.

And before you say, “That’s why I have rules. I’m systematic,” remember that these lessons aren’t just coming from discretionary, rule-based traders like me. Seykota was a systematic trader, and Richard Dennis taught traders a systematic approach. Dennis even said in Market Wizards that you could publish trading rules in the newspaper and no one would follow them. His point was that the challenge is maintaining the consistency, discipline, and confidence to follow those rules when things are going badly.

Having rules is not the same as having the discipline to follow them.

You can still override a system, increase risk impulsively, or abandon it when things get uncomfortable. Rules are essential, but they don’t make you immune to self-sabotage. If you think having a system means you’re finished working on yourself, you’re missing what Seykota, Dennis, and Van Tharp were teaching.

You say you want consistent profits, but keep choosing the excitement of unnecessary trades. You say you want to protect your capital, but refuse to take a small loss because proving yourself right matters more.

You say you want to learn to trade, but won’t make time to work through a course or read time-tested trading books. Yet you find hours every day to scroll social media and chase stock picks in trading rooms.

In other words, you say you want profits, but your behavior suggests that excitement, the satisfaction of being right, or a sense of belonging keeps taking priority. There is nothing wrong with wanting community or relationships. But feeling entertained, validated, or connected is not the same as becoming a profitable trader.

Why ignore that distinction? Maybe because the truth about ourselves can be uncomfortable to face, but that is also why facing it can be so freeing.

You may not consciously want to lose money. But something else keeps taking priority over making it.

To me, that is the deeper meaning of Seykota’s quote. Not that every loss is self-sabotage, but that we need to examine what we’re getting from behaviors we recognize, regret, and then repeat anyway.

The inexperienced trader asks, “Who would want to lose?”

The trader who has done the work asks, “What am I getting from this behavior that makes me keep repeating it?”

Answering that question honestly may do more for your trading than studying another chart while repeating the same mistakes.

View on Substack ↗

Portfolio Heat: Protect Capital and Give Winners Room

I manage risk in both new positions and open trades, but I’m stricter with new positions. They haven’t proven themselves yet. If several are getting hit at once, I take that as a signal to get more defensive.

With a strong winner, I may sell some into strength and give the remaining shares more room, but I still protect the profit. I don’t want to let a winner round-trip, and I don’t treat unrealized gains as money that doesn’t count.

When I assess portfolio heat, I look at how much my open positions could give back and where that risk is concentrated. Several stocks in one industry group can fall together, and a broad market selloff can hit leaders across groups.

How much heat I’m willing to carry depends on how my trades are working, the health of the market, and how concentrated my positions are. When conditions are strong, I may carry more risk. When trades are struggling or the market weakens, I pull back.

The balance is to be strict with unproven positions, give strong winners room to work, and keep the combined risk across the portfolio in view.

View on Substack ↗

ECO: Stop Overcomplicating Pullbacks

A lot of people make trading way more complicated than it needs to be. Sometimes you just need to watch how a stock behaves and recognize a repeating pattern.

Look at ECO and its 20-day moving average.

It’s in one of the strongest industry groups in the market, with high relative strength, massive earnings and sales growth, and strong margins.

Then look at the price action. Repeatedly, ECO touches or briefly undercuts its 20-day, finds buyers, and moves higher. Throughout that advance, it continues making higher highs and higher lows.

These are the kinds of pullbacks I look for to put the odds in my favor. Nothing is guaranteed, but the pattern gives you something specific to work with: an area where buyers have repeatedly stepped in and a nearby level to define your risk.

You can wait for price to turn up from support, or look for a tight consolidation like the one in late September. Price pulled back, tightened up just above the moving average it had been respecting, and then resumed its advance.

Depending on the entry, your stop might sit at the low of the day, the prior day’s low, below the tight consolidation, or slightly beneath the 20-day.

The point is to define a small initial risk while leaving room for a move worth several times that risk.

You don’t need to know how far the stock will go. You need to recognize the setup, know where you’re wrong, and manage the trade from there.

Just another way to buy pullbacks in leading stocks.

View on Substack ↗

PBF: Buying a Pullback With Tight Risk

A stock reaching its 50-day moving average is one thing. Buyers actually showing up there is another.

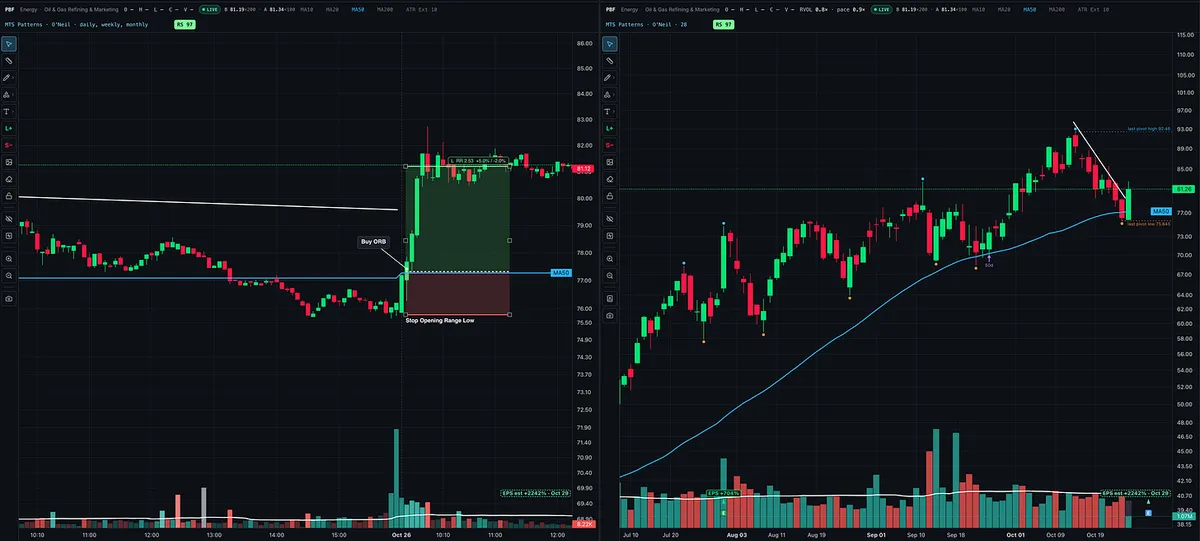
I watched PBF pull back on Thursday and Friday and posted it in MTS Stock Ideas on Friday. If you’ve taken the MTS Course and read my pullback article, this setup should look familiar.

After slightly undercutting its 50-day on Friday, PBF opened below it today and immediately attracted buyers.

One way I like to enter these setups is an opening range breakout (ORB), a technique discussed by traders like Dan Zanger and Kristjan Kullamägi.

The setup shown on the chart:

  • Entry: A break above the first opening-range candle’s high as price reclaimed the 50-day.

  • Stop: The opening range low, which was also the low of the day at that point.

  • Initial risk: Slightly less than 2% from entry to stop. Position size determines the actual account risk.

PBF subsequently moved more than 3R above the entry and was sitting around +2.5R at the time of the screenshot.

The lesson is to wait for price to turn up and show evidence of support. Too many traders buy simply because price has fallen to a moving average, without waiting for buyers to defend it.

Once a trade moves in your favor, you have choices: sell some into strength, move the remaining stop to breakeven, or retain the original stop to give it more room. Partial profits can help finance the remaining risk, but how much you sell and where you keep your stop matter.

This requires watching the open, so it won’t suit everyone’s schedule. It’s also only one way to buy a pullback.

For other approaches, read: https://tradingmomentum.substack.com/p/how-to-buy-pullbacks-in-leading-stocks.

ArticleHow to Buy Pullbacks in Leading Stocks Without Catching a Falling Knife
View on Substack ↗

Before You Borrow to Trade, Prove You Can Trade.

In How to Make Money in Stocks, William O’Neil writes:

“It usually takes most new investors at least two to three years before they gain enough market experience (by making several bad decisions, wasting time trying to reinvent the wheel, and experimenting with unsound beliefs) to be able to make and keep significant profits.”

His advice is to invest on a cash basis while learning. Considering margin comes later, after you have experience, a sound plan, and strict rules for both buying and selling.

That means giving yourself time to develop a method. Stop chasing the next shiny object, switching strategies after every difficult stretch, or assuming another indicator will solve a discipline problem. Study your mistakes. Refine your rules. Learn to follow them.

First, prove you can make money in a cash account. Then prove you can keep it.

A few winning trades don’t establish that. You need evidence that you can manage losses, size positions sensibly, and protect your account when conditions change. Borrowing more money adds financial risk to whatever habits you already have.

O’Neil also makes an important distinction about age: he generally reserves margin for younger investors who are still working and have more time before retirement.

Being young doesn’t excuse reckless trading, but as you get older, the time available to replace a major loss becomes a bigger consideration.

Your savings may represent decades of work, sacrifice, and money you deliberately set aside. Treat them accordingly.

Don’t put decades of hard-earned money at risk with borrowed money when you haven’t yet proved you can manage your own.

View on Substack ↗

You Think You Can Master Trading in Six Months? That's Insane.

Everyone has heard of Malcolm Gladwell's popularized idea that it takes roughly 10,000 hours of practice to achieve world-class performance.

Others have taken that idea further, arguing that it's not simply 10,000 hours, but thousands of repetitions performed correctly, with feedback and continuous improvement.

Yet it amazes me how many people enter one of the most competitive and difficult arenas in the world, the financial markets, and expect to become consistently profitable with a fraction of that effort.

They would never approach another profession this way. But somehow, when it comes to trading, they think the rules don't apply.

Years ago, I had reached a point where trading allowed me to be home with my children and open businesses with my wife.

Naturally, people would ask what I did for a living.

Occasionally, I would tell a close friend or someone I knew that I traded the financial markets. I eventually stopped doing that, and today I rarely tell anyone in my personal life that I trade.

Why?

Because I was amazed at how many successful, intelligent people assumed they could simply open a brokerage account and achieve the same results.

They had successful careers. Some had built businesses. Others were accomplished professionals and because they had succeeded elsewhere in life, they assumed they could quickly succeed in trading.

They saw the results, but had absolutely no appreciation for the years of work that went into producing them.

Over the past year on Substack, I've witnessed much of the same thinking.

I talk with people who struggle to see what I see on a stock chart or fully understand concepts explained in the books I recommend and the educational material I share.

And when they don't immediately get results, some begin questioning whether the methods actually work.

But here's what I find remarkable.

I don't even need to ask whether they've put in 10,000 hours or thousands of meaningful repetitions. In many cases, it's obvious they haven't come remotely close.

They haven't studied thousands of historical charts, experienced enough different market environments, or developed the pattern recognition that comes from years of deliberate practice.

Yet somehow, they expect professional-level results and when those results don't arrive quickly, they conclude that the strategy doesn't work, the education is worthless, or the whole thing must be a scam.

Think about how insane that sounds.

Would you expect to become a successful surgeon after reading a few medical books and practicing for six months?

Would you expect to compete professionally in golf because you've played a few hundred rounds?

Of course not.

But people routinely approach trading with exactly that mentality.

I'm not suggesting everyone needs precisely 10,000 hours to become profitable. That's not a scientifically established threshold, and practice alone doesn't guarantee success.

What I am saying is that expertise takes time, deliberate repetition, honest feedback, and experience. Trading is no exception.

In fact, the financial markets are particularly unforgiving because you're competing against highly skilled professionals, sophisticated institutions, and people who have dedicated decades to their craft.

Your intelligence, professional accomplishments, and success in another field do not automatically transfer into trading competence. And the market couldn't care less about your résumé.

Consider Mark D. Cook, one of the traders interviewed by Jack Schwager in Stock Market Wizards.

Cook's early trading career was filled with repeated setbacks and failures. Rather than giving up, he dedicated years to studying the markets, keeping detailed market diaries, documenting his trades, and carefully analyzing his results.

Schwager describes how those years of persistence and studying market behavior eventually helped Cook become consistently profitable.

His expertise came from years of repetition, observation, mistakes, and learning from those mistakes. Not simply from learning a trading strategy.

Before you conclude that a trading method doesn't work, ask yourself a much more uncomfortable question:

Have I actually put in the work necessary to understand and execute it properly?

Because there's an enormous difference between a method that doesn't work and a trader who hasn't yet developed the skill to make it work.

You cannot expect the rewards of a professional while approaching trading with the preparation of an amateur.

View on Substack ↗

The Market Outlook Changes. The Process Is What You Keep.

Every weekend, I publish The Big Picture Market Pulse. Beyond helping you understand the market, I want you to take away something lasting:

The process I use to prepare for the week ahead and lessons you can use to build your own.

That’s how I developed mine: studying what experienced traders examined, understanding why it mattered, and incorporating it into my routine.

Martin Zweig’s Winning on Wall Street became the foundation for my composite model. His name kept appearing in Market Wizards: David Ryan recommended his book; Michael Marcus, Bruce Kovner, Richard Dennis and Paul Tudor Jones praised his work; Marty Schwartz described consulting him. That got my attention.

William O’Neil emphasized the M in CANSLIM: market direction. Even an outstanding company can struggle when the general market is working against it.

Dr. Van Tharp reinforced another essential lesson: expecting the same trading system to work in every market environment is unreasonable. Know the conditions your strategy is designed for and recognize when they change.

Those lessons shaped my weekend routine: studying the general market, identifying leading industry groups, examining leading stocks, and deciding whether conditions support my style of trading.

As you read The Big Picture, you’re getting another viewpoint on the market, which has value. You’re also seeing everything I look at to give me context for my trading decisions.

Each week, as you learn what the report’s components mean, why they matter, and how they fit together, that understanding should help you build your own weekend routine or refine the one you already have.

That’s how I learned from the traders before me, and it’s the educational value I hope you take from The Big Picture: a stronger process for understanding the market and preparing to trade it.

View on Substack ↗

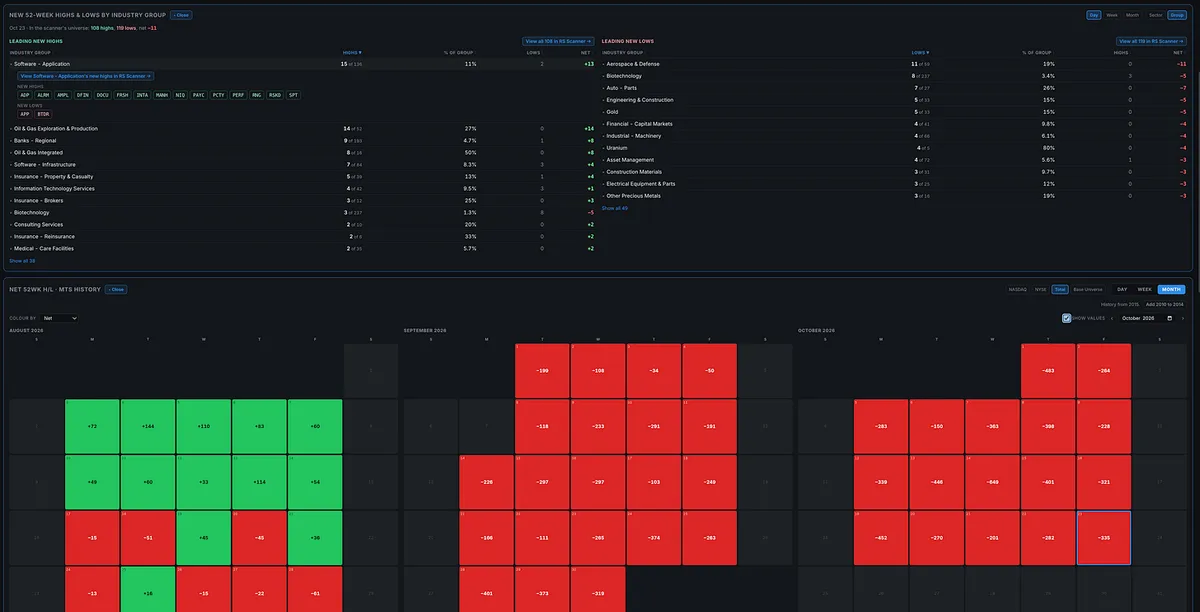
42 Straight Days of More New Lows Than Highs. Pay Attention.

For 42 consecutive trading sessions, new 52-week lows have outnumbered new 52-week highs across the Nasdaq and NYSE combined.

That includes every trading day in September and every trading day in October through October 23rd.

Day after day, more stocks are reaching their lowest prices in a year than their highest.

In How to Make Money in Stocks, William O’Neil describes his research across multiple bull market periods:

“stocks on the new-high list tended to go higher in price, while those on the new-low list tended to go lower.”

The new-high list helps reveal where leadership is developing. The new-low list shows where weakness is persisting.

O’Neil also emphasizes looking at what kinds of stocks are making new highs. A list heavily populated by preferred or defensive stocks can signal bearish conditions. A few stocks making highs doesn’t automatically mean healthy growth-stock leadership is spreading.

But this indicator also helps us recognize improvement. Look at the previous recoveries.

Following the March 30, 2026 lows, my combined Nasdaq and NYSE net new highs reading turned positive on April 6, then remained positive on April 7 and April 8.

April 8 brought follow-through-day confirmation. The S&P 500, Nasdaq Composite, and Nasdaq 100 also closed back above their 50-day and 200-day moving averages that day. Improving net new highs was accompanying the price recovery.

Go back to the 2025 tariff scare. Around the April 7 market low, new lows overwhelmed new highs.

By April 22, the combined reading had turned positive. The Nasdaq reclaimed its 20-day moving average the following day. By May 2, the major indexes were back above their 50-day averages, and positive net new highs readings were becoming much more consistent.

May 2025 had only four sessions in which new lows outnumbered new highs in my combined reading.

That is the change I want to see: price recovering, participation improving, and new highs beginning to outnumber new lows consistently.

Here’s where my interpretation differs from how many beginners react.

When breadth looks terrible, I recognize that a meaningful turnaround could be approaching. Markets often look ugly before a recovery begins.

But weak readings alone don’t tell me that the turn is close. Things can get considerably worse first.

During August, September, and October 2023, my combined reading showed only five positive sessions across all three months.

That weakness occurred during a correction within the broader bull market. Another month of negative net new highs is entirely possible, even when the longer-term bull market ultimately resumes.

A beginner sees extreme weakness and thinks, “This is overdone. It has to bounce.”

I see a reason to remain defensive while staying alert for a change.

Being ready for a turnaround is different from betting that you’ve found the bottom.

I don’t need to guess when the selling will end. I want confirmation through price, and leading-stock action. One positive reading can be encouraging; sustained improvement alongside stronger price action carries more weight.

Then the new-high list helps answer the next question: Where is the leadership?

Which sectors and industry groups are producing the most new 52-week highs? Which groups keep appearing? Within those groups, which stocks are showing the strongest earnings, sales, relative strength, and constructive chart patterns?

That is how this measure becomes more than a general market indicator. It becomes a way to focus your research on emerging leaders.

It’s exactly why I built net 52-week highs and lows into the MTS Velocity heat map and Market Overview dashboard, with the ability to examine sectors, industry groups, and the stocks within those groups.

I want to see whether the market is becoming healthier, then investigate where that strength is developing.

Respect the weakness. Stay ready for improvement. Wait for confirmation, then target the leaders in leading groups.

View on Substack ↗

One of Trading’s Biggest Myths: “Those Methods Don’t Work Anymore.”

I’ve received so many messages telling me that what William O’Neil and Mark Minervini teach doesn’t work in today’s market. The setups are outdated. The entries don’t work. Managing risk with stops belongs to another era.

Technology supposedly changed everything.

Before accepting that argument, spend some time studying market history.

In Market Wizards, Jack Schwager asks Jim Rogers whether markets are essentially the same as they were in the 1970s, 1960s, and 1950s. Rogers takes the comparison back even further, to the nineteenth century, explaining:

“The same things make markets go up and down. They have not changed the rules of supply and demand.”

That principle still matters.

Of course trading has evolved. We can execute orders electronically, visualize thousands of charts instantly, and receive information at speeds a trader reading ticker tape in the 1920s couldn’t imagine. Algorithms have also changed liquidity and short-term trading behavior.

None of that has eliminated supply and demand, fear and greed, or the tendency of crowds to chase rising prices and panic when they fall.

Some people tell me stocks don’t even move the way they used to.

Then I show them a chart from the 1990s. Without the name and dates, they can’t tell whether they’re looking at a stock from decades ago or one trading today.

When I study the biggest winners of the last few years, I see many of the same characteristics in winners from decades ago, even a century ago: bases, tightening price action, breakouts, powerful advances, and eventual deterioration.

The companies change. The industries change. The stories attracting investors change. Those recurring patterns remain recognizable.

Before you decide the market has outgrown the lessons of O’Neil and Minervini, make sure you’ve actually studied those lessons and the charts behind them.