Momentum Trading Strategy

Notes

Chart Setups & Entries

When and where to buy a stock you have already found: chart patterns, buy points and entry tactics.

Showing 1–20 of 185 notes

View on Substack ↗

Missed the Breakout? Learn to Buy the Pullback.

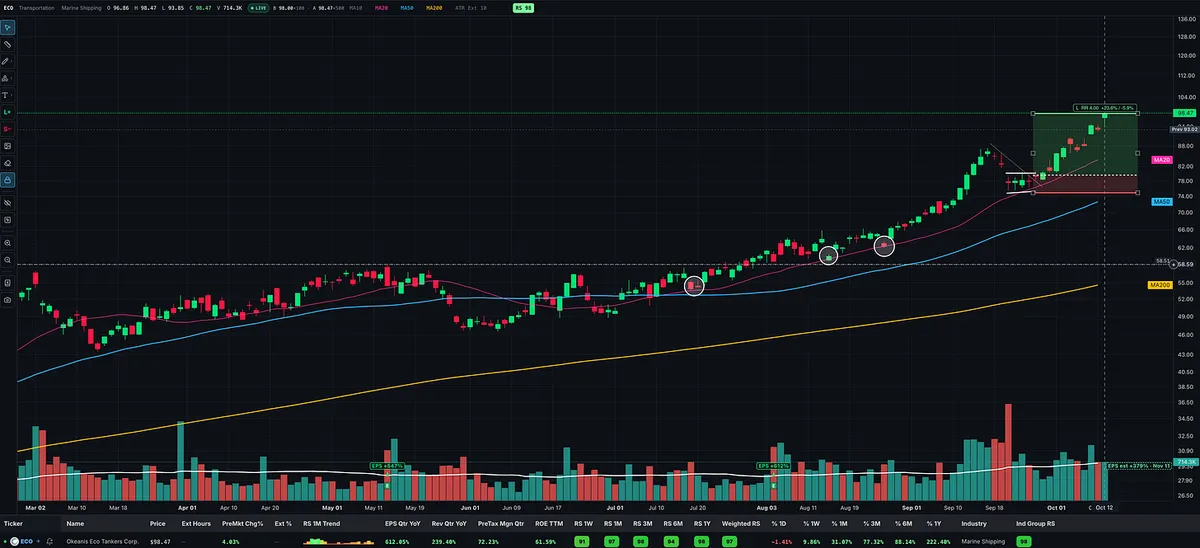
A stock moving beyond its base breakout doesn’t mean you’ve missed every opportunity to get involved. But if you want to participate in the next leg higher, you need to learn how to recognize and buy constructive pullbacks.

You also need to understand which entries the market is rewarding.

Just as we study the market environment, we should study how leading stocks are behaving.

Are breakouts to new highs following through? Or are better opportunities appearing earlier, as stocks find support and begin turning higher?

If you’re always waiting for a new high before entering, pay attention to how much of the move has already happened by the time you buy.

Buying pullbacks has been critical for me over the last few years. It has helped me get involved in several of my biggest winners. LITE and SNDK.

The key is recognizing a pullback within an established uptrend, watching for evidence of support, and identifying an entry where you can clearly define your risk.

Study more than which stocks are working. Study which entries are working.

That can make a meaningful difference in both the opportunities you recognize and the risk you take.

View on Substack ↗

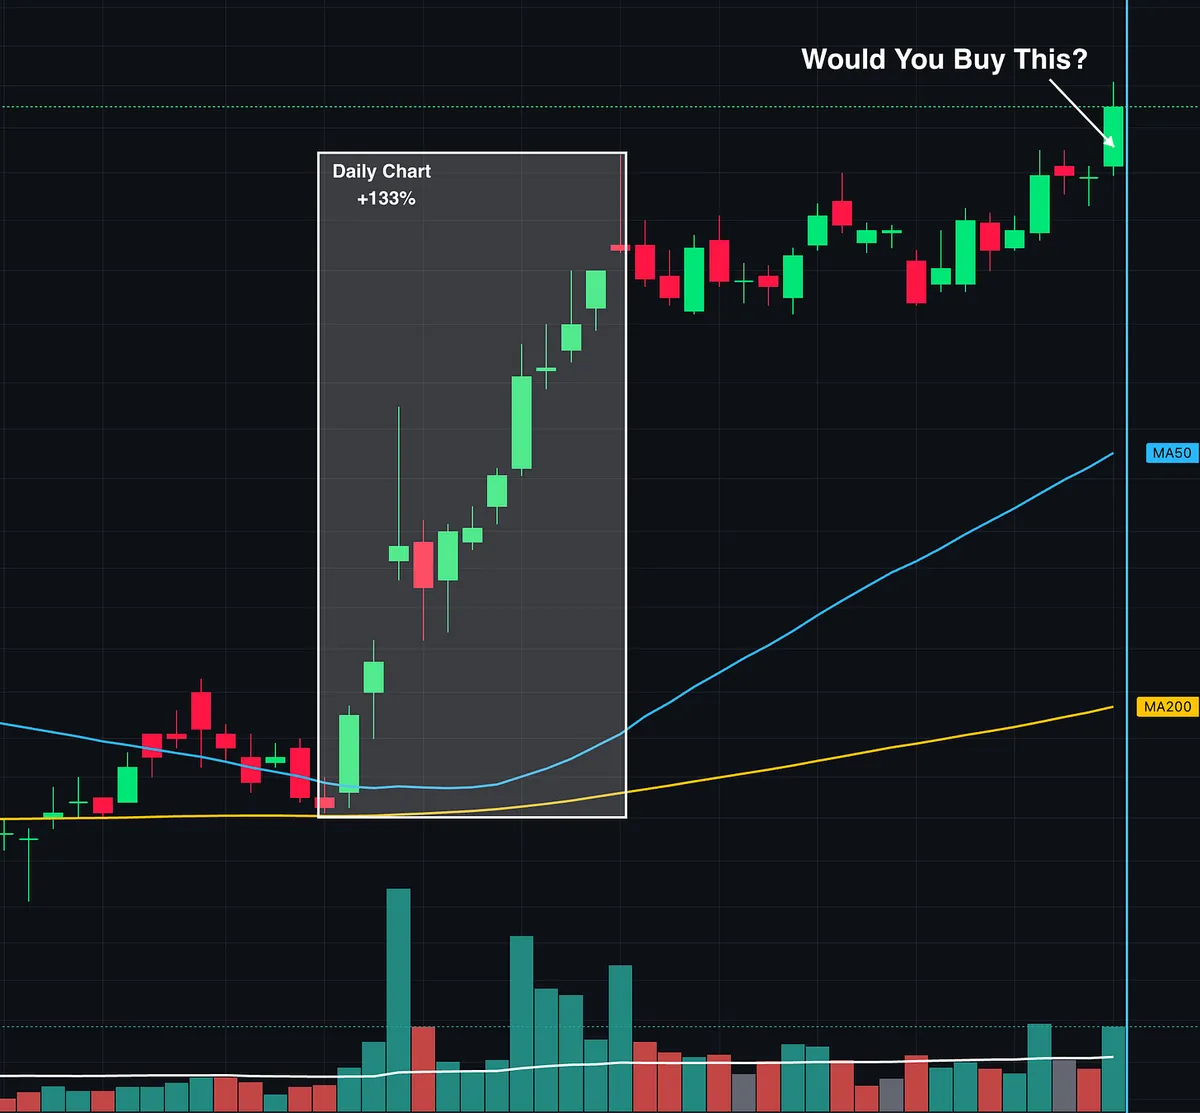
The Stock Was Up 133%. Nobody Chose Buy. Here's What Happened Next.

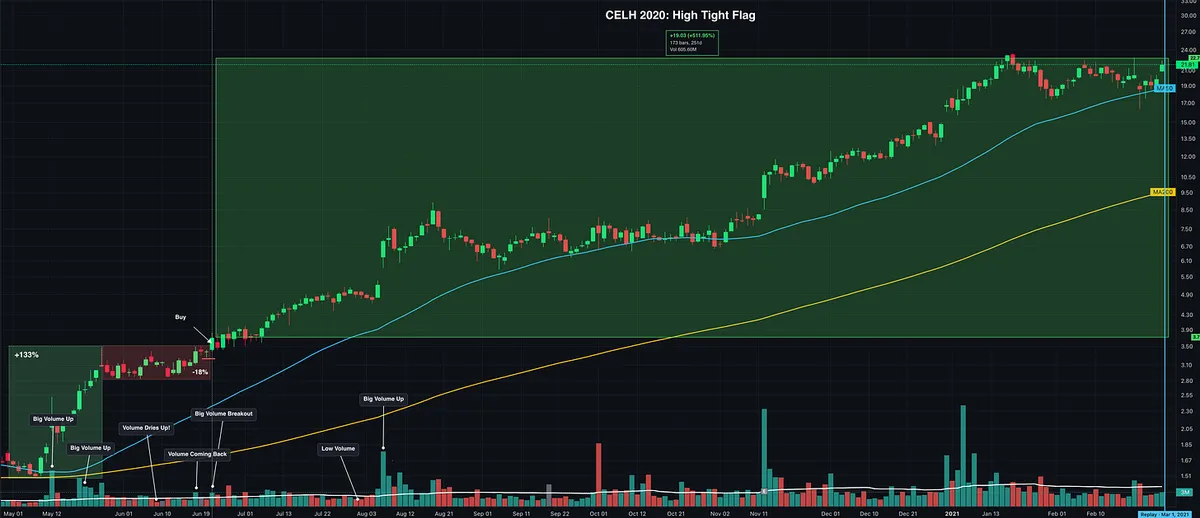
First, thank you to everyone who participated in the chart challenge! Not a single person selected Buy. Most chose to wait or avoid the trade, and I understand why.

The stock had already rallied 133% in approximately four weeks. Surely it was too extended to buy, right?

Not necessarily.

The stock was CELH, and what you were looking at was a High Tight Flag, a rare but powerful chart pattern documented by William O'Neil.

In How to Make Money in Stocks, O'Neil describes the characteristics:

  • Explosive advance: Generally 100% to 120% in just 4 to 8 weeks.

  • Consolidation: A sideways correction of roughly 10% to 25%, typically lasting 3 to 5 weeks.

  • Volume: Ideally, selling pressure diminishes during the consolidation, followed by renewed buying demand as price breaks out.

Notice what happened on the chart.

After that enormous advance, the stock stopped climbing and began consolidating. Price held relatively tight, volume quieted, and a new potential buy point developed.

The arrow marked the breakout above that consolidation.

The overall market was in a Stage 2 uptrend, and CELH belonged to a strong industry group. The broader conditions were supportive.

O'Neil documented examples of these formations dating back to 1915, including some of history's greatest stock market winners. He even bought Syntex from a High, Tight Flag in 1963 before its subsequent enormous advance.

But he also warned that these patterns are extremely risky and difficult to interpret correctly. A valid-looking setup can still fail.

The opportunity isn't simply buying a stock because it doubled. It's recognizing when that explosive advance produces a new, actionable setup with defined risk and potentially asymmetric reward.

If you didn't recognize it, no big deal. That's the whole point of studying historical winners and putting in the reps.

Go back through O'Neil's charts and study these formations. You'll start recognizing similarities in how exceptional stocks behave.

Now look at the second chart and see what happened next.

Here's the biggest takeaway:

Too many traders dismiss potentially exceptional setups simply because a stock has already made a massive advance. But a stock can double, consolidate, and offer an entirely new buying opportunity.

I've written a deeper article explaining this concept, but one of the best ways to train your eye is to study historical winners using Chart Bar Replay. Look at the charts BEFORE the breakout, make your own assessment, then advance the chart to see what happened next.

STOP thinking big moves = extended

START thinking extended = distance from the buy point

Quoting Momentum Trading StrategyThis Stock Just Rallied 133%. Would You Buy It HERE? No ticker. No dates. No hindsight. You're looking at this chart in real time. You have no idea what happens next. What's your move? A) Buy. I like what I see. B) Wait. I need more confirmation. C) Pass. It's too extended. A, B, or C? And WHY? I'll reveal the stock…
View on Substack ↗

You Can Memorize Every Chart Pattern and Still Miss This Setup

Look at DDOG today.

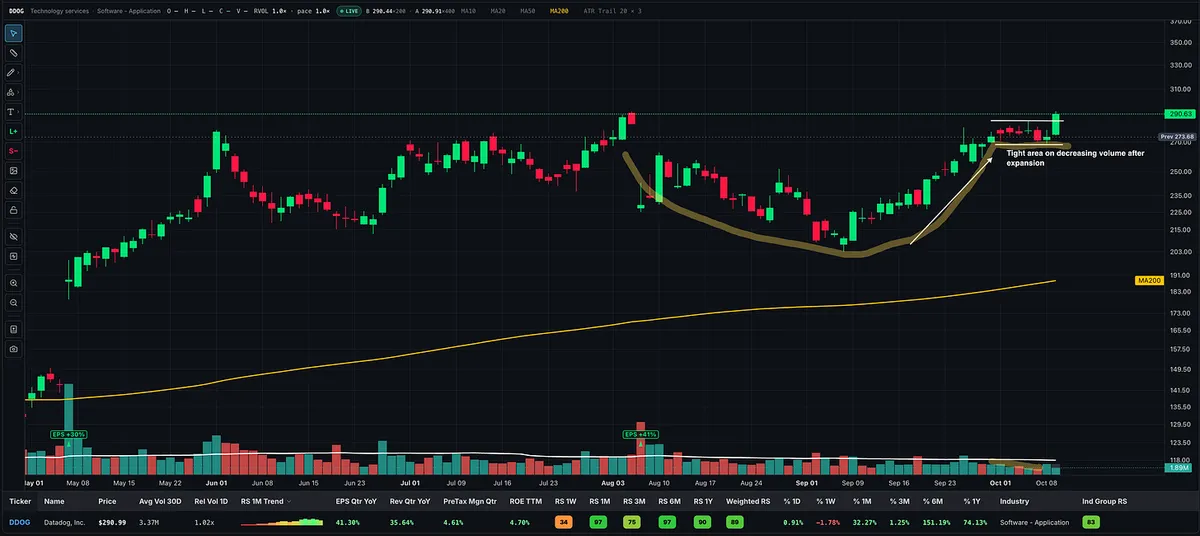
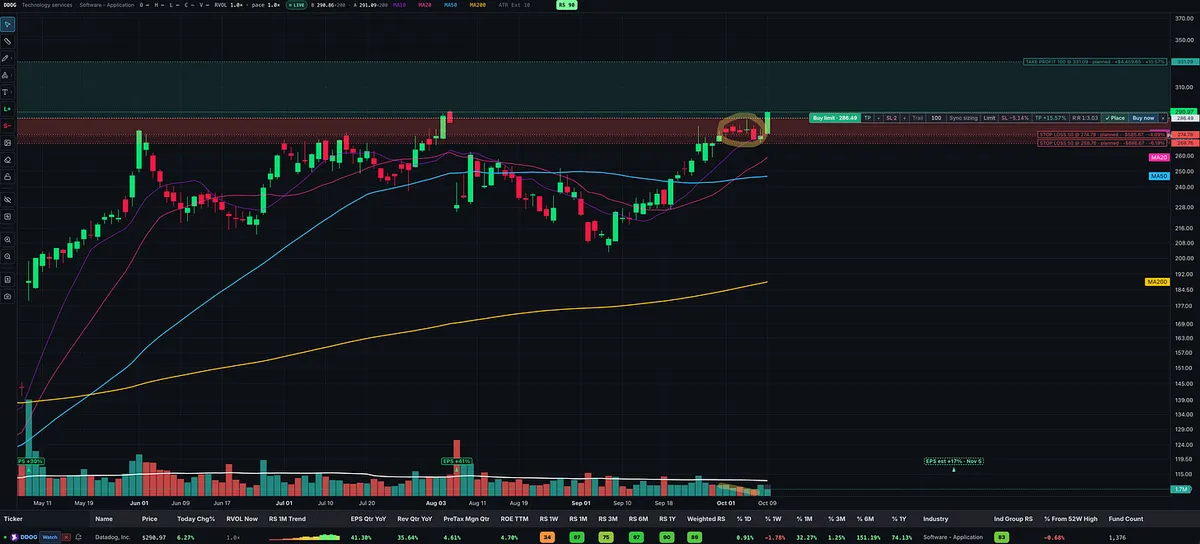
From October 1 through October 8, price formed a tight little handle, moving sideways and slightly lower while finding support near the rising 10-day moving average. Volume dried up during the consolidation.

Today, price is breaking through the high of that handle with a strong momentum move toward its prior highs.

This is the kind of setup I love because I have a clear line in the sand where I'm wrong.

I can use today's low for a tighter stop, the low of the handle for a little more breathing room, or split my position between the two.

Now here's the lesson.

We spend so much time studying cup-with-handles, VCPs, flags, pennants, and other chart patterns, but what do they all have in common?

1. Strong upside price movement, ideally on expanding volume.

2. Tight consolidation or a controlled pullback, with volume drying up.

3. Renewed price strength through resistance, ideally with volume expanding again.

4. A logical place to define risk if the setup fails.

You don't always need a picture-perfect textbook pattern. You need to understand what price and volume are telling you.

And you don't need to know how high a stock will go. You need to know where you're wrong and whether the potential reward justifies the risk.

That's how I look for opportunities where a relatively small, controlled loss could be offset by a winner worth several multiples of my initial risk.

View on Substack ↗

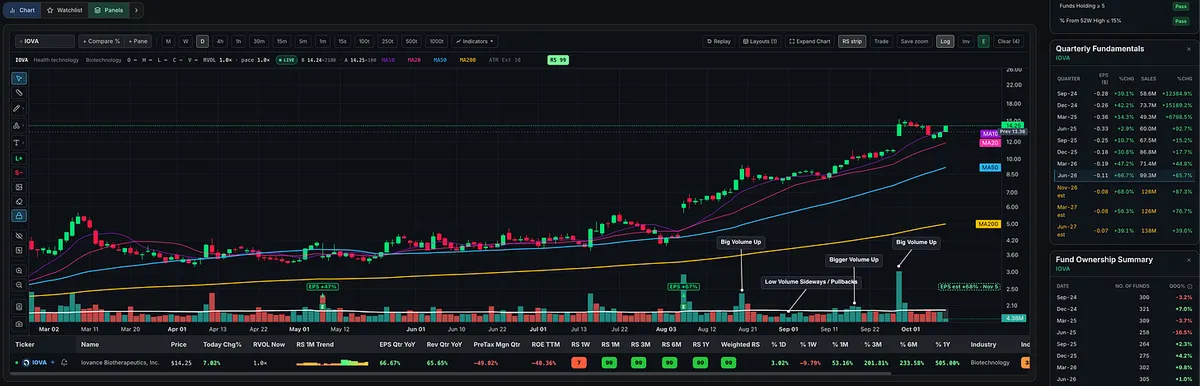
IOVA: A Great Example of Price, Volume, and Trend Alignment

This is exactly the type of price and volume action I look for in leading stocks.

  • Volume expands on advances, suggesting strong institutional buying demand.

  • Volume dries up during sideways consolidations and pullbacks, indicating relatively light selling pressure.

  • Price remains tight during pauses before momentum returns.

  • Moving averages are properly stacked: 10-day > 20-day > 50-day > 200-day, all trending higher.

  • Relative Strength: 99, demonstrating exceptional price leadership.

Now, let's look at the fundamentals, because this is a biotech.

$IOVA reported quarterly sales growth of 65.7% YoY, while EPS improved 66.7% YoY. However, earnings remain negative at -$0.11 per share, and forward estimates are still negative.

That EPS improvement means the company is losing less money, not that it's generating positive earnings. I place much more weight on the actual sales growth and the trend toward profitability than on that EPS percentage.

This is where William O'Neil and Mark Minervini differ somewhat.

O'Neil's CAN SLIM methodology strongly emphasizes positive, accelerating earnings and sales growth. A company reporting smaller losses generally wouldn't meet his preferred earnings criteria.

Minervini, while also favoring strong earnings and sales, makes exceptions for certain situations, particularly biotechs. He explains that many biotechs lack positive earnings, so he will evaluate them based on technical strength, price and volume, and potential drug-development catalysts.

I take a similar approach. With biotechs, I'm willing to overlook negative ROE and pre-tax margins when other characteristics are compelling. That doesn't mean fundamentals don't matter. Strong sales growth, improving losses, and a potential path to profitability are still important.

IOVA is an excellent chart to study for price and volume characteristics, relative strength, and moving average alignment.

Not every leading stock will check every fundamental box, particularly in biotech. Learn to recognize the characteristics that matter, understand the industry you're trading.

View on Substack ↗

This Stock Just Rallied 133%. Would You Buy It HERE?

No ticker. No dates. No hindsight.

You're looking at this chart in real time. You have no idea what happens next.

What's your move?

A) Buy. I like what I see.

B) Wait. I need more confirmation.

C) Pass. It's too extended.

A, B, or C? And WHY?

I'll reveal the stock, what happened next, and my analysis in a follow-up note.

View on Substack ↗

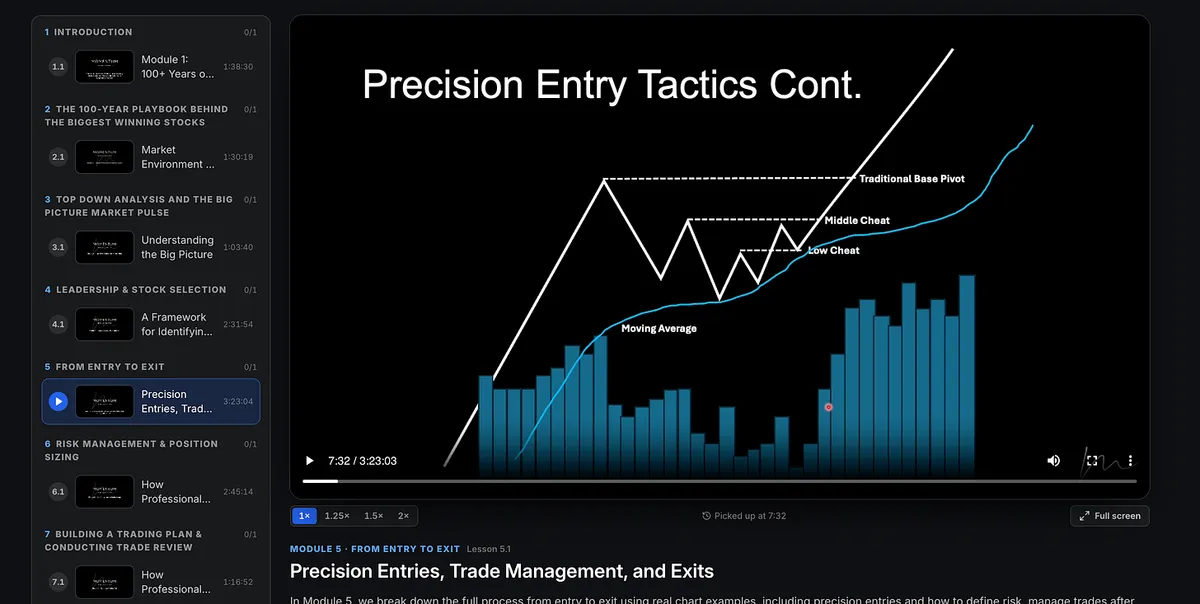
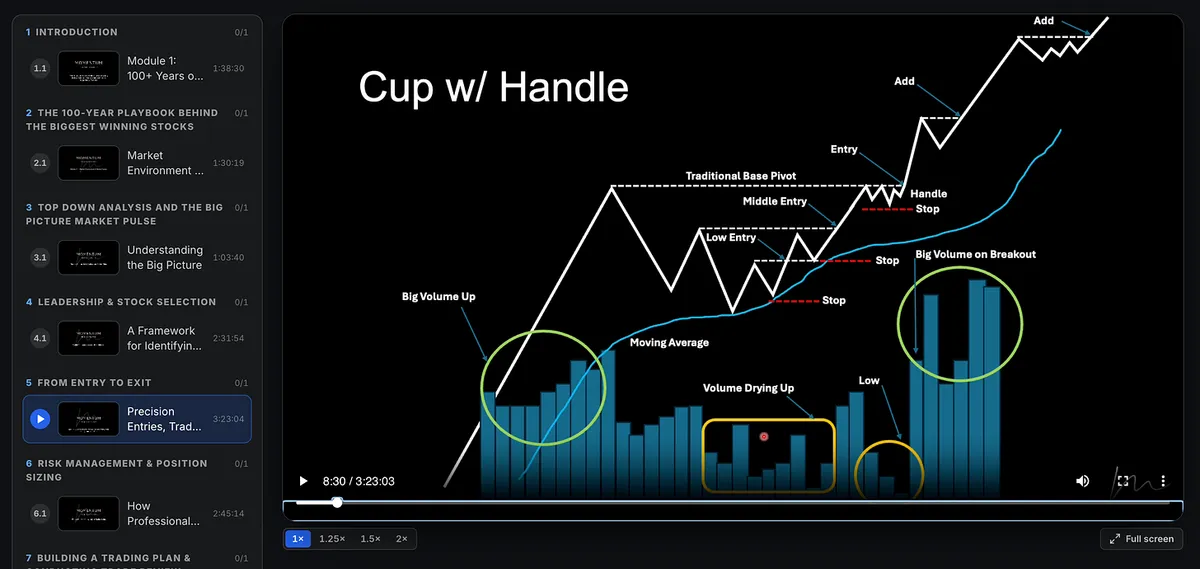
Same Base. Three Places to Buy. They Are Not Equal.

Buying lower feels safer, but inside a stock’s base, the lower entry can be the trickier trade.

Why? More overhead supply. More people who bought higher and may sell as the stock recovers toward their purchase price.

Minervini describes three potential entry areas as a base develops:

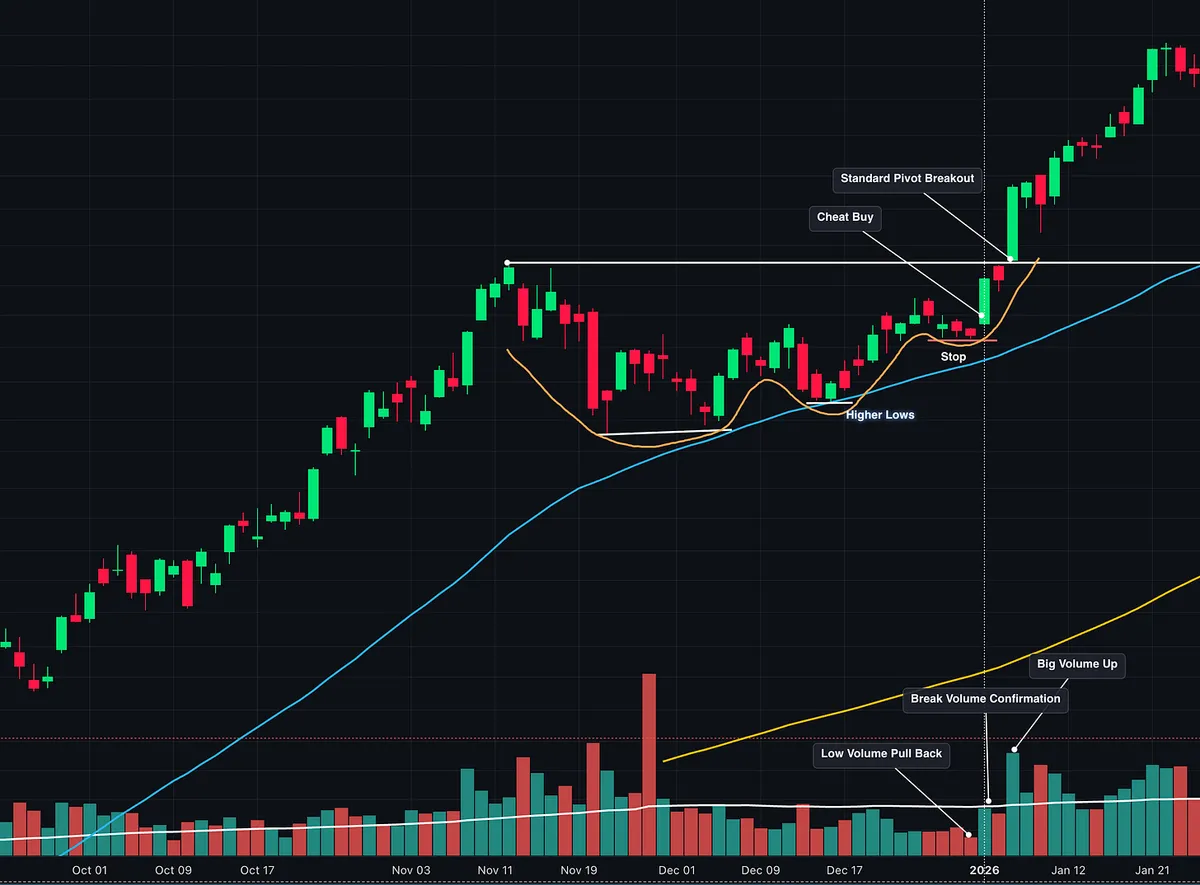
1. The low cheat. An early entry as the stock turns up off its lows and forms a small pivot. You’re buying before much of the recovery has happened, with more potential selling pressure above you. It takes more skill than simply spotting a stock that looks cheap.

2. The cheat. A setup higher on the right side of the base. The stock has made more progress and worked through some of that supply, but it still has ground to recover before reaching the old highs.

3. The traditional base pivot. The breakout near the top of the base or a cup with handle can provide an entry in this area. Once the stock clears its all-time high, there are no prior buyers sitting above it waiting to get back to even. That doesn’t eliminate selling, but it removes that particular source of resistance.

The lower price comes with a trade-off. You get in earlier, but the stock has more to prove.

Minervini says he spent roughly a decade trading cups with handles and flat bases before adding cheats, then years trading cheats before adding low cheats.

The advanced entry wasn’t his starting point.

At any entry, know what would invalidate the trade and how much you’re willing to lose. Give normal fluctuations room within your plan, and act when your rules call for it.

Buying lower means dealing with more overhead supply, make sure you have the skill to trade it.

View on Substack ↗

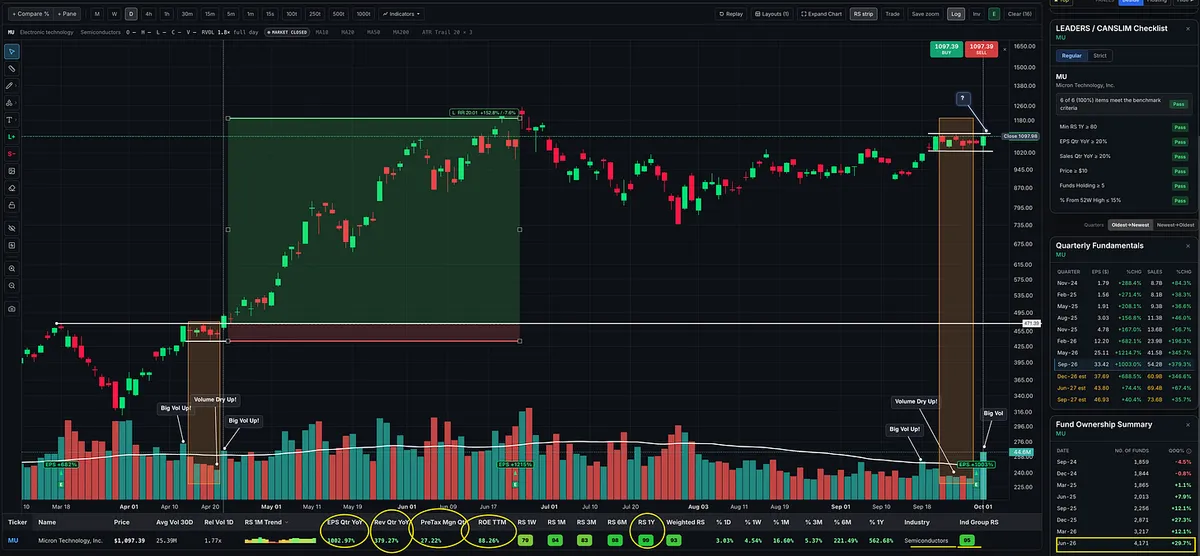
Ummm… hello, MU. 👀

Another massive earnings report, and the chart is getting interesting.

Look at the highlighted setup in April. Now look at the right side of the chart.

Price tightened, volume dried up, and then buyers showed up before that huge advance.

Now MU is tightening again in the upper half of its base, with volume starting to return. This is exactly the kind of price and volume behavior I like.

I’m watching for a decisive move through the top of this tight range, backed by volume and follow-through.

MU, are we getting ready for another launch? 🚀

View on Substack ↗

Anyone can spot a winner after it doubles.

The skill is recognizing the setup before the move.

When you only study charts after stocks explode, you’re training your eye to recognize the result, not the conditions that preceded it.

Try this instead:

  • Pull up a former market leader and hide the breakout and the run that followed.

  • Use chart replay to move forward one bar at a time, studying the developing base.

  • Before revealing the move, ask: Would this stock interest me without knowing what happens next?

Look for tightening price ranges, higher lows, shallower pullbacks, and volume drying up.

Not the giant green candle. The behavior that came before it.

A scanner can narrow your list, but it cannot do these repetitions for you. That takes deliberate chart study, repeated across many examples.

View on Substack ↗

The breakout is loud. The clues are often quiet.

Everyone notices a stock exploding higher on huge volume. I’m interested in what it was doing before that move.

David Ryan explained it in Market Wizards:

“When a stock that has been moving up starts consolidating, you want to see volume dry up.”

He reinforced the idea in Momentum Masters:

“I would also like to see a very tight base with a small price range and dry-up in volume.”

That’s the sequence I’m watching:

  • Strength first. A strong advance supported by heavy volume.

  • Then quiet. Price holds its gains, the trading range tightens, and volume dries up.

  • Then renewed demand. Volume returns as price pushes higher, sometimes before the obvious new high.

Low volume alone doesn’t interest me. A strong stock holding its gains while price tightens and volume fades does.

That combination can suggest selling pressure is drying up. Then I’m watching for buyers to return and price to confirm an entry.

Don’t just chase noise. Watch for strength that goes quiet, tightens up, and then shows fresh demand.

That is often where the next opportunity begins.

View on Substack ↗

Buying Earlier Won’t Fix a Bad Market.

Most of the time in a sideways, choppy market, I’m in cash.

Growth-stock momentum trading needs sustained follow-through. When the market keeps chopping up our setups, preserving capital is part of the strategy.

When I do trade, it’s usually because strong stocks are emerging within strong industry groups, while the market is pushing toward its highs and showing signs of transitioning out of the range. That’s why I was buying AEHR and other names in early August.

During those transitions, I’ve often found pullbacks and cheat entries easier to work with than traditional breakouts. That’s my experience, not an automatic rule.

I adapt to what the market is rewarding, including what my own trades are telling me.

The stock-selection standards stay the same: strong relative strength, earnings and sales growth, industry leadership, and constructive price and volume action. I want volume supporting advances, quieter pullbacks, higher lows, and tightening price action up the right side of the chart.

A cheat entry means buying the turn higher through an earlier buy point within the base, before the standard breakout. A pullback entry means waiting for controlled selling to give way to a defined turn higher.

Neither means buying simply because the price is lower.

My stop is defined before entry, usually below the tight setup, relevant pullback low, or low of entry day provided that distance fits my risk limits.

There are trade-offs. Low cheats face more overhead supply. During transitions, I’m quicker to reduce risk as trades progress, even if that means cutting some off prematurely.

I make selective attempts and build exposure as they work. If the market keeps rejecting those attempts, I return to cash.

Cheat entry below: Buying the turn higher before the standard pivot breakout, with risk defined below the recent pullback low.

View on Substack ↗

KOD Exploded 148% Here’s Where the Entry Was

I get a lot of questions about intraday entry tactics and the opening range breakout (ORB), so here’s a quick example from my playbook. How do you find a stock like this early, and where do you actually buy?

In this short video, I walk through $KOD’s one-minute opening range breakout, the entry concept Kristjan Kullamägi describes as buying the opening range highs. Dan Zanger also teaches opening range breakouts and has influenced both Kullamägi’s trading and my own.

Using MTS Velocity, I explain how to spot the premarket mover, check the catalyst, and identify an entry above the first minute’s high with an initial stop at the day’s low. Then I cover the higher lows, taking partial profits into strength, and ways to manage the remainder.

Less than three minutes: finding the stock, defining the entry, and planning the risk.

Want to go deeper? I cover this tactic in more detail in Module 5 of the Momentum Trading Strategy Course.

Watch the video on Substack →
View on Substack ↗

Train Your Eye to See This

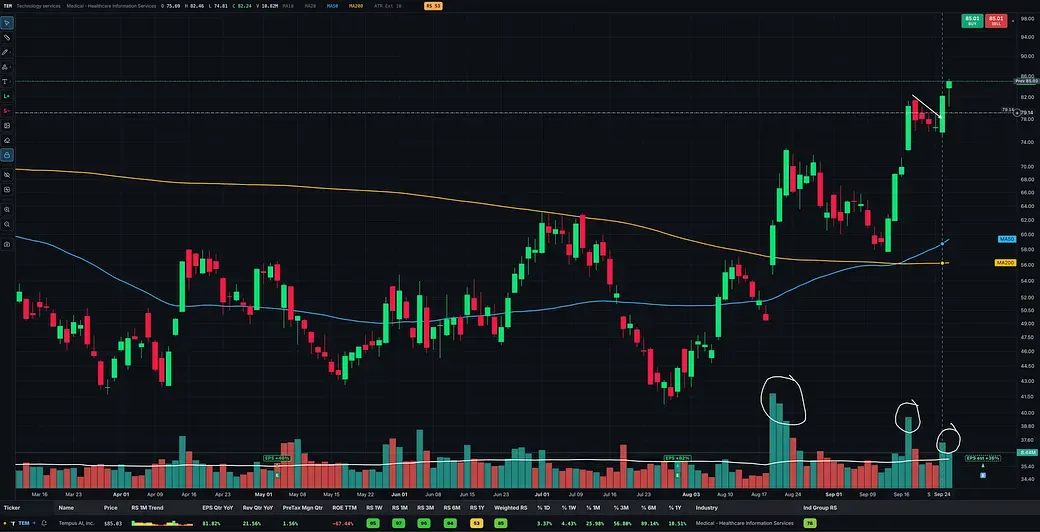
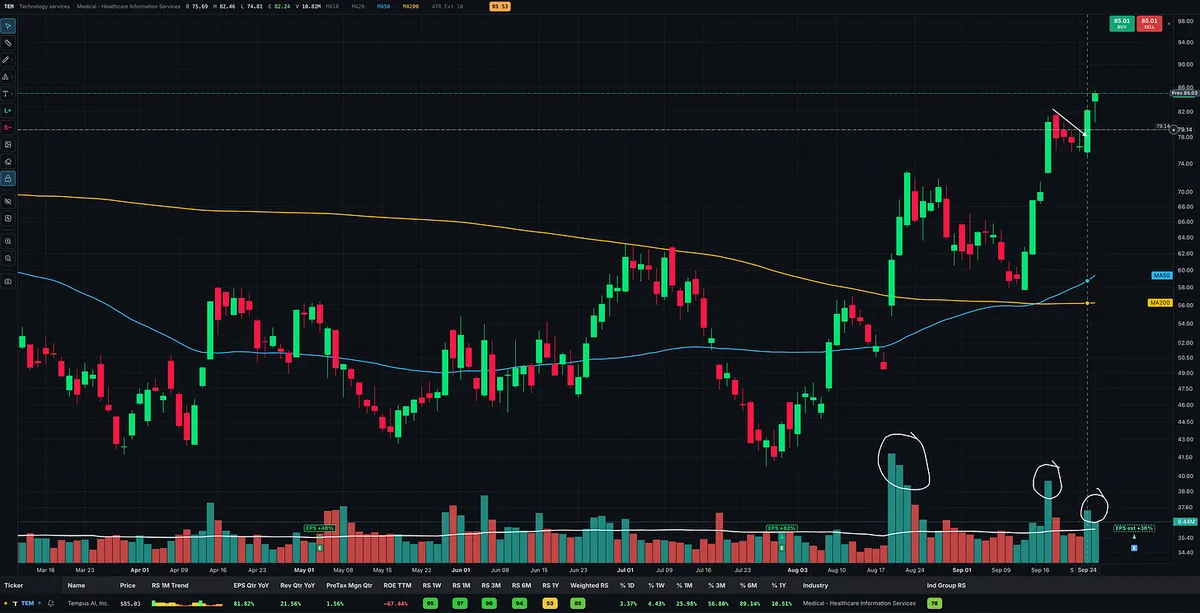
I post charts like TEM because this is the price and volume action you need to learn to recognize. Big, explosive advances on heavy volume, followed by controlled pullbacks or sideways pauses as volume dries up. Then another strong push that more than recovers the ground lost during the pullback.

Compare the character of the advances with the character of the declines. The strongest moves higher show expanding volume and meaningful price progress. The retreats attract less volume, and price holds enough of its gains to build a series of higher highs and higher lows.

That fading activity suggests selling pressure is easing as the stock pauses.

Strong demand on the way up, quieter action on the way back, and renewed demand that carries price higher again.

View on Substack ↗

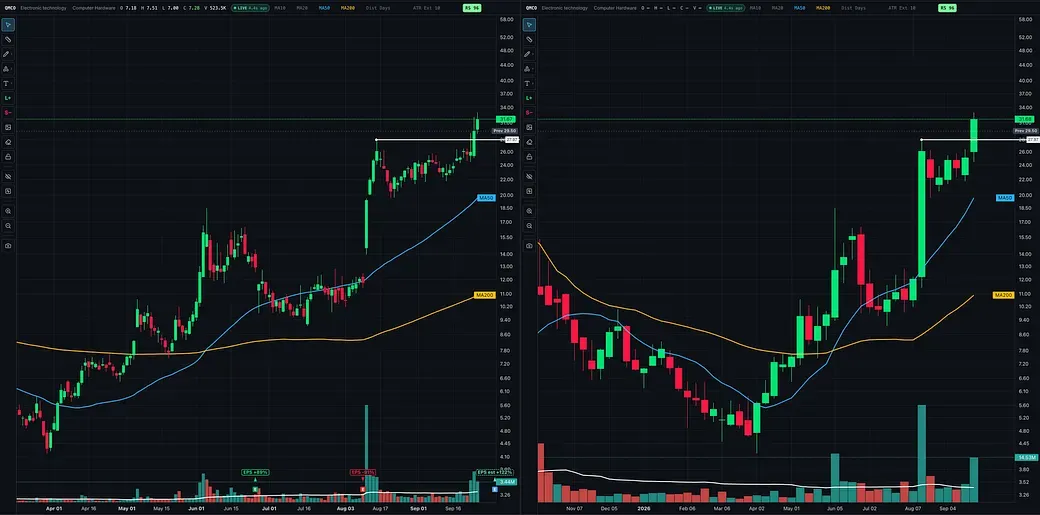
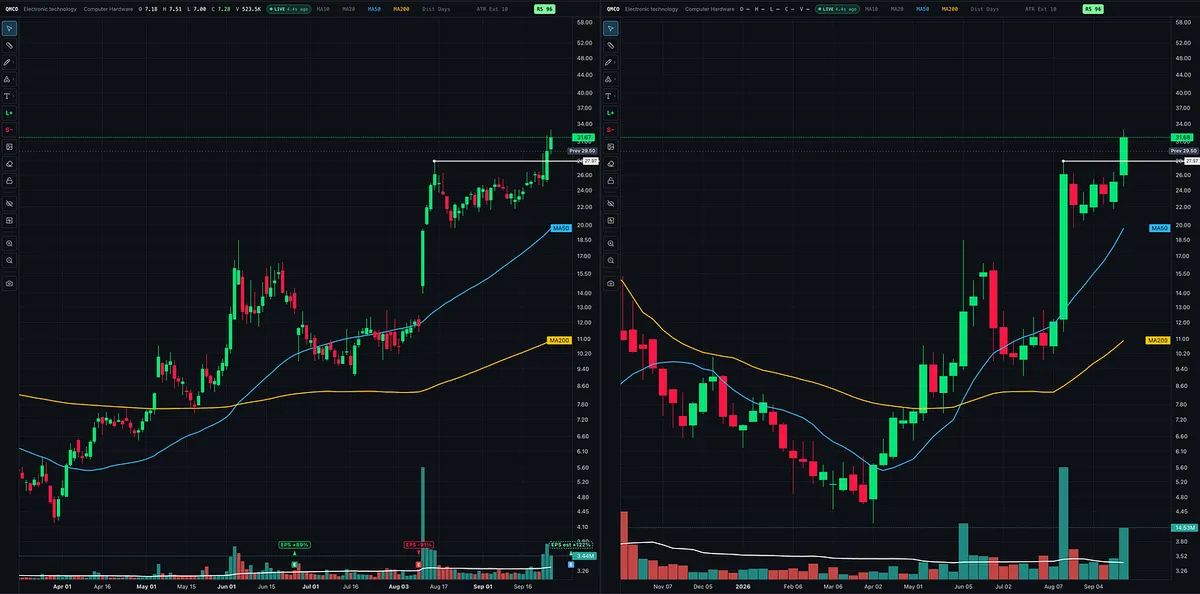
QMCO: 125% in One Week, Then a High, Tight Flag 👀

A 125% surge in one week, followed by five weeks of sideways consolidation. Now QMCO is breaking above the flag.

That is the structure behind the rare high tight flag: an explosive advance, followed by a relatively brief consolidation that holds much of the gain before the next move higher.

View on Substack ↗

Same Stock. Same Exit. 67% More Profit

“It’s only a little above my buy point.”

That small compromise can cost more than you think.

In the Master Trader Program, Minervini illustrates this with a stock breaking through a $20 pivot. Two traders buy the same number of shares and eventually sell at the same price.

Trader A Buys at $20.20, just 1% above the pivot.

Sells at $21.20.

Profit: $1.00 per share, before costs.

Trader B Hesitates and buys at $20.60, now 3% above the pivot.

Sells at $21.20.

Profit: $0.60 per share, before costs.

Trader A makes roughly 67% more profit.

Trader B’s extra 40 cents at entry consumed 40% of the profit Trader A captured. The difference came entirely from the purchase price.

Now think about repeating that habit across 200 trades. Then add hesitation on the exit: a little more given back while waiting for a bounce, another loss allowed to drift past the planned stop.

Small execution mistakes become big performance problems when you repeat them.

You can identify the right stocks and understand the right setups, yet still weaken your results by consistently paying too much and acting too late.

That’s why I want to know my entry, maximum acceptable purchase price, and exit plan before the trade. If the stock runs beyond my entry range, I can wait for another qualifying opportunity.

Missing a trade is frustrating. Repeatedly compromising the math is expensive.

Set your maximum entry price before you buy. Respect it. When your exit rule triggers, act.

View on Substack ↗

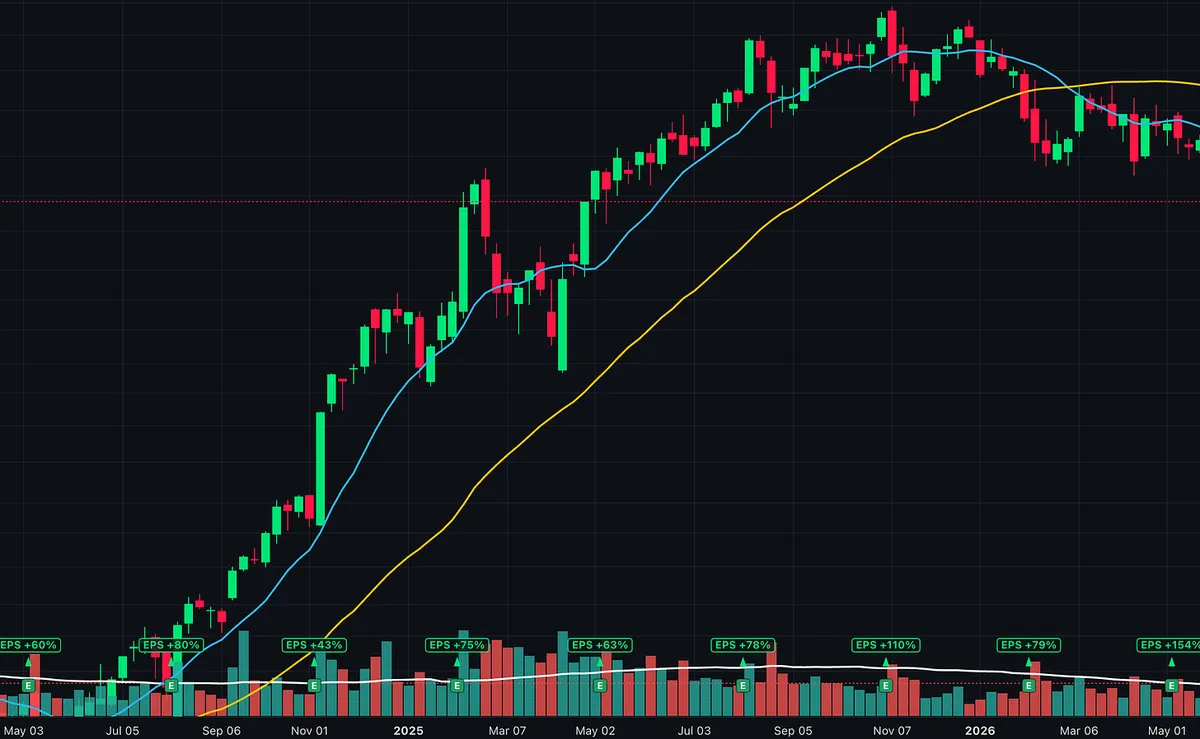
Great Earnings Don’t Cancel a Stage 3 Top

The company reports great earnings. The headlines are glowing, but the stock has already started acting differently.

Pullbacks are deeper. Price swings are wider. Heavy selling keeps interrupting rallies. Breakouts struggle to hold.

The business can still look strong while the stock is topping.

That’s what makes Stage 3 so deceptive. After a long advance, the story is widely known and the recent results can look outstanding. Fresh buyers see the earnings report and assume the stock has another big move ahead.

That demand can give institutions an opportunity to sell into strength.

A rally on good news might even look like a fresh breakout, but if it reverses on heavy volume and fails to hold the breakout, the headline doesn’t erase that warning.

Watch what the stock does with good news.

Does it advance, hold its gains, and attract support on pullbacks? Or does every attempt higher meet selling?

I care about earnings and sales growth, but I also want the stock’s behavior to confirm those fundamentals. Strong numbers don’t give a deteriorating chart a free pass.

For new buys, a Stage 2 uptrend is my starting requirement. Then I need a qualifying setup, and defined risk.

If a stock repairs its structure and establishes a fresh Stage 2 advance, I can reconsider it. I don’t need to anticipate that recovery because the story sounds convincing.

Great earnings never override evidence of distribution.

View on Substack ↗

Give Me the Meat in the Middle

A lot of traders obsess over buying the exact bottom and selling the exact top. I’ve found plenty of success, and a lot more contentment, taking the meat in the middle.

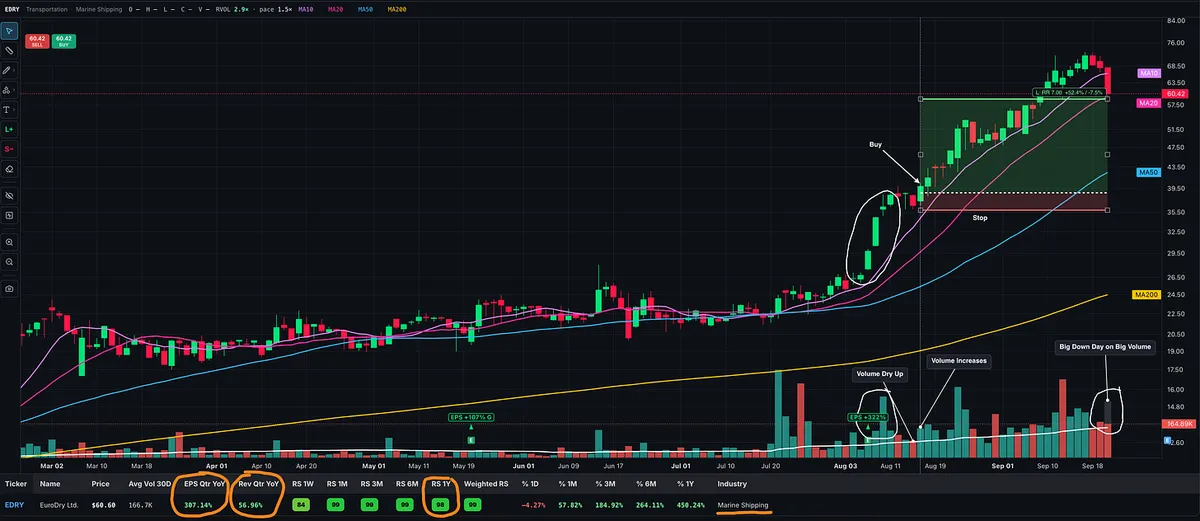
Look at EDRY.

For months, it chopped sideways, developing higher lows and finding support around the 50-day. Buying a pullback might have kept you involved, but your capital could have spent considerable time waiting for sustained progress. Minervini addresses this directly: money sitting in a stock that goes nowhere has an opportunity cost while other setups develop.

Then August brought an explosive earnings move on heavy volume.

Buying immediately before the announcement would have meant gambling on the market’s reaction. Instead, you could wait and study that reaction, how well the stock held its gains, and whether buying continued afterward. Missing the first burst doesn’t necessarily mean missing the opportunity.

EDRY then tightened up. After several sessions of strong momentum, price moved sideways and volume dried up. Both Minervini and O’Neil describe tight price action accompanied by contracting volume as constructive evidence that selling pressure is diminishing.

When volume returned and price pushed out of that short consolidation, there was an entry opportunity with a nearby low against which to define risk. Depending on the entry, the low of the day could also serve as the stop.

As O’Neil writes: “You want a stock to prove its strength to you before you invest in it.”

From there, EDRY largely followed its 10-day moving average higher. Now the sharp break beneath that line on heavy volume, toward the 20-day, marks a change in behavior. For a swing trader managing this move around those averages, that deserves attention.

Kullamägi’s published approach includes taking partial profits and trailing the remaining position with the 10-day or 20-day moving average. His moving-average exit rule looks for a close below the selected line, which matters when evaluating an intraday break.

There were opportunities to sell some into strength along the way, too. Many successful traders have made the broader point that consistently capturing the exact low and high is unrealistic. Successful trading leaves some of the move behind.

You could miss the bottom, wait until after earnings, and exit below the peak while still capturing a substantial move.

That’s why I maintain a watchlist, set alerts, and look for momentum followed by tightness, drying volume, and renewed demand.

Give me a sound entry and defined risk. The meat in the middle is enough.

And if I miss it? Stay patient and move on to the next setup.

View on Substack ↗

98% of the Big Winners Had This in Common

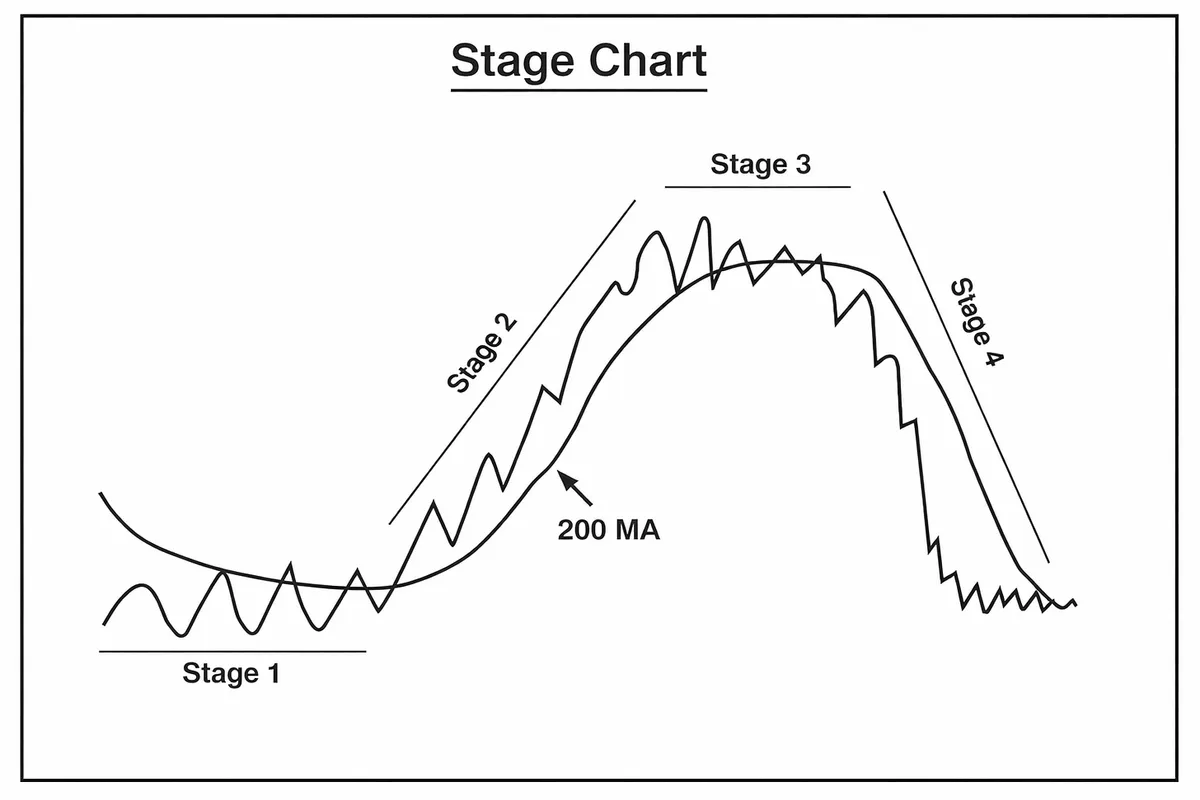
Mark Minervini explains that, in his historical studies, 98% of the big market leaders made their major advances during a Stage 2 uptrend.

That should tell you where to concentrate your search.

Yet traders spend countless hours looking for a bottom, buying stocks because they look cheap, or convincing themselves that a great company deserves their money while its stock keeps falling.

For my approach, the first question is simple:

Is this stock in a confirmed Stage 2 uptrend?

Before I get attached to the name or start finding reasons to like the company, I want the trend to qualify.

Stage 2 is the advancing phase. I’m looking for an established uptrend, price above rising longer-term moving averages, and constructive price and volume action consistent with institutional accumulation.

A stock being down substantially from its high doesn’t satisfy that requirement. Neither does a few strong days inside a longer downtrend.

But Stage 2 alone doesn’t make a stock a buy.

I still need the earnings, sales, relative strength, setup, and entry to meet my criteria. And I need a stop and position size that keep the planned risk within my limits.

The trend qualifies the stock for further consideration. The complete setup determines whether I trade it.

Stage 2 first. Every other requirement still applies.

View on Substack ↗

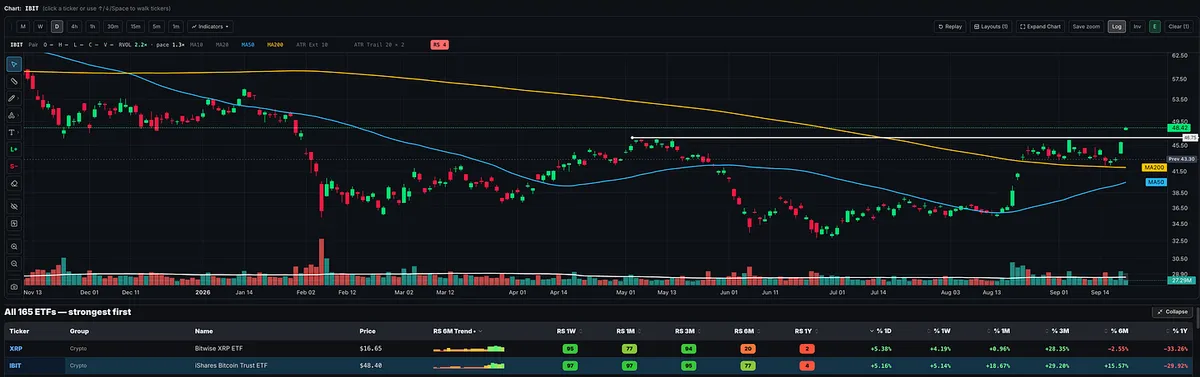
There goes IBIT, moving into new 52-week highs

William O’Neil’s research found that, during bull markets, stocks making new highs tended to keep moving higher. The strongest opportunities emerged when price broke out of a sound base with strong volume. What looked “too expensive” to many investors could be the beginning of a substantial advance.

Nicolas Darvas built his approach around a similar principle. He watched stocks consolidate within a defined box, then bought as price broke into a higher range. He deliberately sought strength near new highs, allowing the market to demonstrate demand before committing his money.

A new 52-week high puts the entire past year’s trading range beneath the current price. Buyers have absorbed the selling encountered along the way. Why is this important? Because investors trapped at higher prices can create resistance when they finally get an opportunity to sell near breakeven.

That’s what makes IBIT’s move worth paying attention to. The next evidence is whether the breakout holds, and follows through.

View on Substack ↗

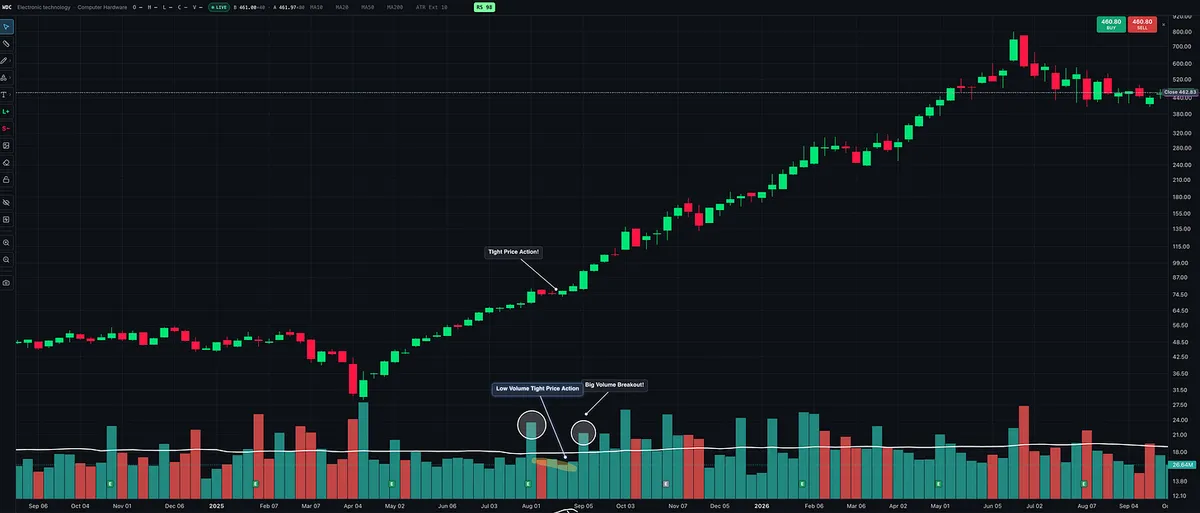
The quietest volume can come right before a powerful move.

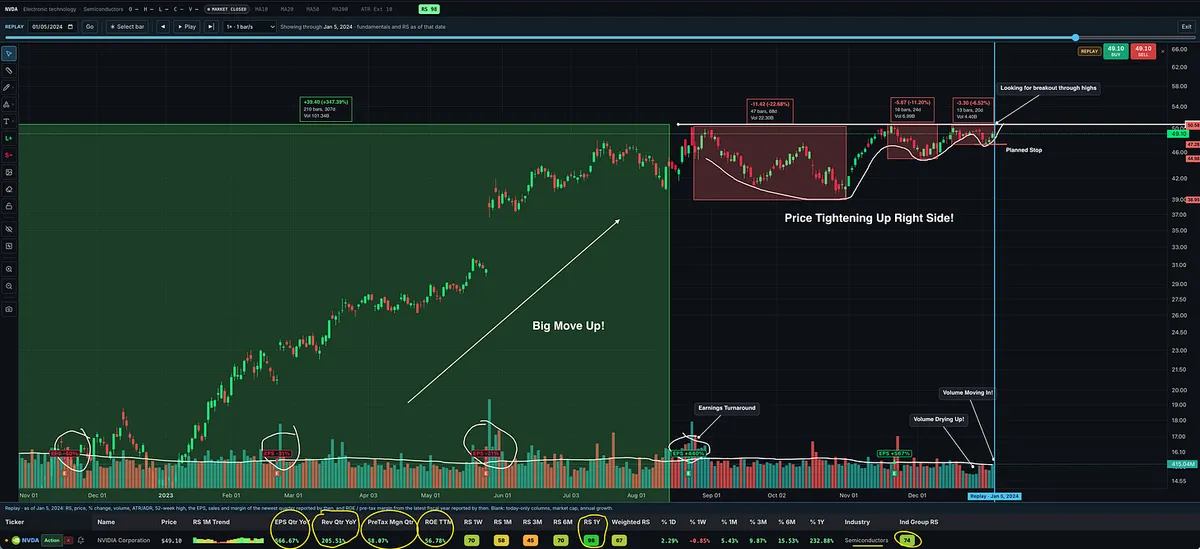
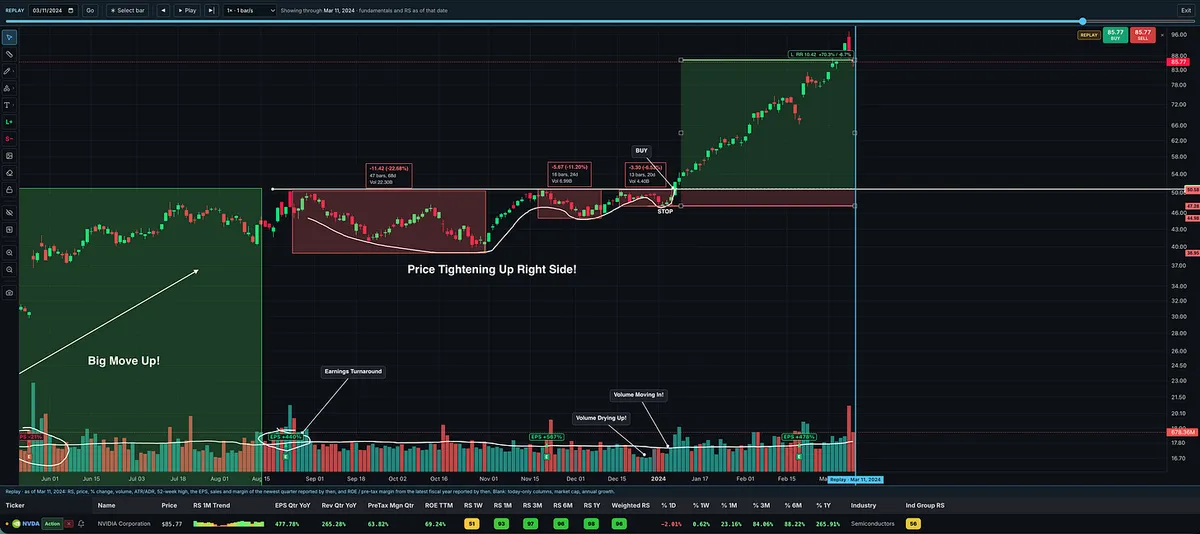
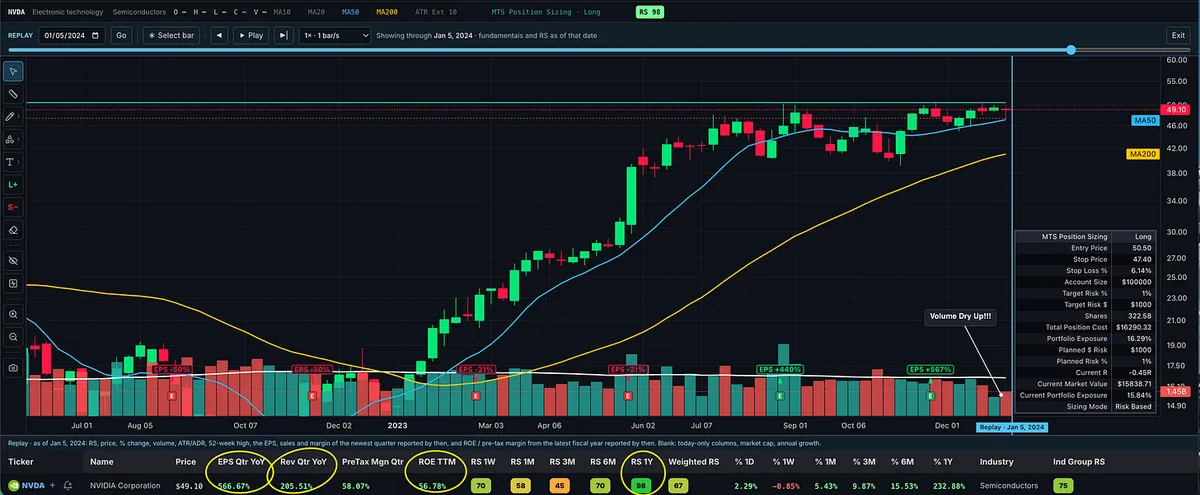
Look at $NVDA before and after its January 2024 breakout.

First, understand the context. As the market emerged from the 2022 bear market into 2023, AI became one of the new bull market’s defining themes. Semiconductors were a major leadership group, and NVIDIA was a standout leader.

Before these contractions developed, NVDA had already advanced more than 300% from its 2022 low.

That matters. A quality VCP starts with a stock that has already demonstrated powerful price performance and high relative strength, backed by the characteristics I look for in a potential market leader.

Then comes the tightening.

On the right side of this base, the pullbacks became progressively smaller: approximately 22% → 10.8% → 6–7%.

Before the move, price tightened near the $50.50 pivot. Volume dried up along the right side of the base.

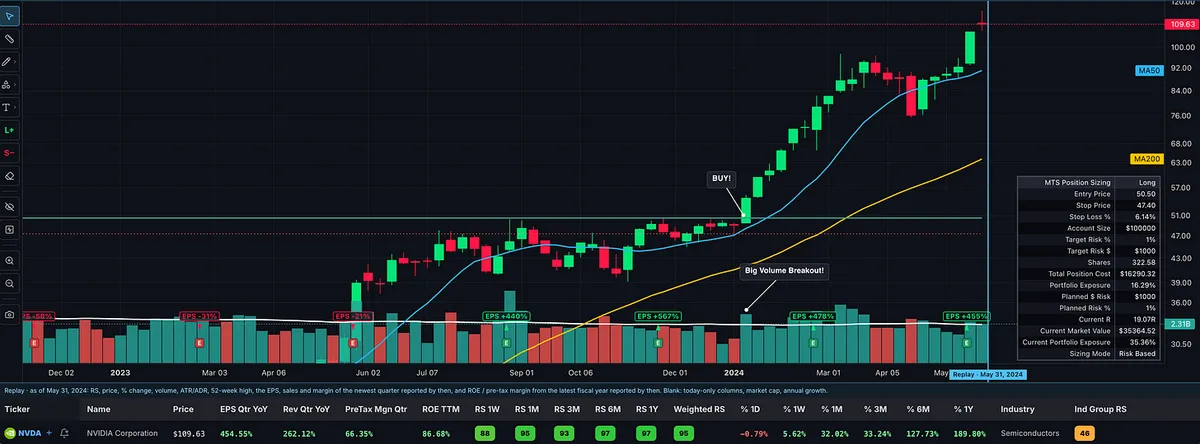
Then demand showed up. Price broke through the pivot as volume expanded.

By May 31, NVDA was trading at $109.63.

But look closely at what happened BEFORE the breakout.

The tighter price action. The quieter volume. The stock holding near resistance instead of giving much ground.

That’s the character I look for in a VCP setup: volatility contracting and selling pressure easing as the stock approaches its pivot.

A lot of traders focus on the contractions and overlook the move that preceded them. I want proven strength coming into the base, followed by progressively tighter action that creates an entry.

The appeal is a clear entry with a nearby level to define risk. You don’t need to know how far the stock will run to plan where you’ll get out if the trade fails.

These before-and-after charts in MTS Velocity’s Replay make that transition easy to study.

My rule for this setup: Look for price tightening and volume drying up into the pivot, then volume expanding on the breakout. If that character is missing, I don’t force the trade.

Also, look at the numbers BEFORE the breakout: quarterly earnings growth of 567% and sales growth of 206%, both year over year. A 58.8% pretax margin, 56.8% ROE, and a one-year RS rating of 98. All within an industry group ranked in the top third of the market.

View on Substack ↗

SMTC: New Highs. Big Volume. Accelerating Growth.

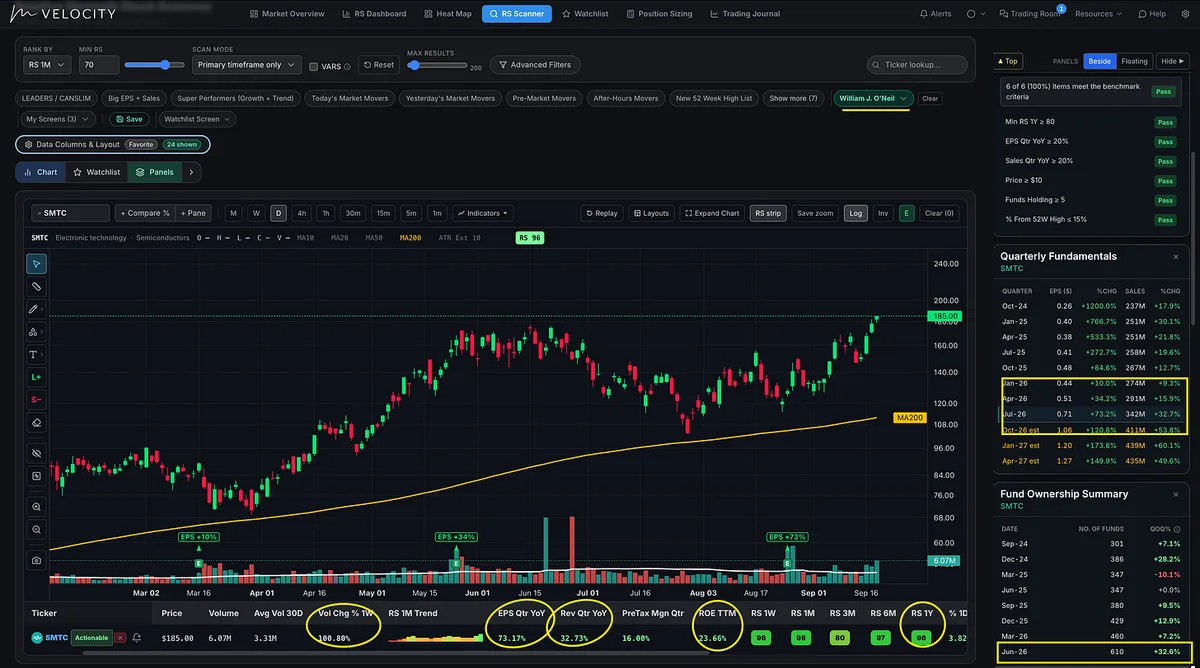
SMTC showed up in our RVOL Now scan in MTS Velocity on Wednesday morning, September 16. Three consecutive sessions of heavy volume followed through Friday’s close as the stock broke out to new 52-week highs.

The setup had been developing: a strong earnings release on August 25, followed by price tightening up the right side of the base before this week’s breakout.

And the numbers behind the chart?

  • Earnings growth accelerated: +10% → +34% → +73% over the last three reported quarters.

  • Sales growth accelerated: +9% → +16% → +33% over the same period.

  • Fund ownership expanded: 460 funds → 610, a 32.6% increase from the previous quarter.

  • Return on equity: 23.7%.

  • One-year Relative Strength rating: 96.

Earnings and sales figures above are year-over-year growth.

This is the combination I look for: accelerating earnings and sales, increasing institutional sponsorship, strong relative strength, and strong price and volume action backing the breakout to NEW Highs.