Momentum Trading Strategy

Notes

Chart Setups & Entries

When and where to buy a stock you have already found: chart patterns, buy points and entry tactics.

Showing 1–4 of 4 notes

$DELL ×
View on Substack ↗

DELL Shook Everyone Out. Now It’s Breaking Out.

I think DELL gets the award for shaking the most people out this week.

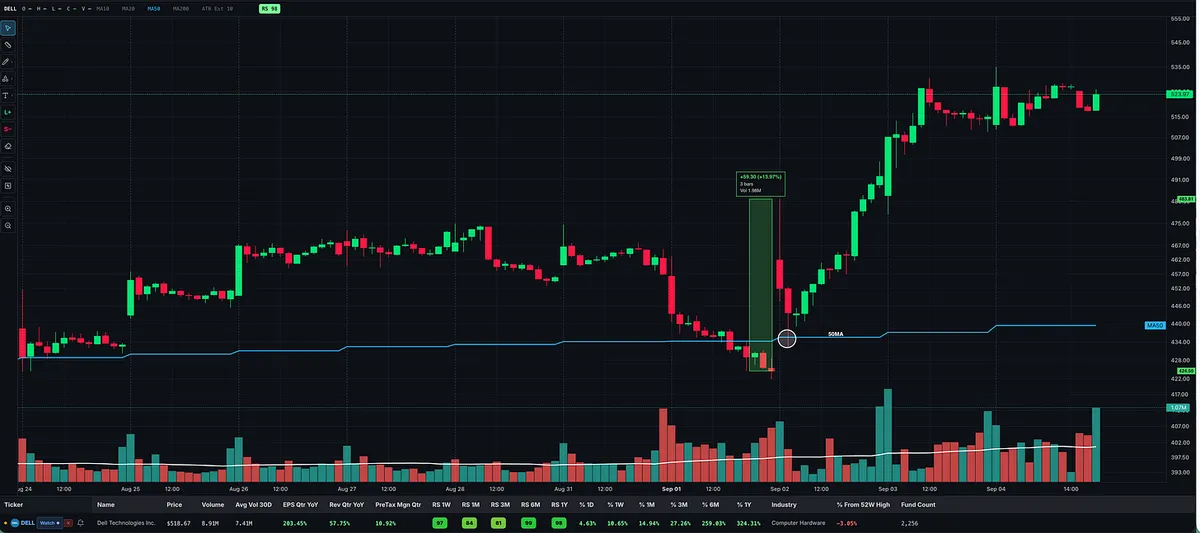
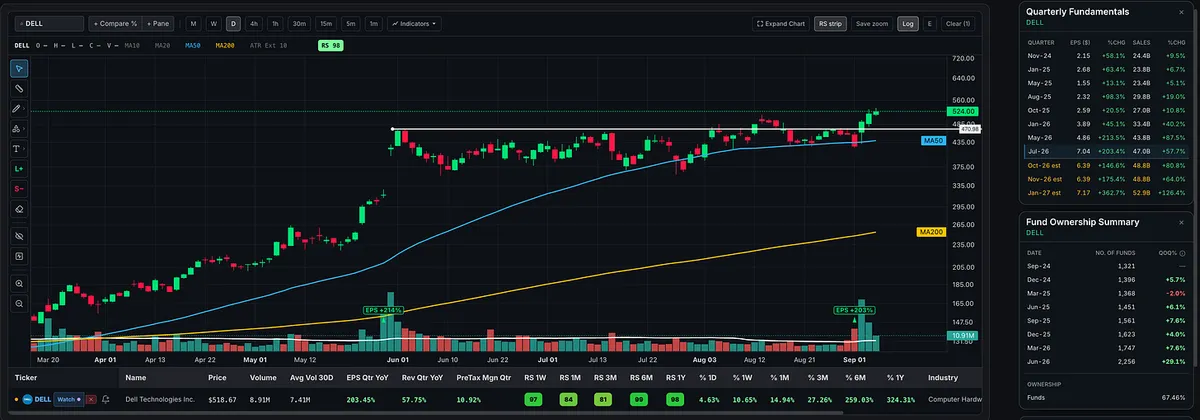
The 30-minute chart tells the story. DELL gapped up after earnings, completely reversed, gave up the entire gap, and briefly undercut its 50-day moving average. Anyone who chased the initial gap or placed an obvious stop near the 50-day probably got taken out.

Then DELL snapped back, reclaimed the 50-day, and rallied nearly $100 from Tuesday’s low.

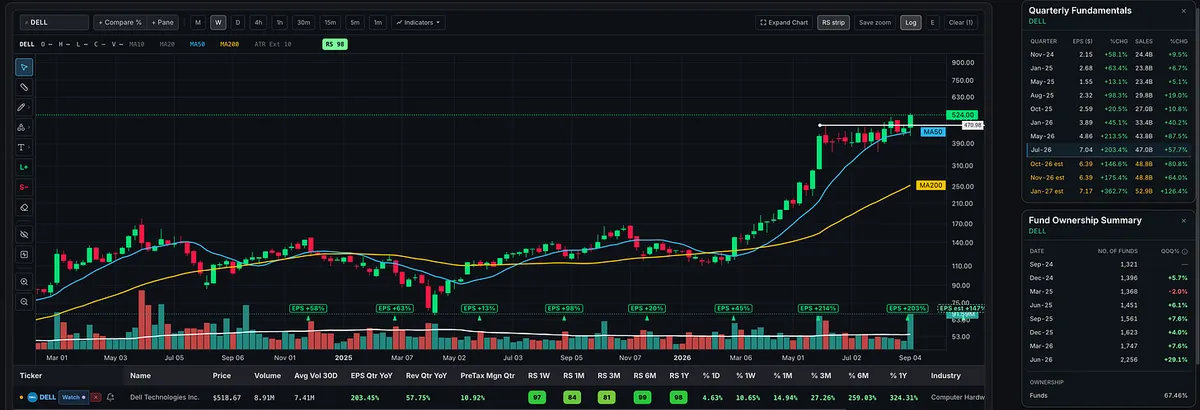
The daily chart shows how violent the shakeout was. On the weekly chart, it looks like nothing more than a brief pause within the larger uptrend.

The breakout is still developing, but this is a great example of a strong stock doing everything possible to shake people out before starting its next move.

Good job, DELL. 😂
View on Substack ↗

Why I Wouldn’t Buy DELL Right Before Earnings

Someone asked me why I wouldn’t buy DELL before earnings, especially when I’ve held other stocks through earnings.

The difference is context.

With LITE, I was already in the stock and had roughly a 25% cushion going into earnings. In situations like that, I may sell some before the report and hold the rest through earnings.

That is completely different from initiating a brand-new position right before earnings.

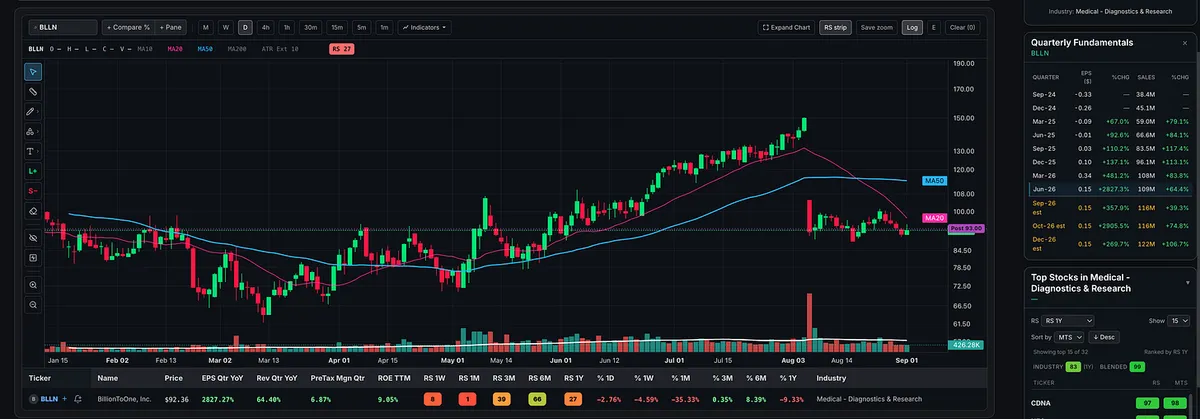
If you want to hold stocks long enough to capture really big moves, eventually you have to get comfortable sitting through some earnings reports. There is no way around that. Even with a large profit cushion, you can still get hit with an ugly reaction, like we saw with BLLN.

But I will NOT buy a stock immediately before earnings just to gamble on the report.

And with DELL specifically, the decision was even easier.

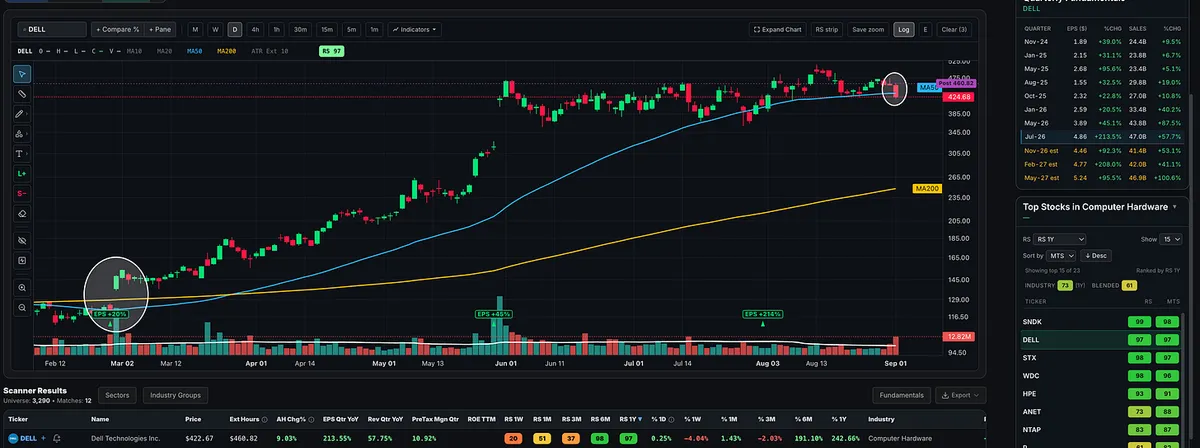
The stock looked like it wanted to go higher, but showed very little follow-through. Then it had a bad day today, falling more than 6% and closing below the 50-day moving average.

On top of that, the overall market hasn’t been acting well.

So now you have:

  • Poor follow-through after a failed breakout attempt

  • A greater than 6% down day

  • A close below the 50-day moving average

  • A less-than-ideal overall market

  • Earnings immediately ahead

Why would I initiate a brand-new position and take on earnings risk with all of that working against me?

For me, there is a big difference between holding earnings with a 20% to 30% profit cushion in an existing position and buying a stock immediately before earnings with no cushion at all.

Those are two completely different risk situations.

Now, with DELL up roughly 10% after hours, I’ll watch how the price continues to act and see whether it gives me a setup. It did something similar in early March after the big gap up in late February.

I don’t need to predict the earnings reaction or gamble on the report. I can wait for the report, see how the market reacts, and then look for a proper setup.

View on Substack ↗

The Episodic Pivot (EP) Setup Most Traders Miss

I get a lot of questions about episodic pivots.

  • What are they?

  • How do you find them?

  • And more importantly, how do you make sure you do not forget about them?

An episodic pivot is a powerful price and volume move caused by a meaningful catalyst, usually earnings, guidance, FDA news, contract news, or some other event that forces the market to reprice the stock.

But here is what most traders miss.

The best setup does not always happen on the day of the big move.

Sometimes the stock gaps up, runs hard, pulls back, volume dries up, tightens, and then gives a much cleaner entry days, weeks, or even months later.

That is why tracking these names matters.

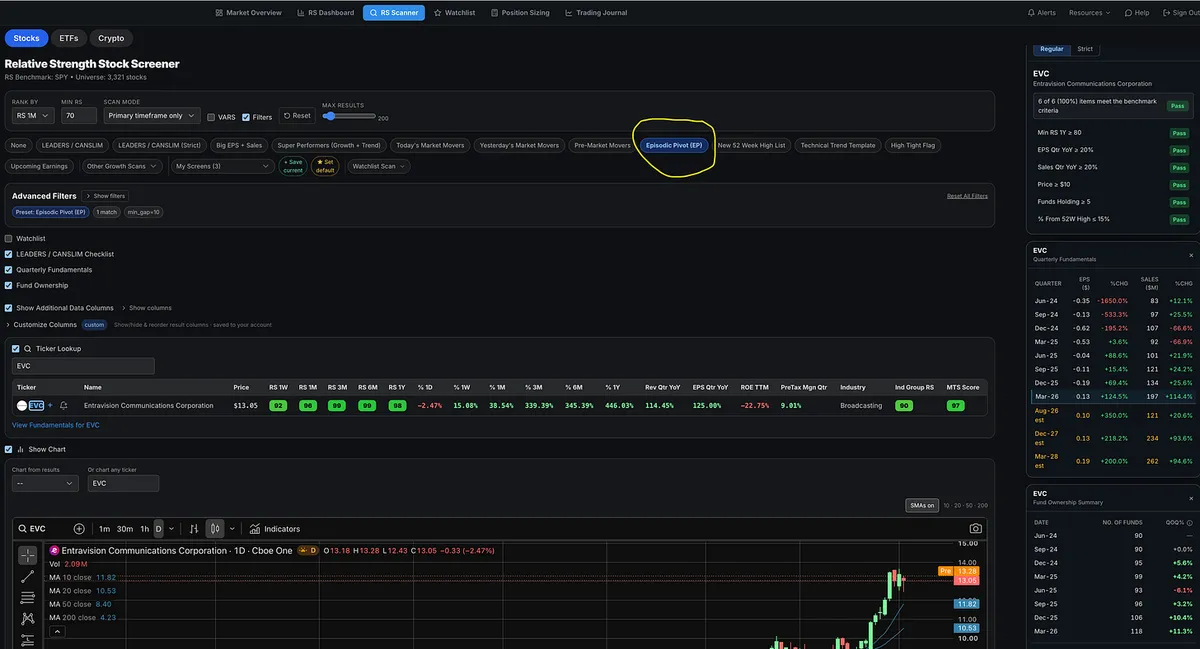
Inside the Momentum Trading Strategy software, we have an episodic pivot preset screen to help find these stocks.

But finding them is only step one.

The real edge is creating an Episodic Pivot watchlist inside the Relative Strength Stock Screener.

Under Manage Sub-Categories, create one called EPs.

Now you have your episodic pivots organized in one place.

Add the names when they show up.

Review them daily or weekly.

Do not force the trade.

Just wait.

Some will fail.

Some will go nowhere.

But some will tighten up and set up again.

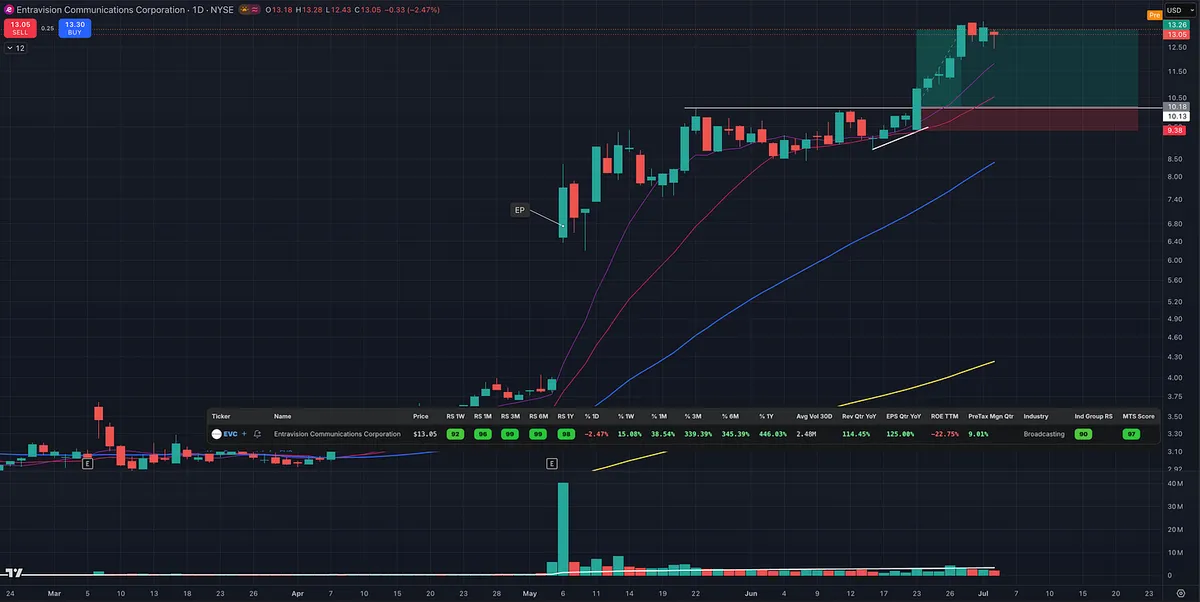
EVC is a good example.

The earnings catalyst launched the stock higher, but the cleaner opportunity came later after it consolidated, tightened up, and broke out again.

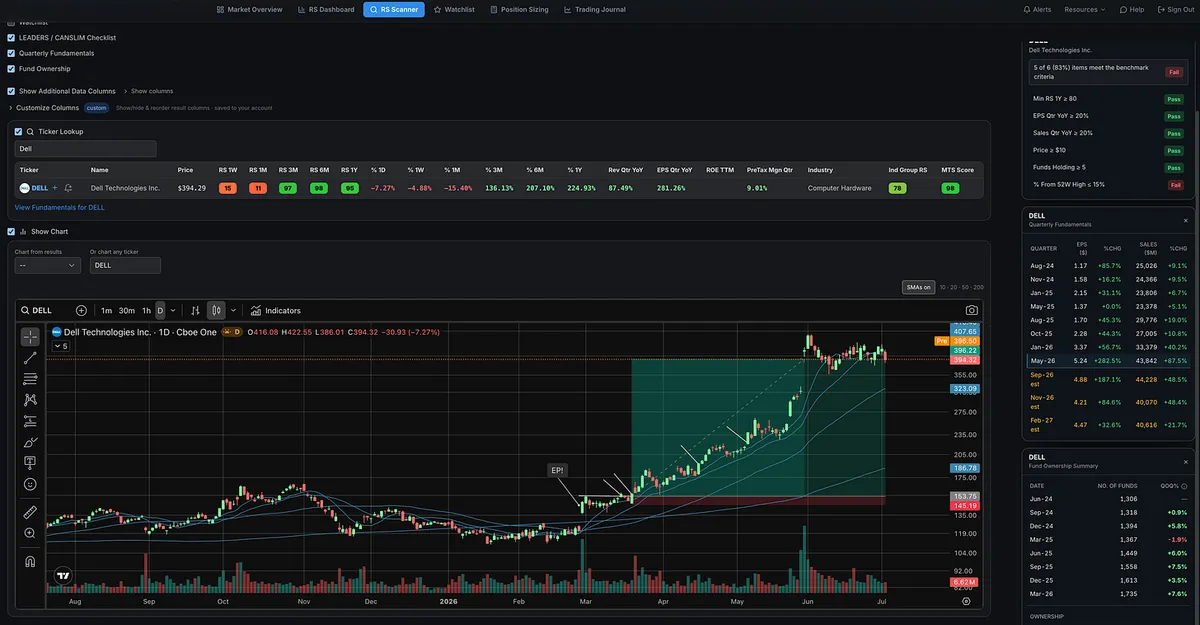
DELL was another great example.

The episodic pivot should gets your attention.

The watchlist keeps it on your radar.

The setup tells you when to act.

View on Substack ↗

Why I Track Big Gap-Ups Inside the RS Screener

Someone asked me why I track episodic pivots and big gap-ups inside the Relative Strength Stock Screener.

Here’s why.

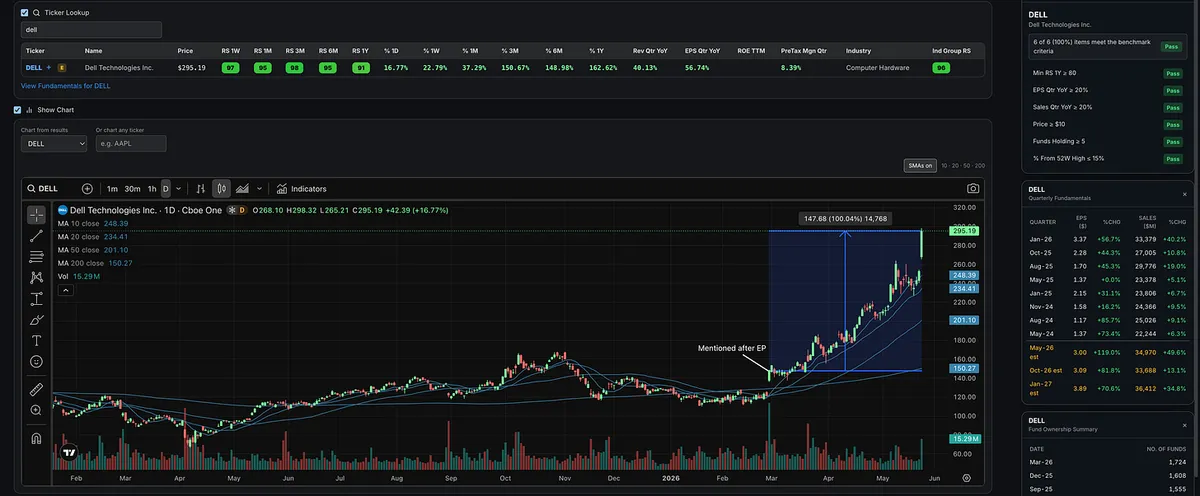
I wrote about Dell on March 1st after its episodic pivot, when the stock gapped up more than 10% on earnings with massive volume.

Since then, Dell has continued to trend higher, up roughly 100%, while making higher highs and higher lows.

Strong industry group. High relative strength across multiple time frames. Strong earnings. Strong sales. Massive volume after earnings.

That is exactly the kind of behavior I want to track.

Not because every gap-up works.

Not because you blindly chase every stock that moves.

But because big institutional-quality moves often leave footprints before the bigger trend fully develops.

The Relative Strength stock screener inside the Momentum Trading Strategy app is simple, but extremely powerful.

It helps me find the names that are showing up in the right places, at the right time, with the right characteristics.

This is exactly what I’m using to find the stocks I share.