Momentum Trading Strategy

Notes

Chart Setups & Entries

When and where to buy a stock you have already found: chart patterns, buy points and entry tactics.

Showing 1–7 of 7 notes

$NVDA ×
View on Substack ↗

The quietest volume can come right before a powerful move.

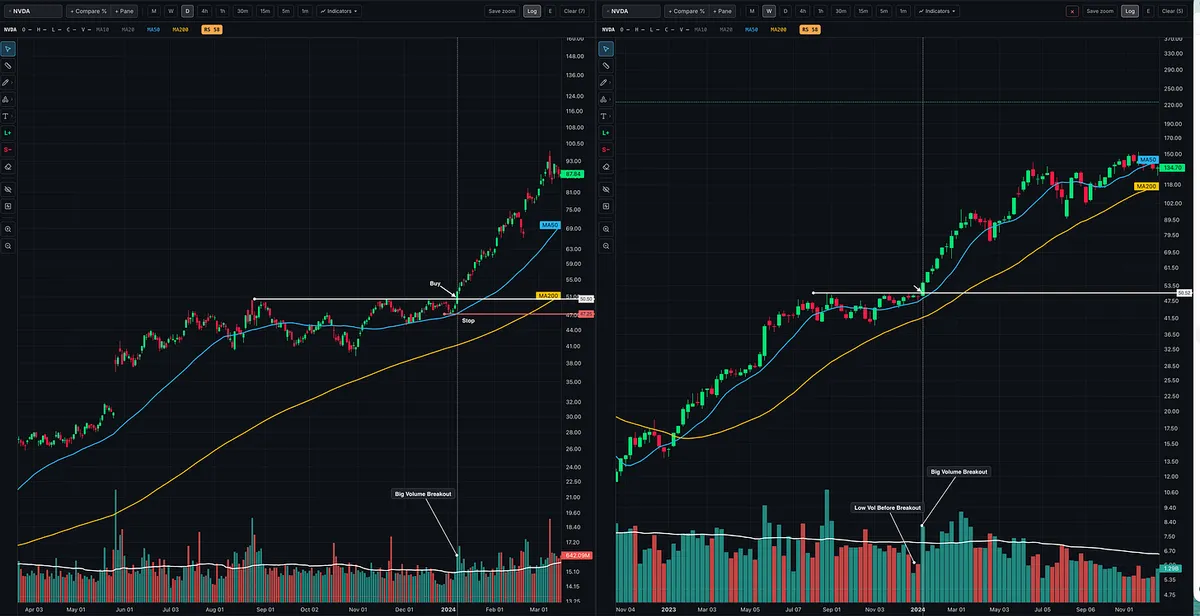
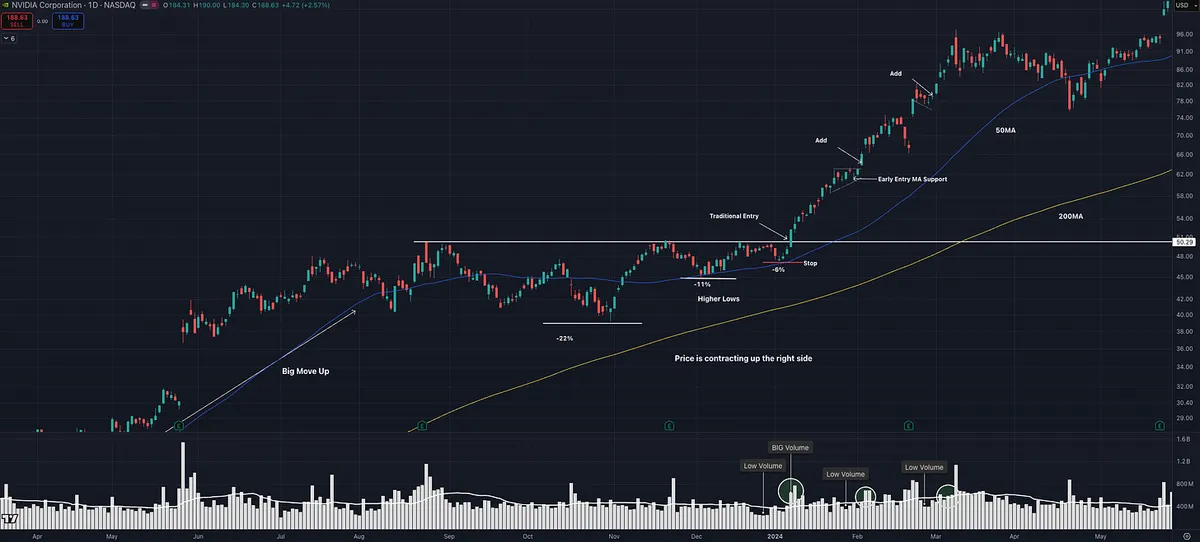
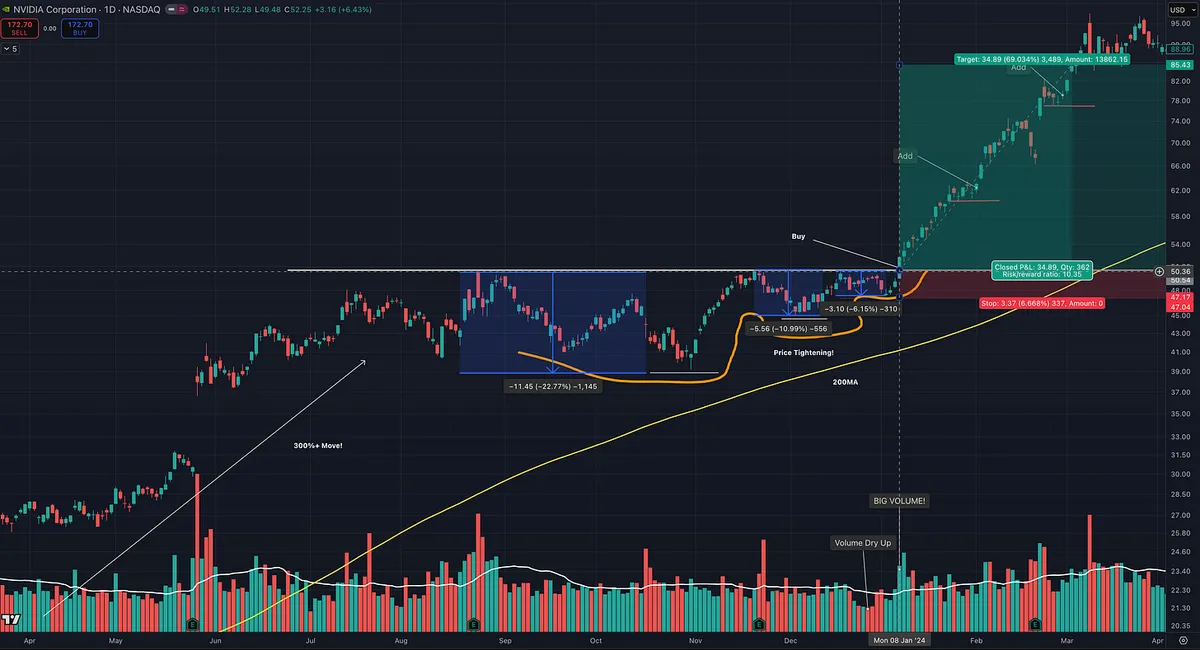
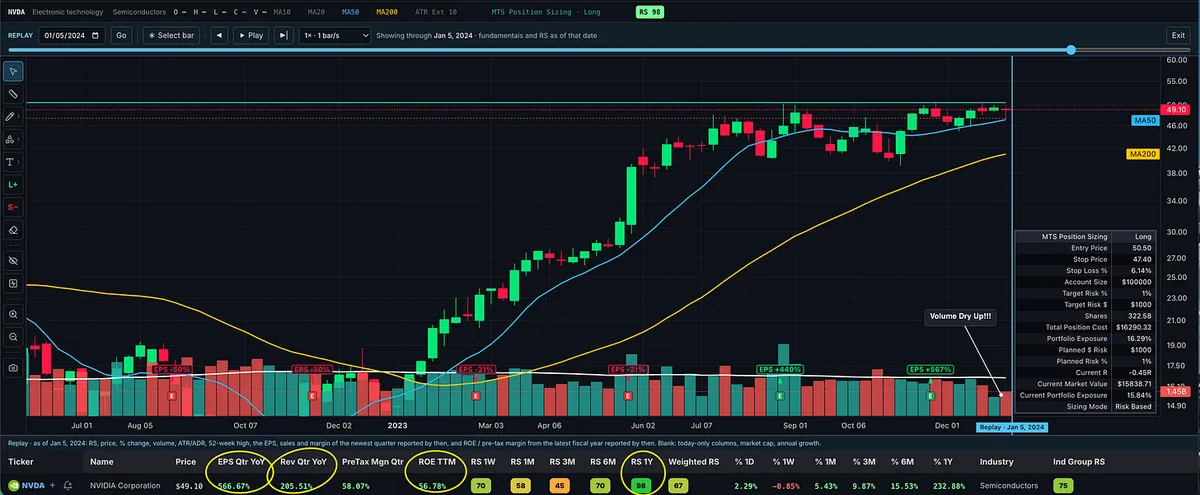
Look at $NVDA before and after its January 2024 breakout.

First, understand the context. As the market emerged from the 2022 bear market into 2023, AI became one of the new bull market’s defining themes. Semiconductors were a major leadership group, and NVIDIA was a standout leader.

Before these contractions developed, NVDA had already advanced more than 300% from its 2022 low.

That matters. A quality VCP starts with a stock that has already demonstrated powerful price performance and high relative strength, backed by the characteristics I look for in a potential market leader.

Then comes the tightening.

On the right side of this base, the pullbacks became progressively smaller: approximately 22% → 10.8% → 6–7%.

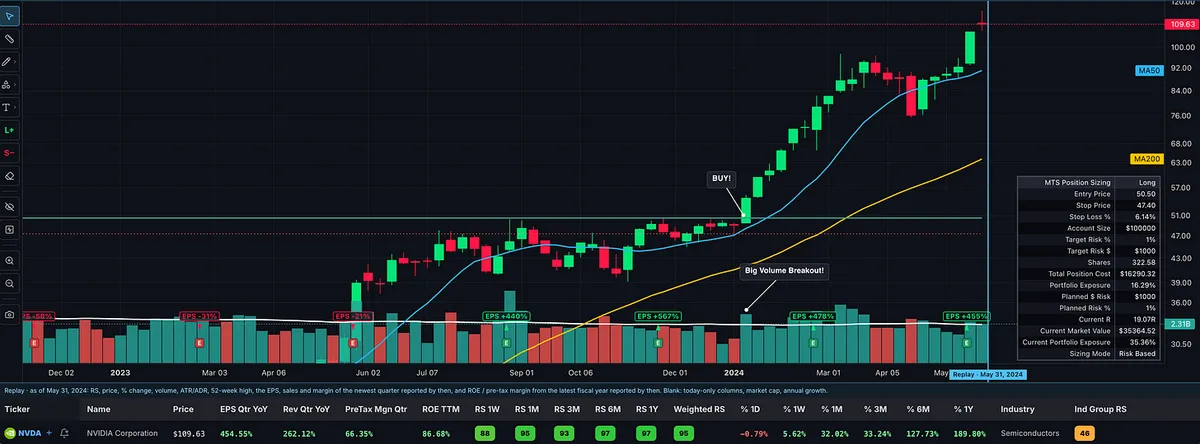
Before the move, price tightened near the $50.50 pivot. Volume dried up along the right side of the base.

Then demand showed up. Price broke through the pivot as volume expanded.

By May 31, NVDA was trading at $109.63.

But look closely at what happened BEFORE the breakout.

The tighter price action. The quieter volume. The stock holding near resistance instead of giving much ground.

That’s the character I look for in a VCP setup: volatility contracting and selling pressure easing as the stock approaches its pivot.

A lot of traders focus on the contractions and overlook the move that preceded them. I want proven strength coming into the base, followed by progressively tighter action that creates an entry.

The appeal is a clear entry with a nearby level to define risk. You don’t need to know how far the stock will run to plan where you’ll get out if the trade fails.

These before-and-after charts in MTS Velocity’s Replay make that transition easy to study.

My rule for this setup: Look for price tightening and volume drying up into the pivot, then volume expanding on the breakout. If that character is missing, I don’t force the trade.

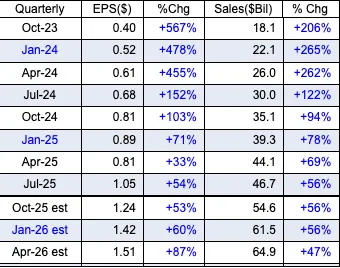
Also, look at the numbers BEFORE the breakout: quarterly earnings growth of 567% and sales growth of 206%, both year over year. A 58.8% pretax margin, 56.8% ROE, and a one-year RS rating of 98. All within an industry group ranked in the top third of the market.
View on Substack ↗

The Best Thing About a VCP Isn’t the Breakout

One of my favorite quotes in Market Wizards comes from Bruce Kovner:

“Whenever I enter a position, I have a predetermined stop. That is the only way I can sleep. I know where I’m getting out before I get in. The position size on a trade is determined by the stop, and the stop is determined on a technical basis. For example, if the market is in the midst of a trading range, it makes no sense to put your stop within that range, since you are likely to be taken out. I always place my stop beyond some technical barrier.”

- Bruce Kovner, Market Wizards

That quote explains one of the biggest reasons I love the Volatility Contraction Pattern.

Most people focus on the obvious part of a VCP.

  • Price tightens.

  • Volume dries up.

  • Supply appears to diminish.

It is almost like a rubber band being pulled tighter and tighter, creating the potential for an explosive move once demand overwhelms the remaining supply.

All of that is great, but that is not my favorite part.

My favorite thing about a VCP is that it can give you a very clear technical level where you have decided the trade is wrong.

Look at NVIDIA in early 2024.

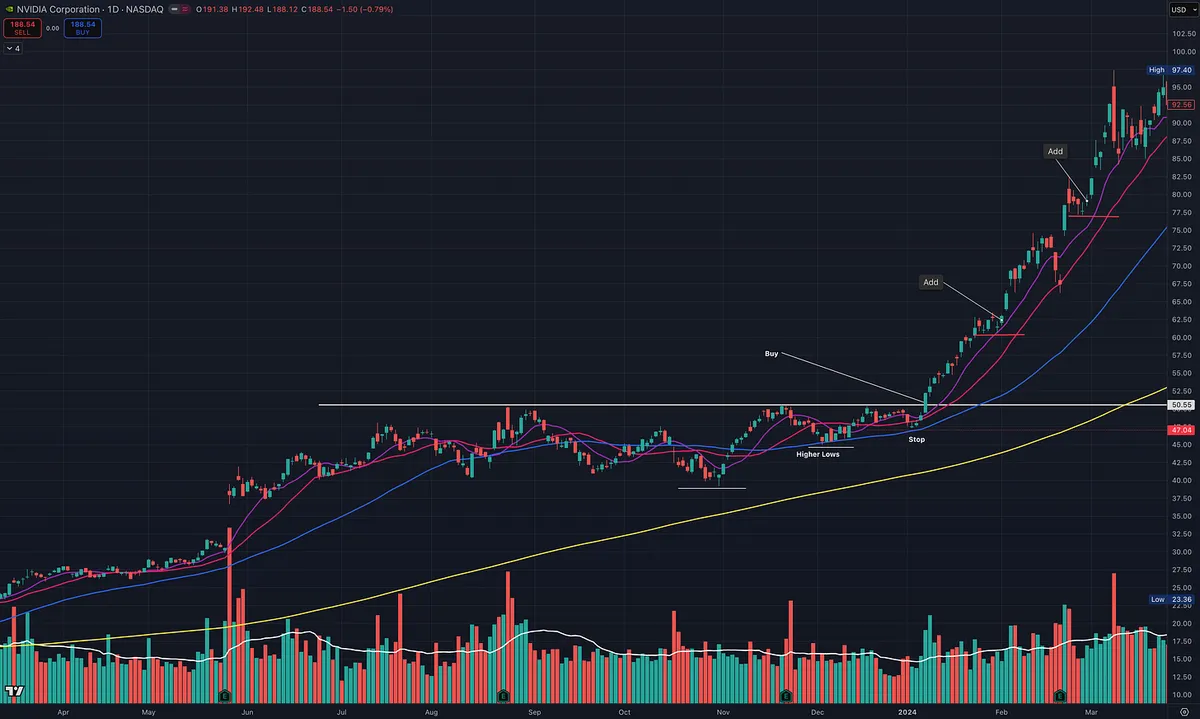
The stock tightened up near the pivot. Volume dried up. Then price broke through the line of least resistance on expanding volume.

But before the breakout ever happened, I could already identify my risk.

I knew where I wanted to enter.

I knew where the technical structure would begin to fail.

And because I knew my stop, I could determine my position size before putting capital at risk.

That is the part many traders get backwards.

They decide how many shares they want to own first, then try to squeeze a stop somewhere underneath the trade.

I prefer the opposite:

  • Find the setup.

  • Find the technical level that invalidates the setup.

  • Set the stop beyond that level.

  • Then size the position.

The chart determines the risk.

Your desired position size should not determine the chart.

And this is why a tight, well-formed setup can be so powerful. It is not simply that the stock might explode higher.

It is that you can potentially participate in that move while knowing where your idea no longer makes sense.

View on Substack ↗

Is a 5% Stop Too Tight in Today’s Market?

I got a great comment recently:

“It’s just that -5% is not much in today’s markets. Not enough not to get whipsawed. What’s your view?”

Here’s my answer.

I disagree.

There are still plenty of setups where you can risk 5 percent or less.

If that wasn’t the case, traders like Kristjan Kullamägi wouldn’t be as successful as they are.

Same with Mark Minervini. He won the U.S. Investing Championship in 2021. He’s still finding tight entries in today’s market.

It comes down to tactics and timing.

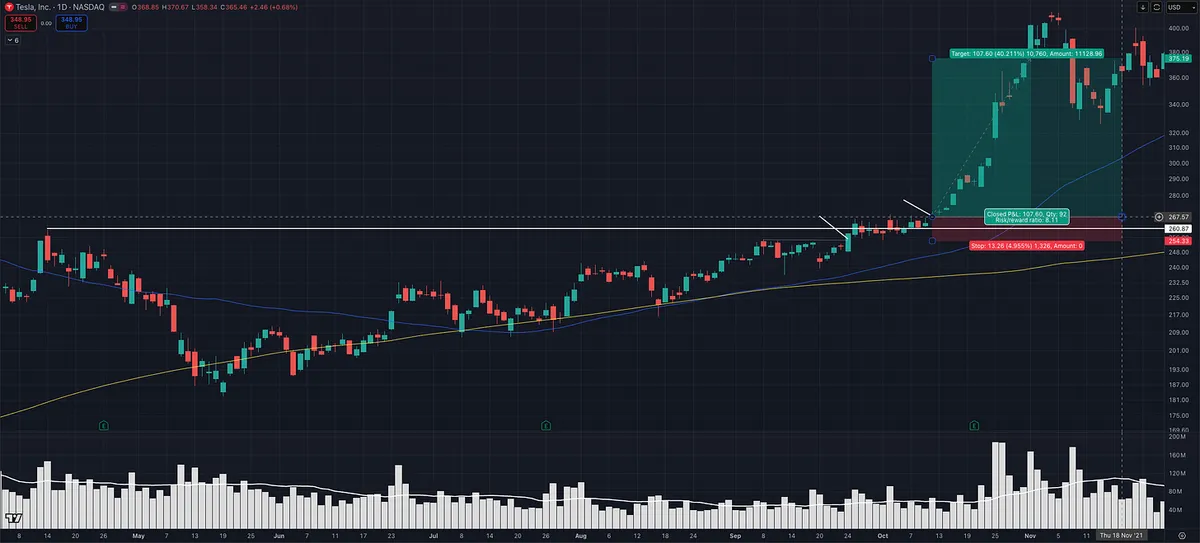
This TSLA example is a good illustration.

On the right side of the base, price was tightening and structure was clean. That created multiple opportunities where risk could be kept at 5 percent or less.

Recently (2025-2026), with many of the big winners already extended in Stage 2 uptrends, it’s a different environment.

If you’re only buying standard breakouts here, then yes, your stop likely needs to be 7 to 10 percent.

But that’s just one way to play it.

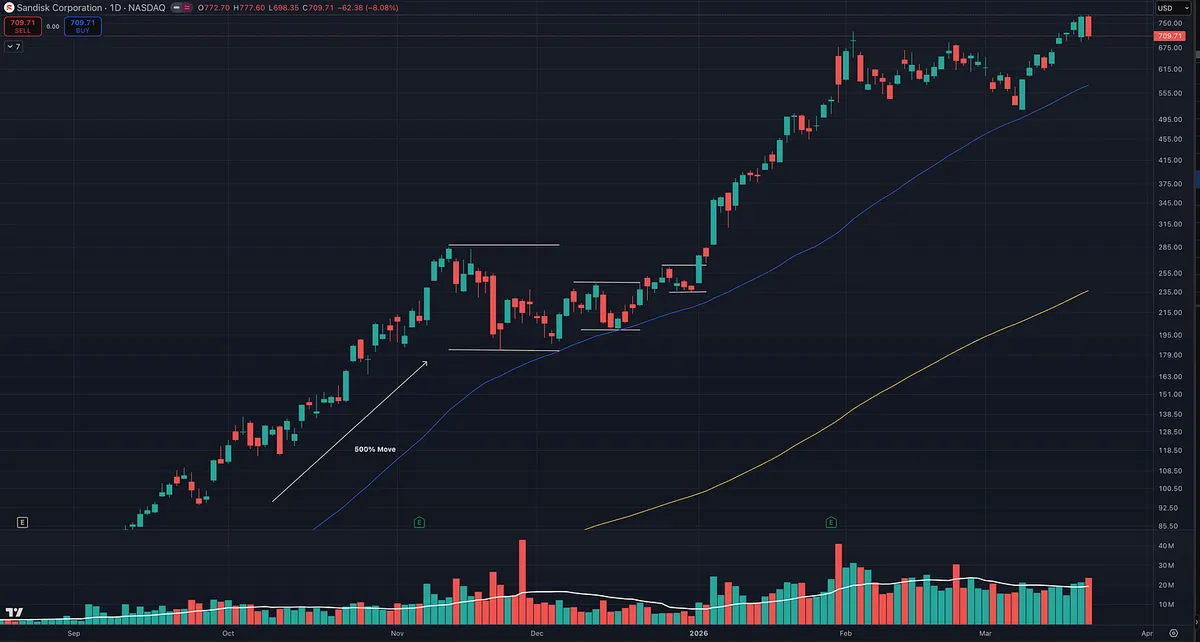
A lot of the big winners from 2025 to now in areas like computer data storage and telecom, names like LITE, SNDK, MU, CIEN, WDC, were harder to trade with tight risk using traditional breakout entries.

Their ADR% was higher, and there was less contraction into the pivot, so traders had to adapt.

Pullback entries. Low cheats. Intraday entries like ORB.

Those allow you to define risk much tighter and still participate without getting shaken out.

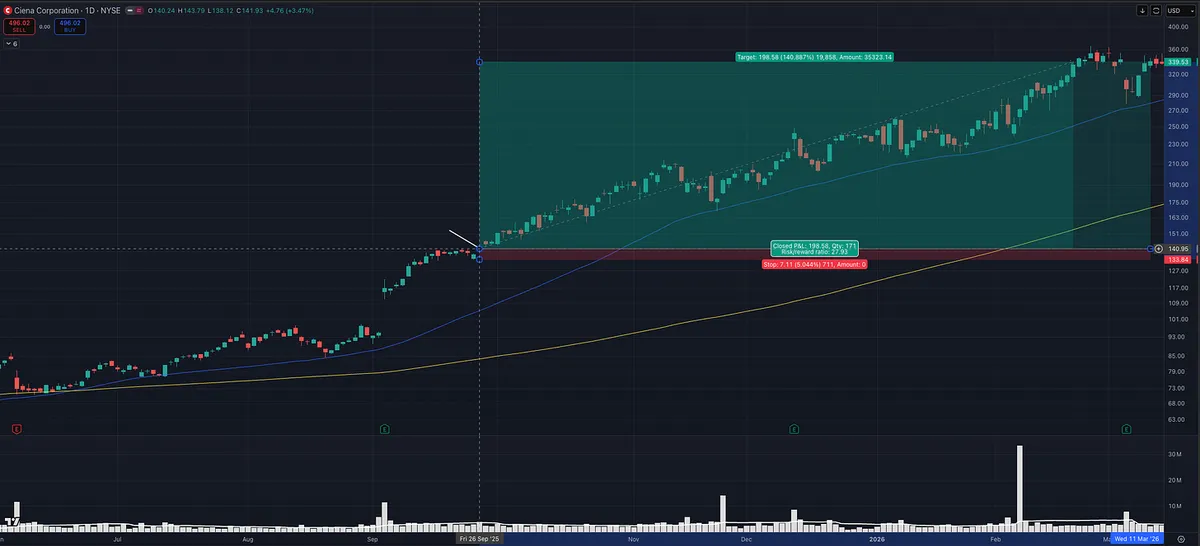
CIEN is another good example.

After an episodic pivot on earnings, price ran, then tightened sideways. That created a clean opportunity to enter with defined, tight risk.

This isn’t about forcing a fixed 5 percent stop on every trade.

It’s about finding entries with proven setups where tight risk actually makes sense.

Timeframe matters. Setup matters. Execution matters.

And just like Minervini, I’m not rigid with it.

Some trades might be 3 percent risk. Some 5 percent. Some 6 to 8 percent depending on the setup.

I’ll even go up to 10 percent and adjust position size, but I prefer tighter risk when the setup allows it.

Another good example is NVDA in 2024. I had about 6 percent risk. Someone else could have taken the same trade and used the breakout day opening range low as a stop and risked closer to 1.82 percent and likely wouldn’t have been stopped out.

Like David Ryan often emphasizes, the best trades tend to be hard to buy, work right away, and don’t look back.

The principle stays the same.

Keep losses small. Don’t let one trade do real damage.

And at the end of the day, we all trade differently and that’s ok.

That’s what makes a market.

Different styles can still make money.

View on Substack ↗

Why You Can’t Find VCPs Right Now (And Why That’s Not a Problem)

Received a great question today about VCPs that I think a lot of traders are struggling with right now.

They mentioned how hard it has been to actually find clean VCP setups, even after studying charts and screening for them.

This is a great question, and honestly what you’re experiencing is completely normal.

The first thing to understand is that most VCPs are not going to look like the textbook examples. The clean, perfectly staged contractions that many show are the exception, not the rule.

Minervini is not teaching you to find a perfect pattern. He is teaching you to recognize behavior.

What you are really looking for is:

  • volatility contraction over time

  • tighter price action

  • controlled pullbacks instead of sharp selloffs

  • volume drying up into the pivot

  • price tightening up the right side of the chart

Those things can show up in many different ways, and often they are subtle.

The second part of this is the environment.

Right now, it is harder to find clean setups. That is not a coincidence.

The best looking VCPs tend to show up earlier in a bull cycle when institutions are aggressively building positions and leadership is expanding. As the market matures, stocks become more extended, price action gets looser, and breakouts become less reliable.

So when you are scanning and thinking “these don’t look like the examples,” that is actually information.

It is telling you that either:

  • the setup is not truly there

  • or the environment is not ideal for it

A good way to think about it is this:

You are not trying to find a perfect VCP. You are trying to identify when supply is being absorbed before a potential expansion move.

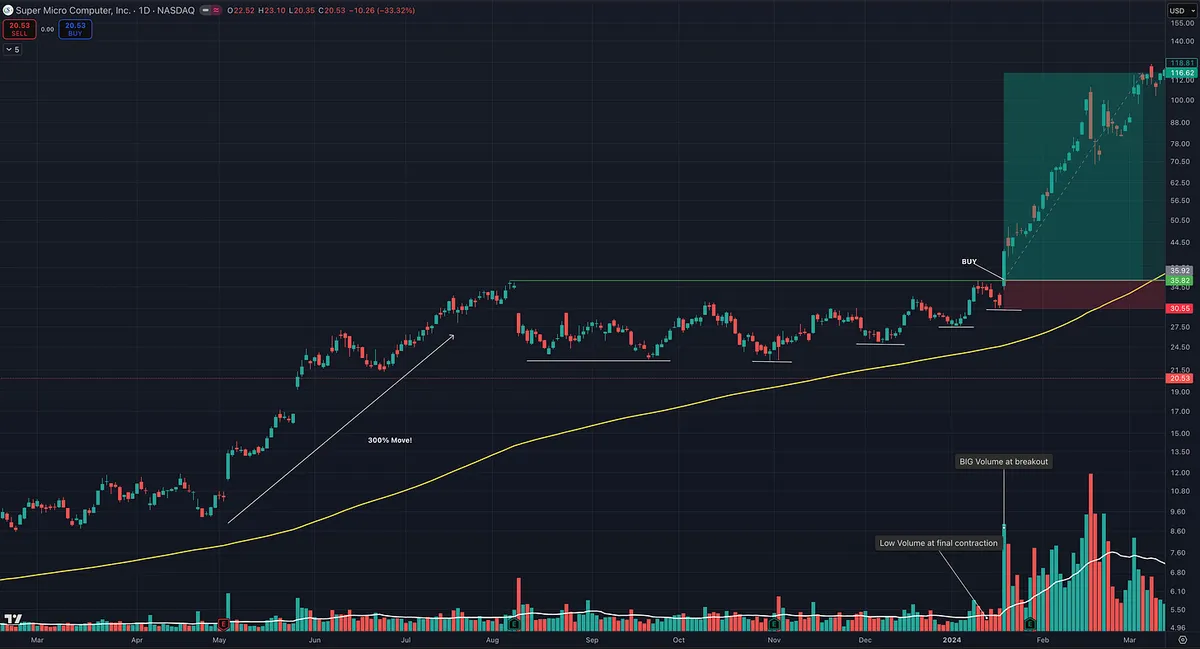
Sometimes that will look very clean like NVDA earlier in 2024 or slightly less perfect like SMCI. Other times it will look much messier, like SNDK in 2025, and require more experience to recognize.

If you are struggling to find them right now, that might not be a skill issue. It is very likely a reflection of the current market conditions.

Over time, you will get better at spotting these. It comes from screen time and reviewing charts over and over. What looks unclear now will start to stand out much more with experience.

Also, you do not need to master every setup to be successful. Some traders naturally see certain patterns better than others.

For example, you might find that:

  • cup with handle setups stand out more to you

  • or flat base breakouts are easier to recognize

That is completely fine.

The goal is not to trade every setup. The goal is to find the ones you can consistently recognize and execute well, and focus on those.

View on Substack ↗

Buying Pullbacks vs Buying Breakouts

Most traders think you have to pick one.

You don’t.

You just need to know what each one does for you.

Buying Breakouts

You buy strength.

You buy as price clears resistance.

You buy as the stock moves into new high ground.

Why I use it:

• It confirms demand

• Overhead supply is gone

• Risk is clearly defined below the pivot

• Momentum is aligned

Breakouts increase probability.

When the market is in a strong uptrend, this is the cleanest way to initiate a position.

But there is a tradeoff.

• You pay up

• Everyone sees the same level

• Shakeouts are common

• Cost basis rises quickly if you keep adding

Breakouts are powerful.

They are also crowded.

Buying Pullbacks

You are not buying weakness in a downtrend.

You are buying weakness inside a confirmed uptrend.

Higher highs. Higher lows.

Rising 10-day, 21-day, or 50-day moving average.

Why I use it:

• Lower cost basis

• Better risk to reward

• Easier to accumulate shares

• Less competition

• Opportunity to add size without chasing

But the key to buying pullbacks is not guessing.

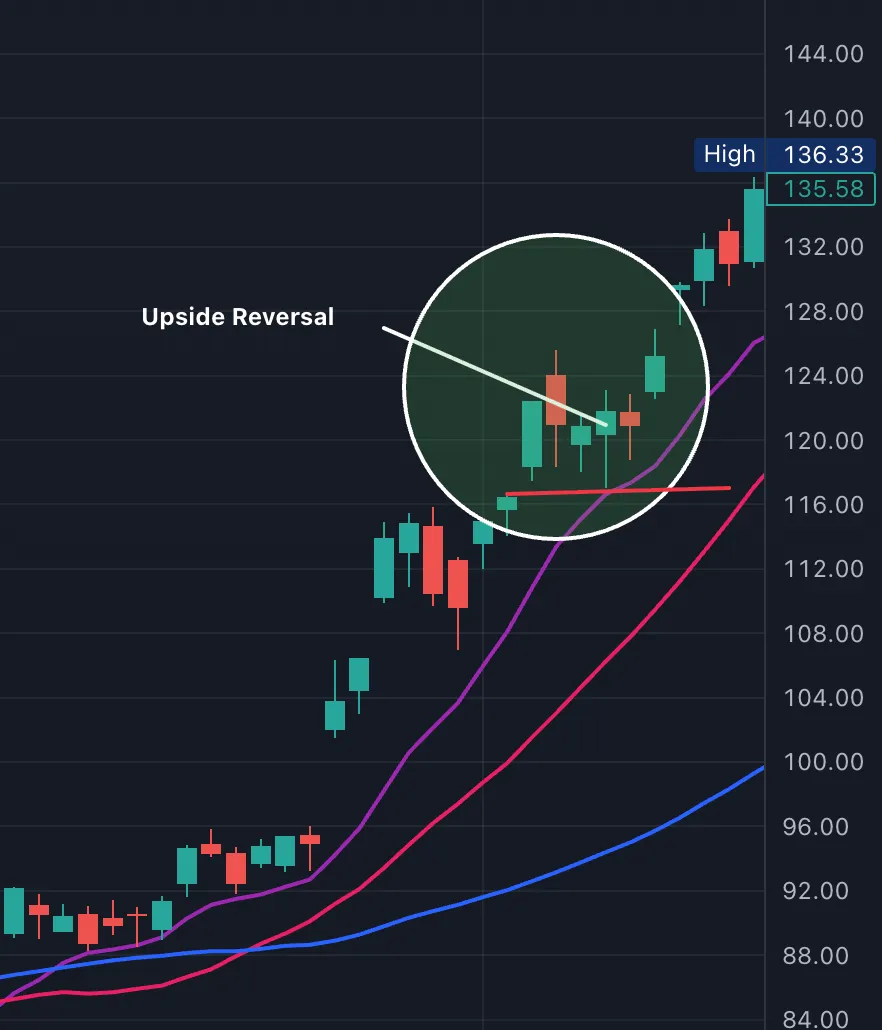
It is waiting for an upside reversal at support.

A shakeout.

A reclaim.

A strong close near the highs of the day.

That upside reversal becomes your signal.

The low of that reversal day becomes your stop.

If price undercuts it, you are wrong.

Without that trigger, you are just catching a falling knife.

Pullbacks improve positioning.

But they require:

• A strong general market

• A stock in a defined uptrend

• Clear support levels

• Absolute risk control

If support breaks, you are wrong.

How I Actually Trade It

Many times I do both.

I buy the traditional breakout.

Then I add on pullbacks.

Breakouts get me involved. Pullbacks help me build size.

If the stock is truly a leader, it will:

• Break out

• Pull back to the 10, 21, or 50

• Stage an upside reversal

• Resume higher

That is where real position building happens.

The goal is not to be right once.

The goal is to build size in the right stock while controlling risk.

Some uptrends reward breakouts more.

Some reward pullbacks more.

You need to be aware of what is working best right now.

NVDA Example

NVDA provided a textbook example of this sequence.

Flat base breakout from VCP to initiate.

Then a controlled pullback into the rising 10-day.

On that pullback, price:

• Touched support

• Reversed higher

• Closed above the prior day’s close

• Traded above the prior day’s high

That is buying a pullback within an uptrend.

The low of that reversal day or low of pullback becomes the stop.

Breakout to get involved.

Pullback to add.

That is how real leaders let you build a position.

View on Substack ↗

Most traders study charts after the big move.

That’s why they keep missing the best setups.

The real edge is learning to recognize what a stock looks like before it breaks out. Tightening price action. Drying volume. Quiet strength on the right side of the base.

I just published a post on how to train your eye to spot winning setups in real time, using NVDA as a real example.

If you want to stop chasing and start anticipating, this is worth reading.

👇

https://tradingmomentum.substack.com/p/how-to-train-your-eye-to-spot-winning

ArticleHow to Train Your Eye to Spot Winning Stock Setups Before the Breakout
View on Substack ↗

NVDA — Same Story, Different Cycle

It’s always funny to see the chatter every time $NVDA consolidates. Just like people who think a stock or asset will never go down, there’s always another camp convinced “the top is in.” Then NVDA goes up, consolidates, and does it again, more times than I can count. 😂

That’s exactly why it’s so important to focus on price action and volume, and to look for good risk/reward opportunities until the trend actually confirms it’s over. Until then, the key is to stay unbiased and keep making smart, high-probability bets. If you study the greatest market winners of all time, as William O’Neil did, the pattern is clear: leaders in leading industry groups tend to dominate bull markets far longer than most people expect before finally topping out.

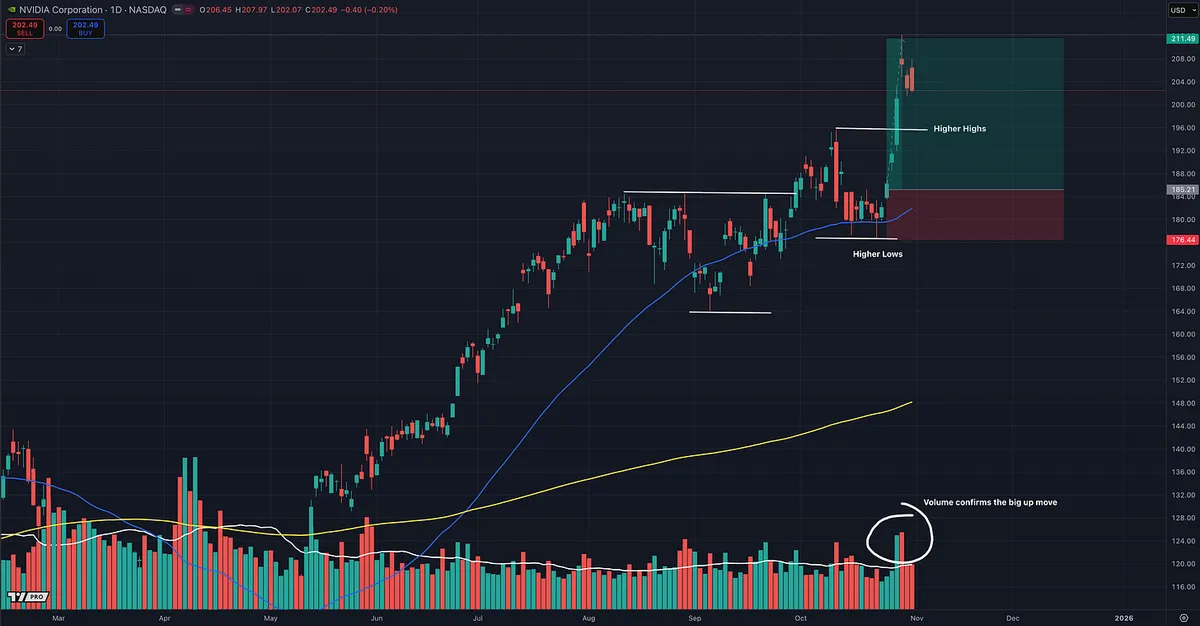
Plenty of bulls don’t rely on stochastics or oscillators, just price action and volume — the purest read of supply and demand. From that view, NVDA continues to show strength with higher lows and higher highs through its consolidation, and now it’s broken up out of that range, a textbook bullish continuation.

Price sits above all key daily moving averages (10, 20, 50, and 200 SMA). The last pullback found support at the 50-day on lighter volume, while the recent breakout came on big volume, confirming real institutional buying interest.

From a risk/reward standpoint, this setup is clean: defined support, strong momentum, and volume confirmation — everything you want in a continuation move.

And fundamentally, NVDA remains an absolute leader. It holds an IBD Relative Strength Rating of 90, meaning it has outperformed 90% of all stocks in the market over the past 12 months. That’s not the same as the RSI or Stochastic “relative strength” indicators. IBD’s RS Rating measures true performance versus all other stocks, not short-term momentum.

When you combine that kind of technical strength with fundamental dominance like strong earnings, consistent sales growth, and market leadership, it’s hard not to stay bullish.

NVDA continues to do what great stocks do: Climb, consolidate, shake out the doubters, and climb again.