Momentum Trading Strategy

Notes

Chart Setups & Entries

When and where to buy a stock you have already found: chart patterns, buy points and entry tactics.

Showing 1–6 of 6 notes

$MU ×
View on Substack ↗

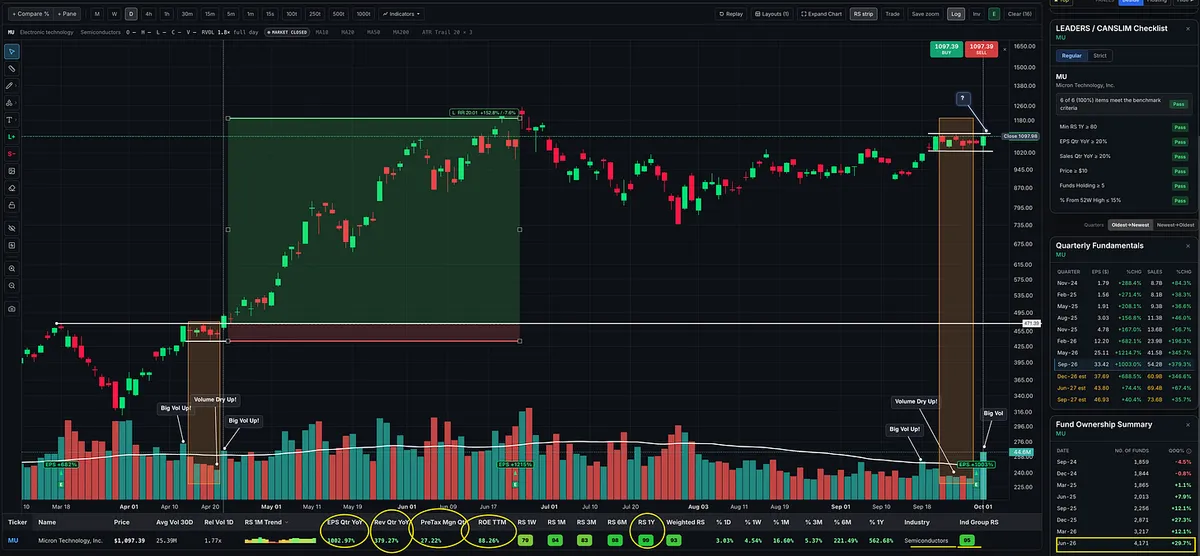
Ummm… hello, MU. 👀

Another massive earnings report, and the chart is getting interesting.

Look at the highlighted setup in April. Now look at the right side of the chart.

Price tightened, volume dried up, and then buyers showed up before that huge advance.

Now MU is tightening again in the upper half of its base, with volume starting to return. This is exactly the kind of price and volume behavior I like.

I’m watching for a decisive move through the top of this tight range, backed by volume and follow-through.

MU, are we getting ready for another launch? 🚀

View on Substack ↗

Risk/Reward Changes With Every Candle. Most Traders Realize It Too Late.

As a growth stock trader and momentum trader, I am not trying to guess the bottom.

I am also not trying to pick the top.

I wait for the market to confirm.

Then I do the same thing with individual stocks.

This is something I talk about in Module 6 of the Momentum Trading Strategy Course in the risk management section.

Risk-reward is not static.

It changes as a stock moves.

After a long consolidation, correction, or deep pullback, the first few days off the lows are always hard to trust.

You do not know if it is real yet.

It could just be another failed rally.

It could just be another bounce before the next leg lower.

But once the market gives a real green light, that is where your focus should shift.

  • A follow-through day.

  • Price reclaiming key moving averages.

  • Leading stocks setting up.

  • Stocks breaking out to new highs.

William O’Neil talked about this idea repeatedly. The goal is not to predict the market. The goal is to understand what the market has actually done and what it is doing now.

He also wrote that investors should buy stocks as they emerge from properly formed bases and begin making new highs in price.

Mark Minervini described a similar moment in Trade Like a Stock Market Wizard.

When a leading stock moved into new high ground as the general market rallied off its lows, he wrote:

“This was the green light to buy.”

You are not trying to be a hero at the bottom.

You are trying to recognize when the evidence has changed.

Now look at MU.

This was not some random stock waking up.

This name has been showing the characteristics of a leader for months.

  • Strong relative strength.

  • A hot industry group.

  • Explosive earnings.

  • Explosive sales.

  • Strong margins.

  • Strong institutional sponsorship.

  • Price above key moving averages.

  • A cup-with-handle type setup.

  • A breakout to new highs on strong volume.

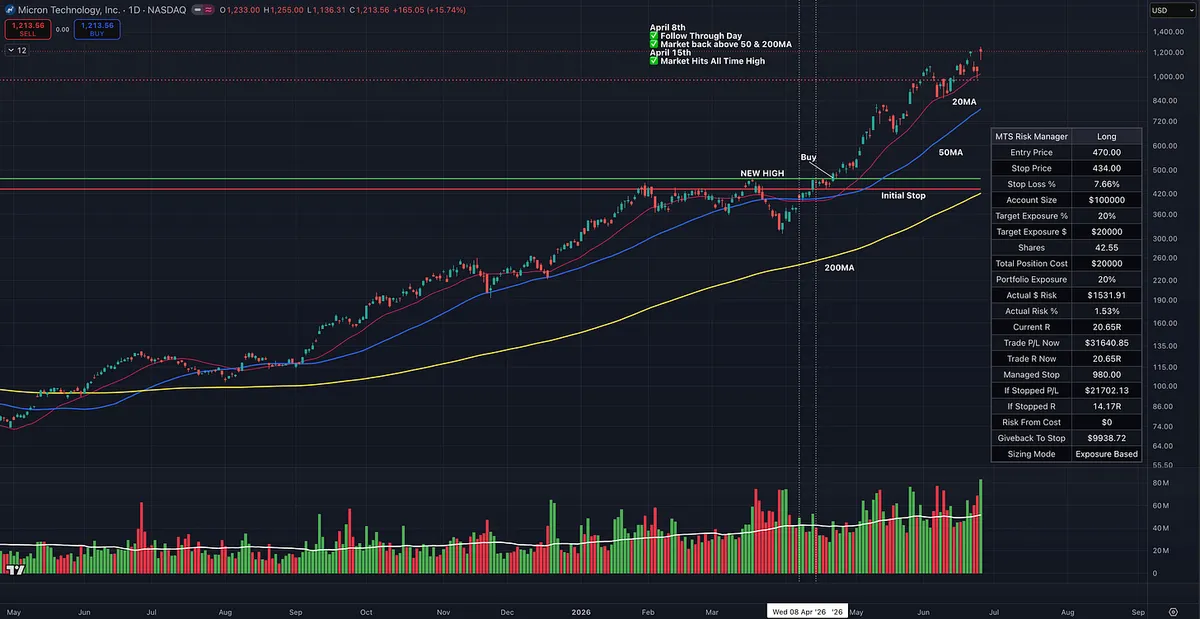
Back in April, during this breakout, the risk-reward was much better.

The multi-month consolidation gave the market and MU the time it needed to reset, shake out weak holders, and build the structure for its next leg higher.

Then, after briefly breaking below the 200-day moving average and washing out many traders, the stock reclaimed key levels, tightened up, and broke out to new highs.

That kind of action can fuel a move that goes much higher and lasts much longer than most people expect.

Now the stock is up roughly 20R from the initial risk.

Could you have made money buying it later?

Sure.

But that is not the point.

The point is that the risk-reward relationship changed.

The market can still go much higher from here.

Or it may not.

Nobody has a crystal ball.

But what we can know is when the market gives us a green light, when leading stocks are setting up, and when the risk can be defined before the move becomes obvious to everyone else.

This is why experienced traders get excited after long consolidations and deep corrections.

Not because the damage is fun.

Because corrections reset the playing field.

When conditions improve and leaders begin breaking out, the risk-reward is usually far better than it is months later after everyone finally feels comfortable.

By the time the trade looks obvious, the best risk-reward is usually already behind you.

View on Substack ↗

“Nothing to Buy?” MU Was Hiding in Plain Sight

I keep hearing the same thing since the follow-through day on April 8th and the move back above the 50-day and 200-day moving averages:

“There’s nothing to buy. Everything is extended.”

I don’t think that’s true.

The issue usually isn’t that there are no stocks setting up. The issue is that most traders are not prepared before the setups happen.

If you had a proper watchlist built, many of the names breaking out right now have been showing leadership for a long time. Yes, some moved before the market gave us confirmation to start getting involved again. That happens. But some broke out after.

MU is a great example.

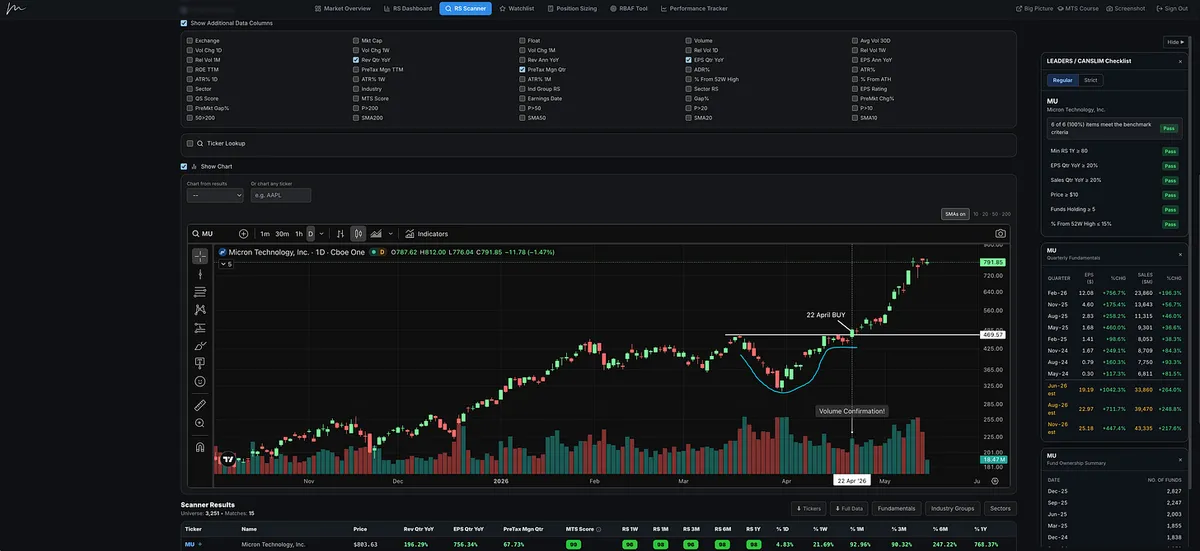
Micron had a beautiful cup-with-handle setup and broke out on April 22nd, roughly 10 to 11 days after the market gave us the signal to start getting back involved.

And this wasn’t some random laggard.

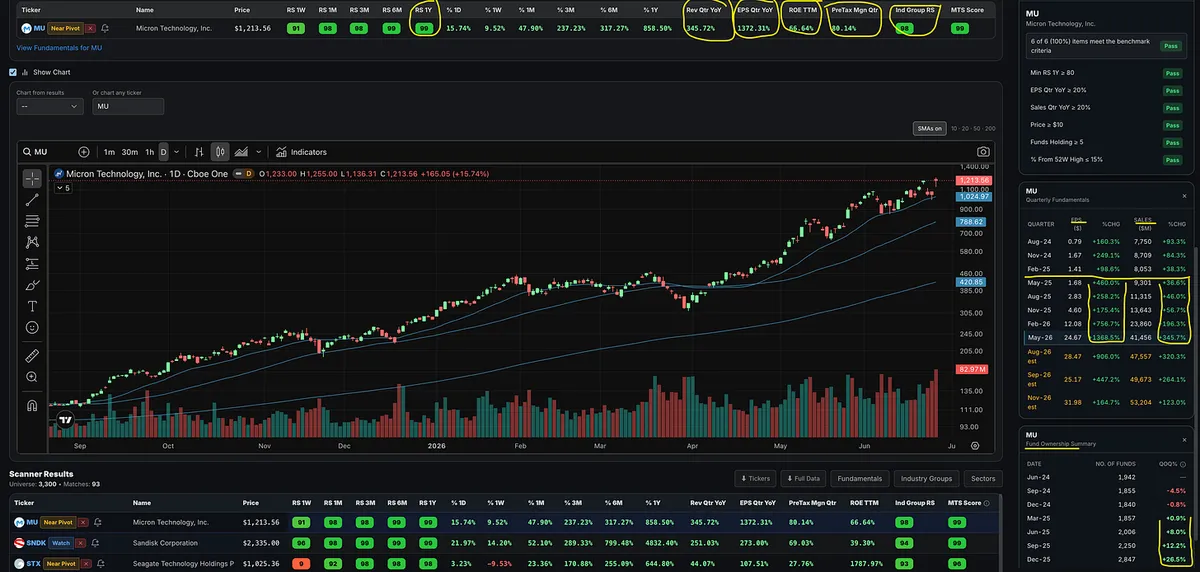
MU had strong relative strength, a hot industry group, big earnings growth, strong sales growth, powerful forward estimates, and a chart that was setting up.

This is exactly why I built the Relative Strength Stock Screener.

The goal is simple: narrow your watchlist down to the strongest leadership names before the move happens, so you don’t miss these types of setups.

Also, try using the MTS Score.

That is our proprietary leadership rating that looks at relative strength, earnings, sales, pre-tax margins, ROE, industry group relative strength, and proximity to 52-week highs.

It is designed to help you quickly separate true leadership from average names.

There have been plenty of stocks.

You just need to know where to look.

View on Substack ↗

Is a 5% Stop Too Tight in Today’s Market?

I got a great comment recently:

“It’s just that -5% is not much in today’s markets. Not enough not to get whipsawed. What’s your view?”

Here’s my answer.

I disagree.

There are still plenty of setups where you can risk 5 percent or less.

If that wasn’t the case, traders like Kristjan Kullamägi wouldn’t be as successful as they are.

Same with Mark Minervini. He won the U.S. Investing Championship in 2021. He’s still finding tight entries in today’s market.

It comes down to tactics and timing.

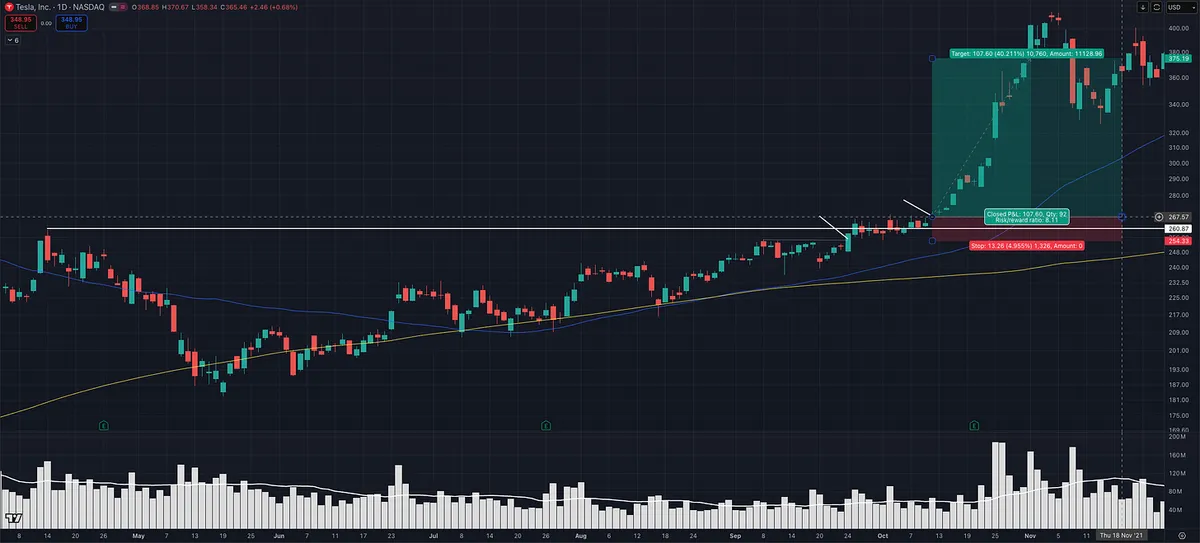
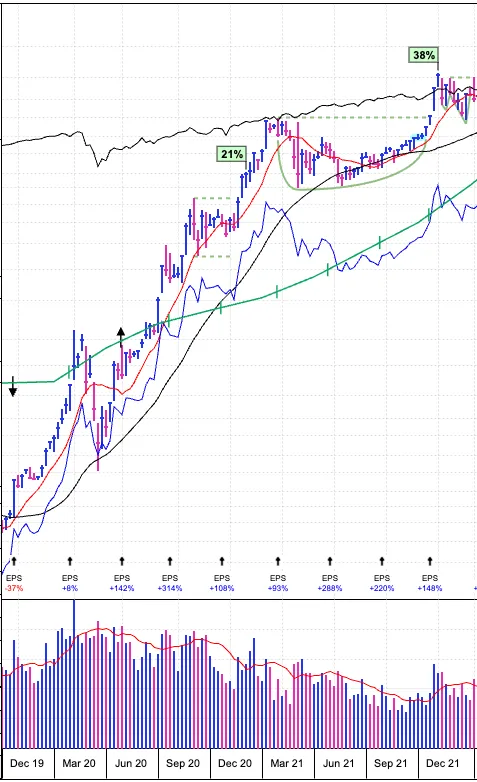
This TSLA example is a good illustration.

On the right side of the base, price was tightening and structure was clean. That created multiple opportunities where risk could be kept at 5 percent or less.

Recently (2025-2026), with many of the big winners already extended in Stage 2 uptrends, it’s a different environment.

If you’re only buying standard breakouts here, then yes, your stop likely needs to be 7 to 10 percent.

But that’s just one way to play it.

A lot of the big winners from 2025 to now in areas like computer data storage and telecom, names like LITE, SNDK, MU, CIEN, WDC, were harder to trade with tight risk using traditional breakout entries.

Their ADR% was higher, and there was less contraction into the pivot, so traders had to adapt.

Pullback entries. Low cheats. Intraday entries like ORB.

Those allow you to define risk much tighter and still participate without getting shaken out.

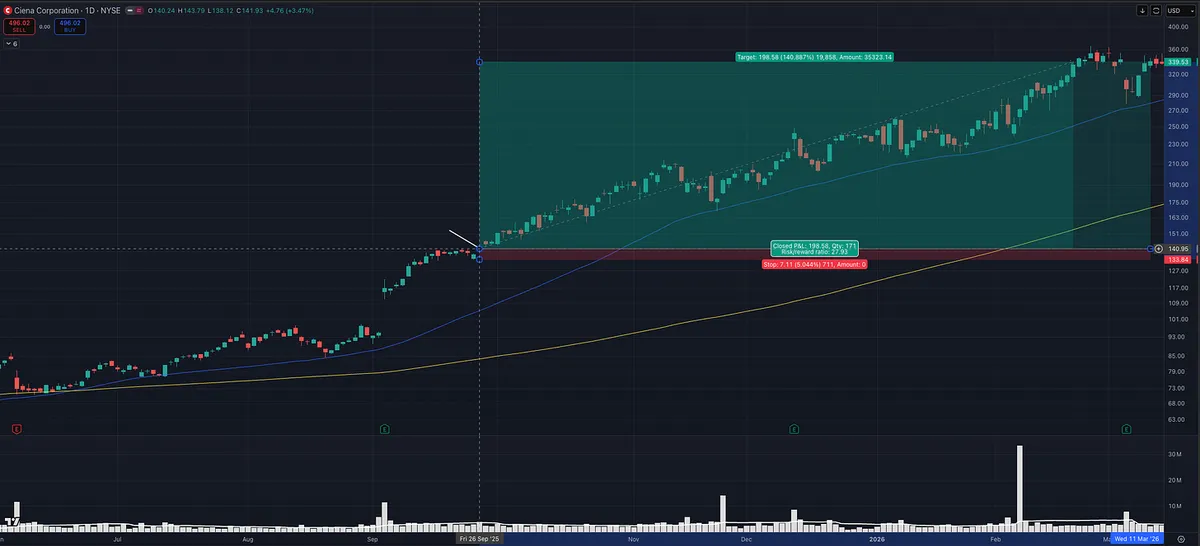
CIEN is another good example.

After an episodic pivot on earnings, price ran, then tightened sideways. That created a clean opportunity to enter with defined, tight risk.

This isn’t about forcing a fixed 5 percent stop on every trade.

It’s about finding entries with proven setups where tight risk actually makes sense.

Timeframe matters. Setup matters. Execution matters.

And just like Minervini, I’m not rigid with it.

Some trades might be 3 percent risk. Some 5 percent. Some 6 to 8 percent depending on the setup.

I’ll even go up to 10 percent and adjust position size, but I prefer tighter risk when the setup allows it.

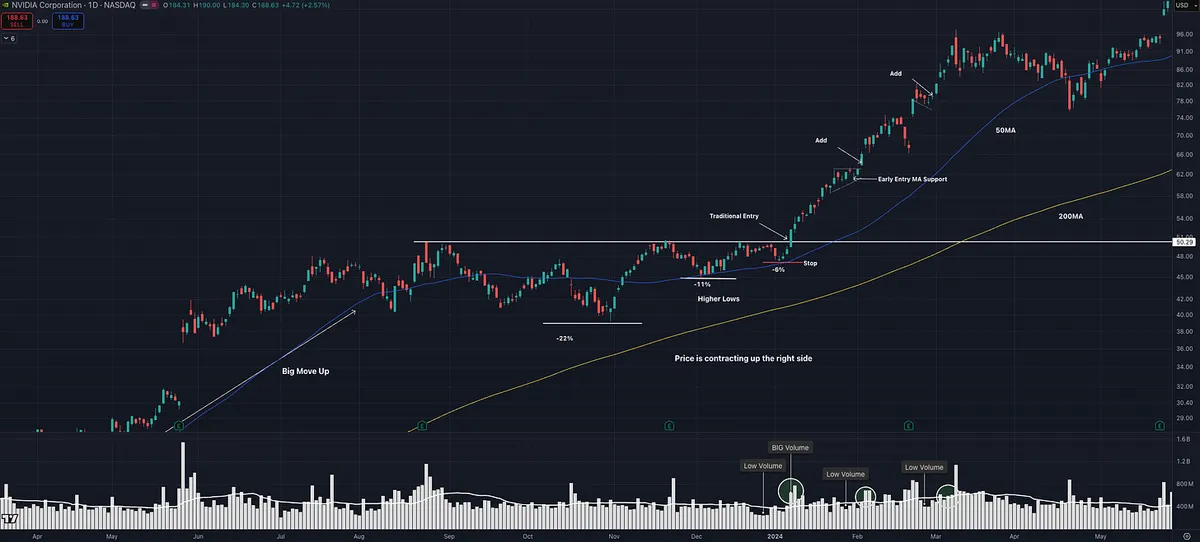
Another good example is NVDA in 2024. I had about 6 percent risk. Someone else could have taken the same trade and used the breakout day opening range low as a stop and risked closer to 1.82 percent and likely wouldn’t have been stopped out.

Like David Ryan often emphasizes, the best trades tend to be hard to buy, work right away, and don’t look back.

The principle stays the same.

Keep losses small. Don’t let one trade do real damage.

And at the end of the day, we all trade differently and that’s ok.

That’s what makes a market.

Different styles can still make money.

View on Substack ↗

“It’s extended.”

That’s what people say when they haven’t studied enough.

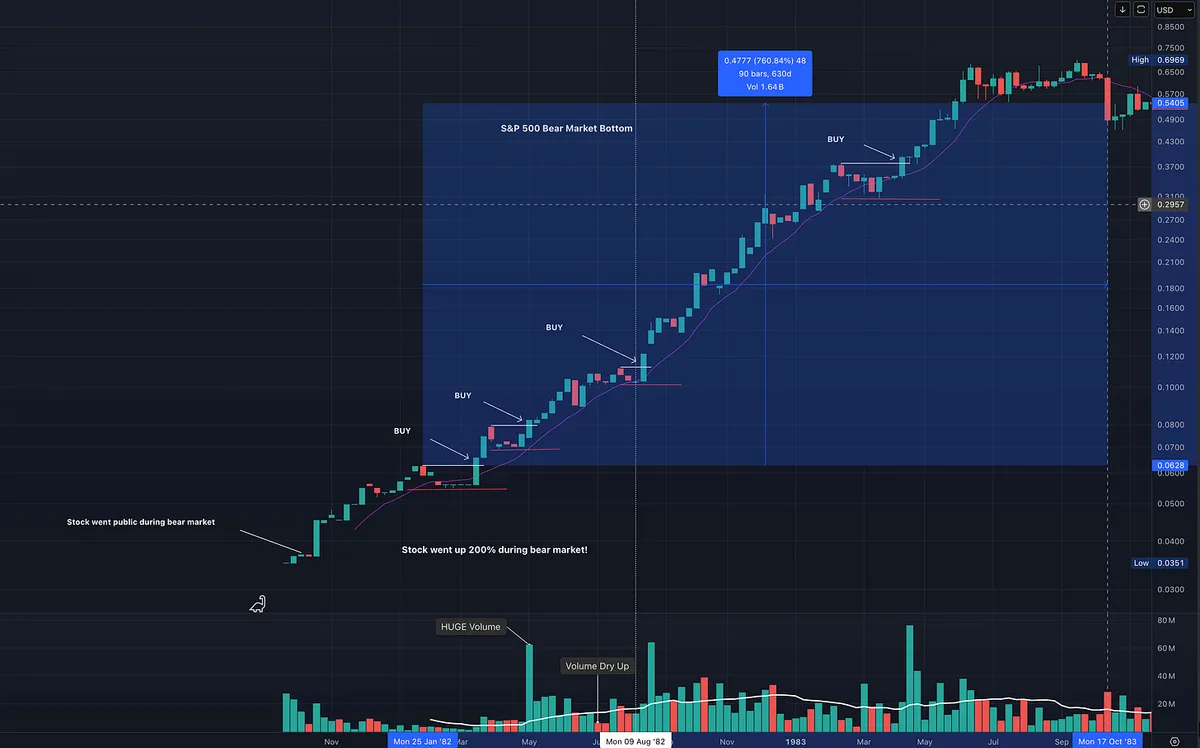
This chart, originally shown in How to Make Money in Stocks by William J. O’Neil , shows something important.

Yes, the stock is extended from what most would call a traditional base.

But Home Depot in the early 80s kept offering low risk, high reward entries inside a powerful Stage 2 uptrend.

Look at the areas marked BUY:

  • Tight consolidations

  • Volume contraction

  • Higher lows

  • Breakout through short resistance

  • Immediate continuation

That is not chasing.

That is entering strength with defined risk.

You do not always need:

  • A cup with handle

  • A massive reset

  • A 30 percent correction

Big institutional leaders often stair step higher.

They build tight flags. They pause. They break out. They continue.

If the stock is trending above a rising moving average, If price is contracting, If volume dries up before expansion,

That is opportunity.

This is not FOMO into a straight up name. We are still being patient. We are still waiting for tight pullbacks inside strength.

It looks very similar to some of the biggest winners we have had recently.

How many could have stepped into MU, LITE, or AVGO using similar entry tactics?

Study that difference.

View on Substack ↗

Study This Chart: One of the Best Low Risk Breakout Setups

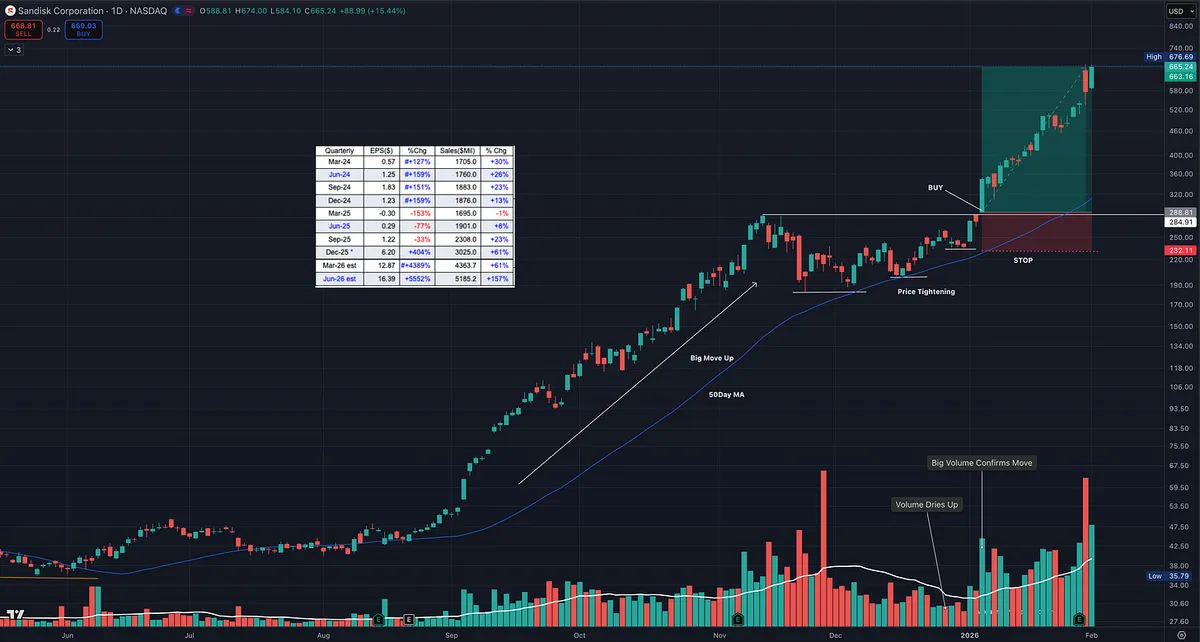
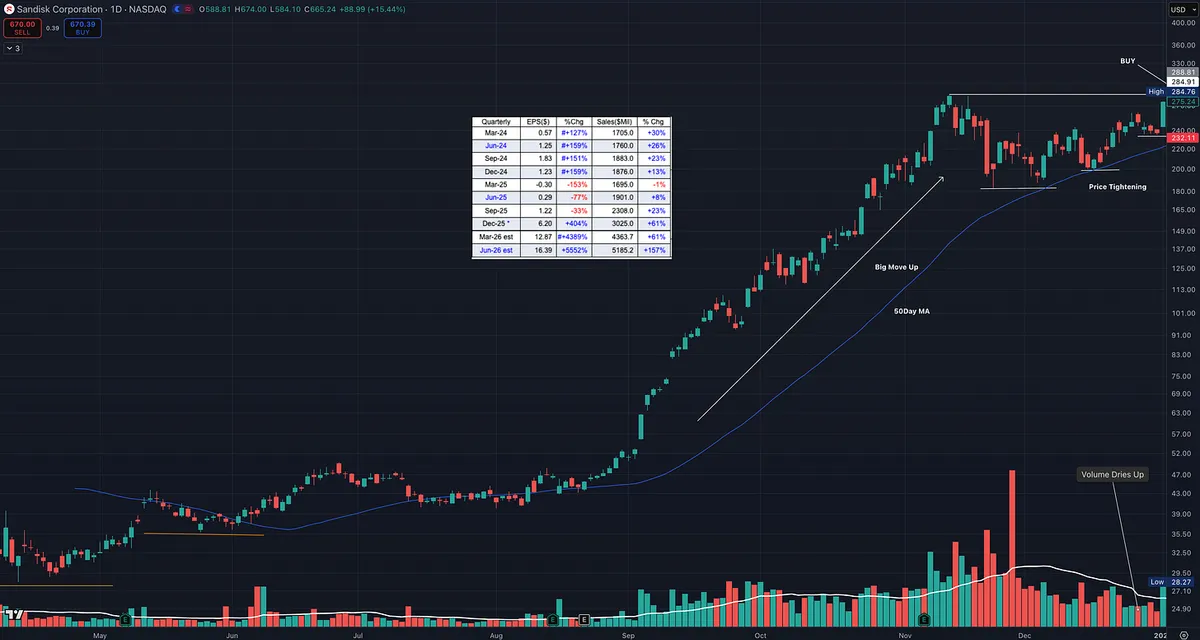
This chart is a perfect example of the type of setup we look for.

The stock is sitting inside a subsector that supports the main market theme right now, AI. When a subsector is strong, it tends to lift the entire group. That is why you see other names in the space acting well too, like Micron Technology, Western Digital, and Seagate Technology.

Now zoom in on the important part.

What makes this a premium setup is that it checks the fundamental boxes that show up in many of the biggest winners of all time, the type of characteristics William J. O'Neil wrote about after studying market history going back over a century.

But fundamentals alone are not what makes this special.

The real edge is the price action.

1) High relative strength

When a stock has RS in the 90s, it is telling you institutions are already voting with their money. This is what you want in a true leader.

2) Big earnings and big sales

Strong numbers are the fuel. Price action is the trigger. When both line up, it is hard for the market to ignore.

3) Big move up, then price tightens

This is the cheat code. A strong advance followed by tight price action. That is where the market gives you a gift.

Tightening action does two things.

  • It shows supply is drying up.

  • It gives you a clean place to define risk.

Why this is low risk and high reward

When price tightens near highs and then breaks out, you can build a trade that is asymmetric.

You are not guessing. You are defining a level that proves you wrong.

If it fails, you are out quickly.

If it works, you can ride a trend and manage it.

That is how you end up with trades that can pay 3R, 5R, even 10R plus while keeping the downside controlled. Study what what it looks like before and after.