Momentum Trading Strategy

Notes

Chart Setups & Entries

When and where to buy a stock you have already found: chart patterns, buy points and entry tactics.

Showing 1–8 of 8 notes

$LITE ×
View on Substack ↗

Missed the Breakout? Learn to Buy the Pullback.

A stock moving beyond its base breakout doesn’t mean you’ve missed every opportunity to get involved. But if you want to participate in the next leg higher, you need to learn how to recognize and buy constructive pullbacks.

You also need to understand which entries the market is rewarding.

Just as we study the market environment, we should study how leading stocks are behaving.

Are breakouts to new highs following through? Or are better opportunities appearing earlier, as stocks find support and begin turning higher?

If you’re always waiting for a new high before entering, pay attention to how much of the move has already happened by the time you buy.

Buying pullbacks has been critical for me over the last few years. It has helped me get involved in several of my biggest winners. LITE and SNDK.

The key is recognizing a pullback within an established uptrend, watching for evidence of support, and identifying an entry where you can clearly define your risk.

Study more than which stocks are working. Study which entries are working.

That can make a meaningful difference in both the opportunities you recognize and the risk you take.

View on Substack ↗

LITE is getting interesting again.

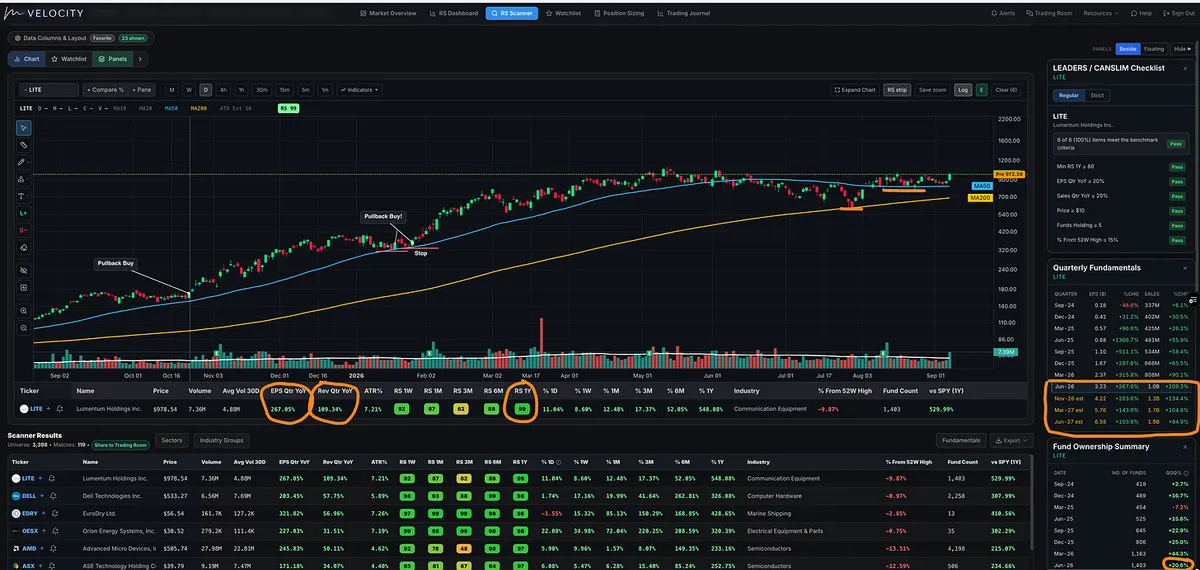
LITE rallied off its 200-day moving average when the market made its low on July 29.

Unlike a lot of the other prior big winners, it has since reclaimed its 50-day / 10-week moving average and continued to hold support. Now it sits less than 10% from all-time highs.

And the fundamentals are still extremely strong.

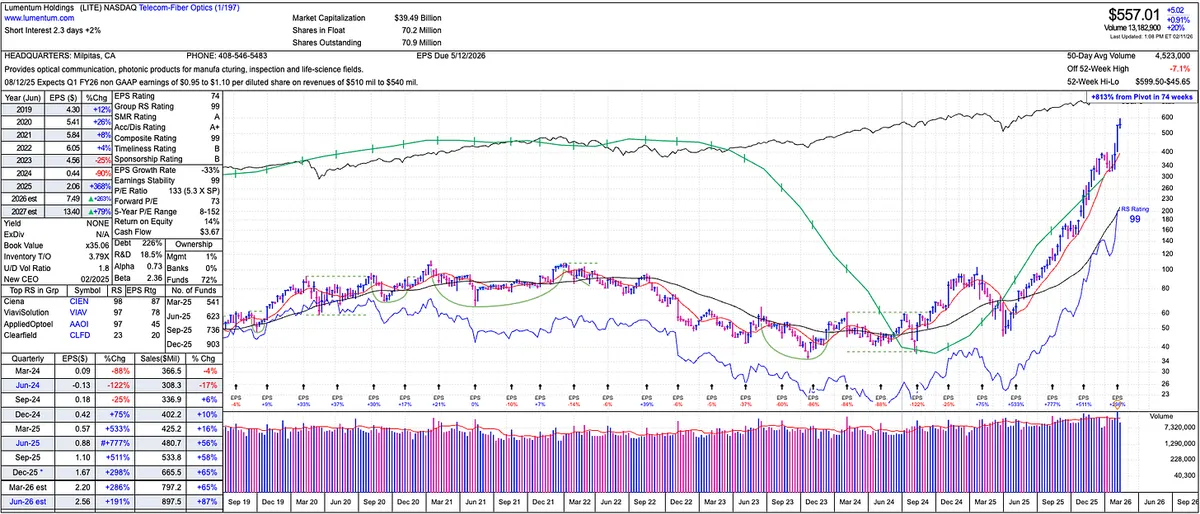
LITE has been putting up triple-digit earnings growth, triple-digit sales growth, and carries a 99 one-year Relative Strength Rating.

Institutional sponsorship has also been expanding aggressively, with the number of funds owning the stock growing roughly +20% quarter over quarter.

We saw bigger volume coming off the lows and around earnings. Then, as the stock moved sideways and found support around the 50-day, volume dried up considerably.

Yesterday, big volume came back in as LITE pushed toward the top of the consolidation.

Back in January, people told me LITE looked too volatile.

Then they missed the next roughly 100% leg higher.

They told me the same thing back in October 2025.

Welcome to growth stock and momentum trading. 😉

The biggest winners are rarely going to look comfortable.

View on Substack ↗

Why I Wouldn’t Buy DELL Right Before Earnings

Someone asked me why I wouldn’t buy DELL before earnings, especially when I’ve held other stocks through earnings.

The difference is context.

With LITE, I was already in the stock and had roughly a 25% cushion going into earnings. In situations like that, I may sell some before the report and hold the rest through earnings.

That is completely different from initiating a brand-new position right before earnings.

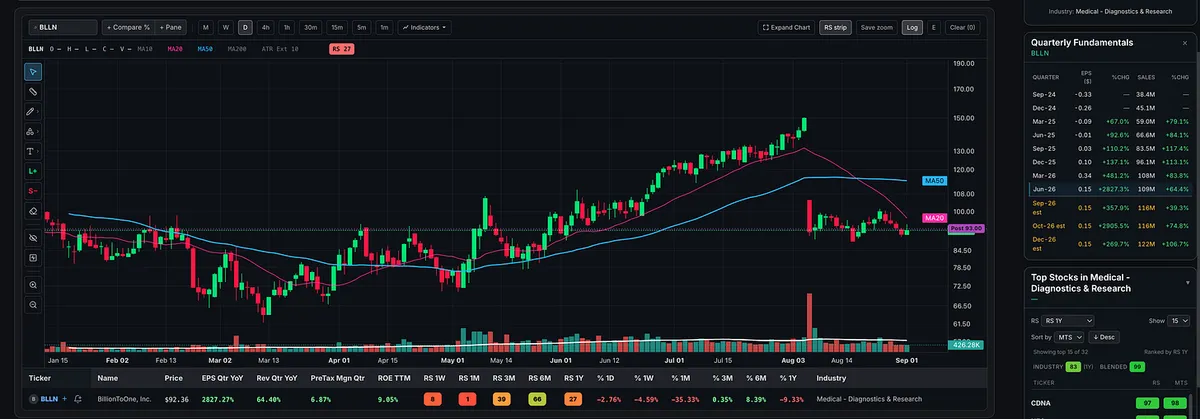
If you want to hold stocks long enough to capture really big moves, eventually you have to get comfortable sitting through some earnings reports. There is no way around that. Even with a large profit cushion, you can still get hit with an ugly reaction, like we saw with BLLN.

But I will NOT buy a stock immediately before earnings just to gamble on the report.

And with DELL specifically, the decision was even easier.

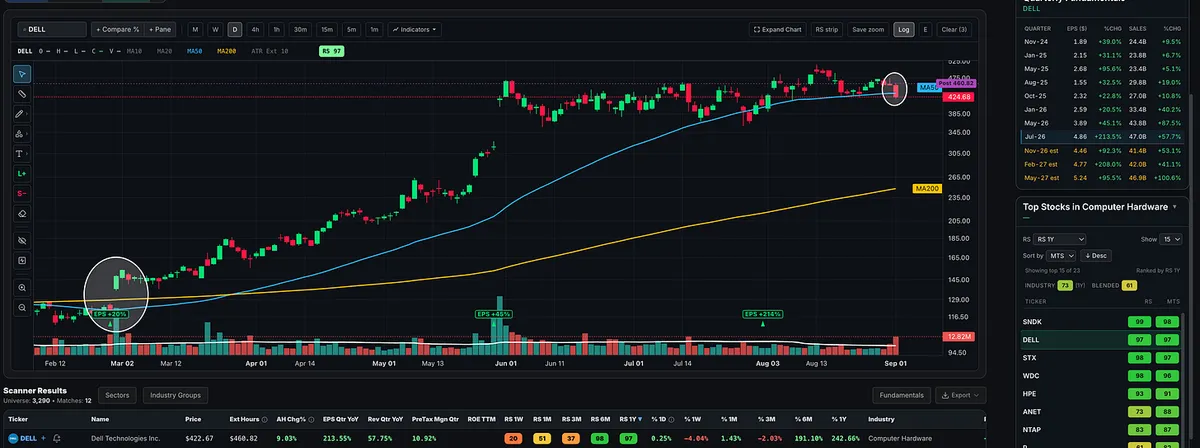
The stock looked like it wanted to go higher, but showed very little follow-through. Then it had a bad day today, falling more than 6% and closing below the 50-day moving average.

On top of that, the overall market hasn’t been acting well.

So now you have:

  • Poor follow-through after a failed breakout attempt

  • A greater than 6% down day

  • A close below the 50-day moving average

  • A less-than-ideal overall market

  • Earnings immediately ahead

Why would I initiate a brand-new position and take on earnings risk with all of that working against me?

For me, there is a big difference between holding earnings with a 20% to 30% profit cushion in an existing position and buying a stock immediately before earnings with no cushion at all.

Those are two completely different risk situations.

Now, with DELL up roughly 10% after hours, I’ll watch how the price continues to act and see whether it gives me a setup. It did something similar in early March after the big gap up in late February.

I don’t need to predict the earnings reaction or gamble on the report. I can wait for the report, see how the market reacts, and then look for a proper setup.

View on Substack ↗

Is a 5% Stop Too Tight in Today’s Market?

I got a great comment recently:

“It’s just that -5% is not much in today’s markets. Not enough not to get whipsawed. What’s your view?”

Here’s my answer.

I disagree.

There are still plenty of setups where you can risk 5 percent or less.

If that wasn’t the case, traders like Kristjan Kullamägi wouldn’t be as successful as they are.

Same with Mark Minervini. He won the U.S. Investing Championship in 2021. He’s still finding tight entries in today’s market.

It comes down to tactics and timing.

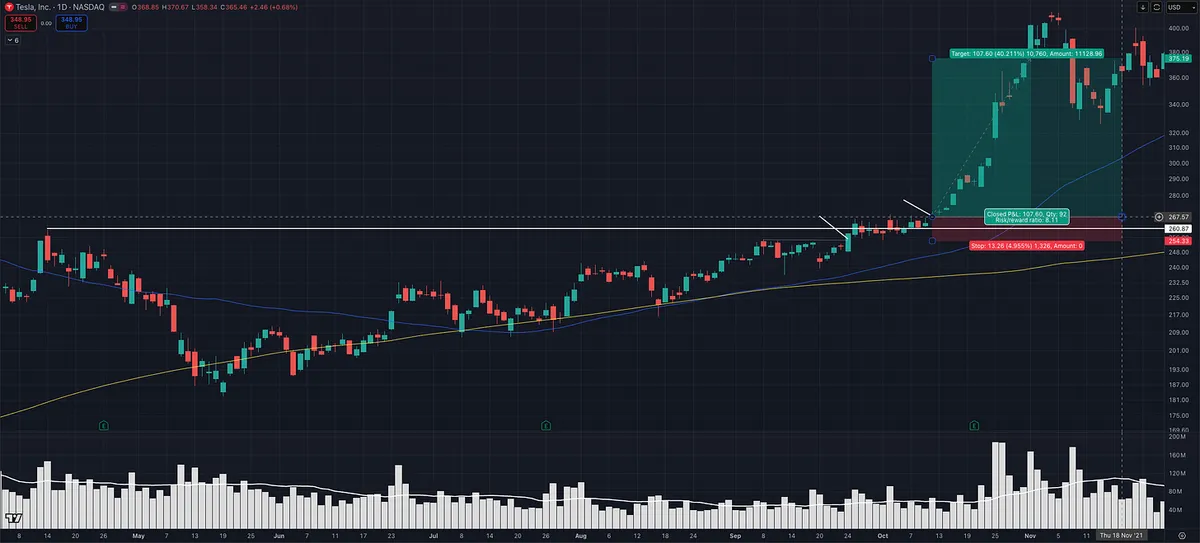
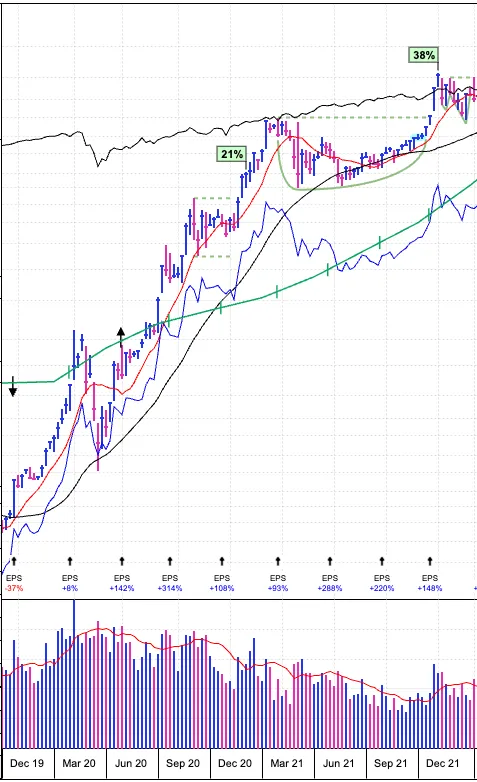
This TSLA example is a good illustration.

On the right side of the base, price was tightening and structure was clean. That created multiple opportunities where risk could be kept at 5 percent or less.

Recently (2025-2026), with many of the big winners already extended in Stage 2 uptrends, it’s a different environment.

If you’re only buying standard breakouts here, then yes, your stop likely needs to be 7 to 10 percent.

But that’s just one way to play it.

A lot of the big winners from 2025 to now in areas like computer data storage and telecom, names like LITE, SNDK, MU, CIEN, WDC, were harder to trade with tight risk using traditional breakout entries.

Their ADR% was higher, and there was less contraction into the pivot, so traders had to adapt.

Pullback entries. Low cheats. Intraday entries like ORB.

Those allow you to define risk much tighter and still participate without getting shaken out.

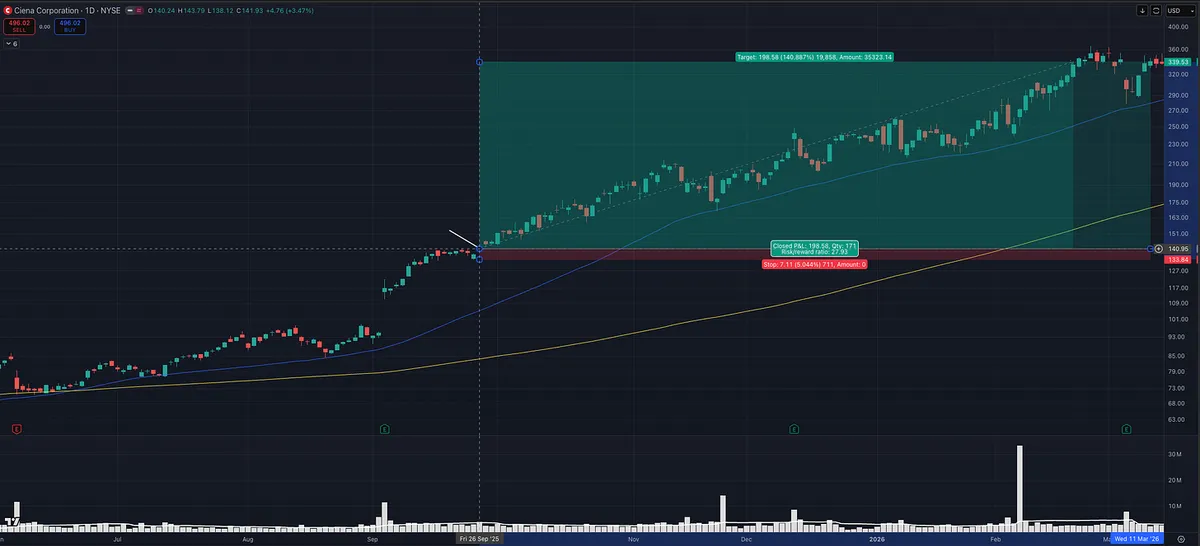
CIEN is another good example.

After an episodic pivot on earnings, price ran, then tightened sideways. That created a clean opportunity to enter with defined, tight risk.

This isn’t about forcing a fixed 5 percent stop on every trade.

It’s about finding entries with proven setups where tight risk actually makes sense.

Timeframe matters. Setup matters. Execution matters.

And just like Minervini, I’m not rigid with it.

Some trades might be 3 percent risk. Some 5 percent. Some 6 to 8 percent depending on the setup.

I’ll even go up to 10 percent and adjust position size, but I prefer tighter risk when the setup allows it.

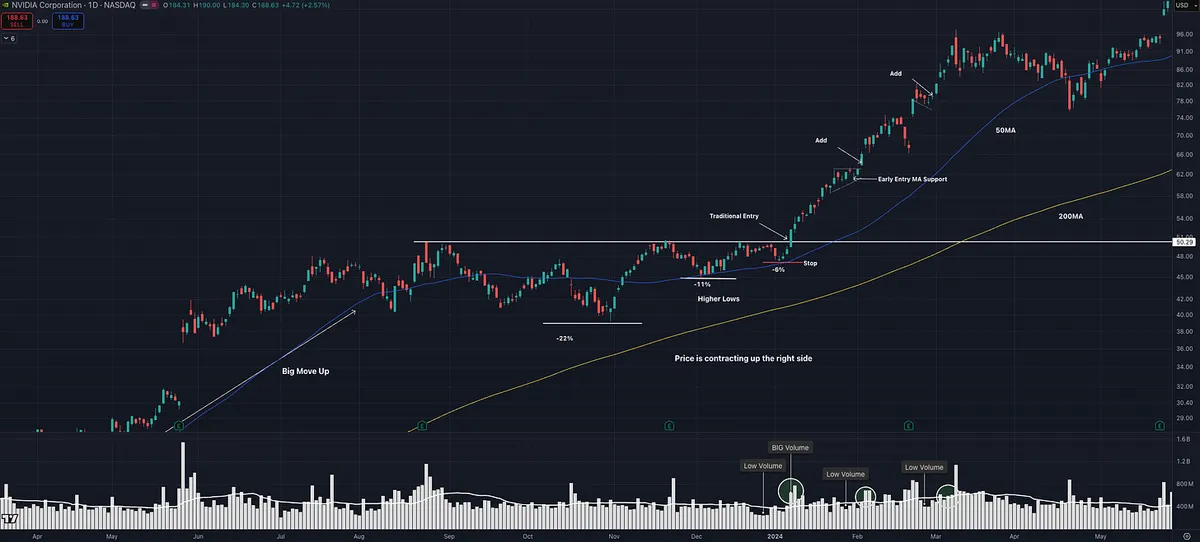
Another good example is NVDA in 2024. I had about 6 percent risk. Someone else could have taken the same trade and used the breakout day opening range low as a stop and risked closer to 1.82 percent and likely wouldn’t have been stopped out.

Like David Ryan often emphasizes, the best trades tend to be hard to buy, work right away, and don’t look back.

The principle stays the same.

Keep losses small. Don’t let one trade do real damage.

And at the end of the day, we all trade differently and that’s ok.

That’s what makes a market.

Different styles can still make money.

View on Substack ↗

The Simple Screener That Finds Momentum Breakout Stocks

One of the biggest questions traders ask is:

“How do you actually find these breakout stocks before they move?”

The answer is simpler than most people think.

You start by narrowing the market down to the strongest stocks already showing leadership.

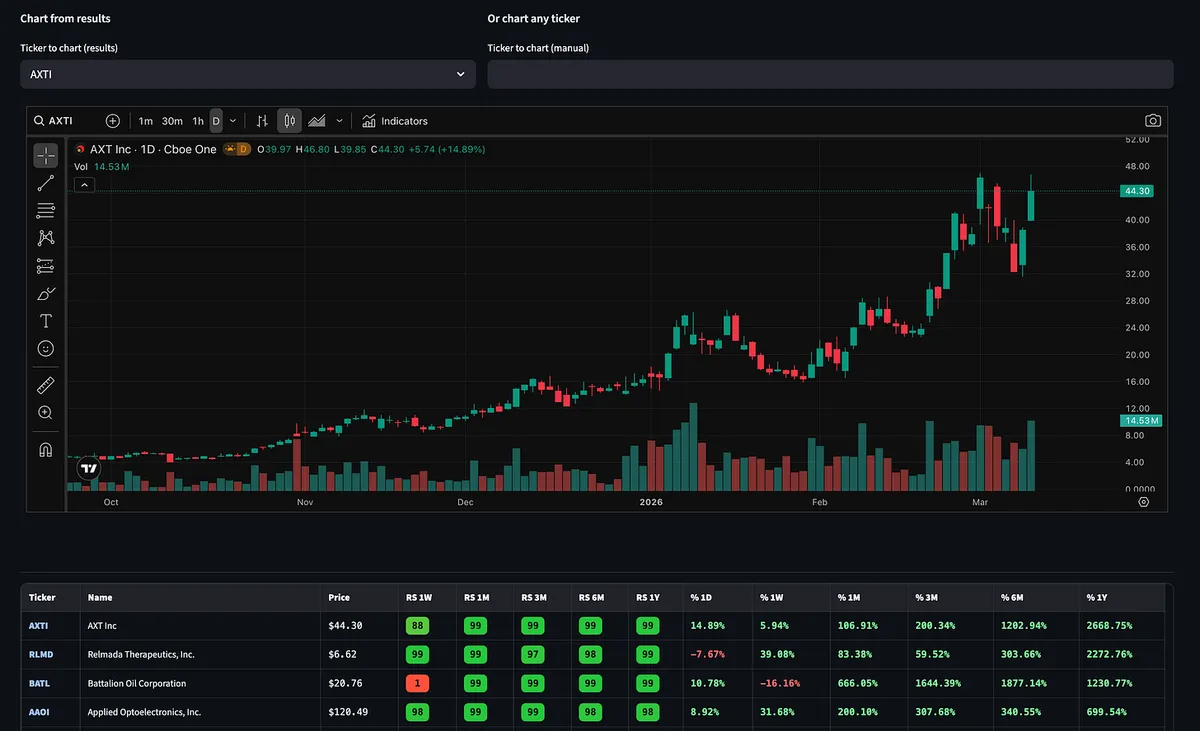
One of the fastest ways to do that is by using a Relative Strength Stock Screener.

This is the same basic idea used by momentum traders like Kristjan Kullamägi when searching for breakout setups.

The Simple Process

Use a relative strength screener and sort stocks by performance.

Move the rank by timeframe to 1 or 3 months, then set the filter to 98 or higher.

That shows you the top performing ~2% of stocks in the market.

Those are the names you want to study.

Why This Works

Because the biggest winners tend to behave in a very specific way.

As Kristjan explains:

“If you study thousands of the biggest winning stocks over the past 100 years they tend to move in stair steps. Meaning they will make a 20–50%+ move, pull back and go sideways for a while, then make another move.”

That stair-step behavior is where momentum traders find their edge.

A stock makes a strong move. Then it pulls back and consolidates. Then it breaks out again.

Those consolidations are where many of the best breakout setups form.

The key is focusing on stocks that are already proving themselves as leaders.

That’s why scanning for the top 1–2% performers is so powerful.

What to Look For Next

Once you identify leaders, start watching for technical setups such as:

• Tight consolidations

• Volatility contractions

• High tight flags or pennants

• Higher highs and higher lows

• Flat base breakouts

Other patterns that often appear in strong leaders:

• Ascending triangles

• Darvas boxes

• Wedges

• Parabolic curves

And always watch the volume behavior:

• Volume drying up during pullbacks or consolidations

• Heavy volume expansion on breakouts

This is one of the easiest ways to build a watchlist of potential momentum leaders before they make their next move.

In fact, this exact process is how I spotted LITE before it went on to move over 100%.

For Paid Subscribers

For those inside the paid subscription, you already have access to the Relative Strength Screener tool that automatically filters for these types of stocks.

It’s one of the simplest ways to quickly narrow thousands of stocks down to a handful of high-probability breakout candidates, the same type of setups momentum traders like Qullamaggie focus on.

If you're more CANSLIM / position trader focused, you can slightly loosen the relative strength filter and add Sales and Earnings growth to your screen.

Another option is to use the Super Performer preset in the screener, which combines several of those fundamental growth filters.

You’ll find the screener inside the Momentum Trading Strategy section for paid subscribers.

View on Substack ↗

“It’s extended.”

That’s what people say when they haven’t studied enough.

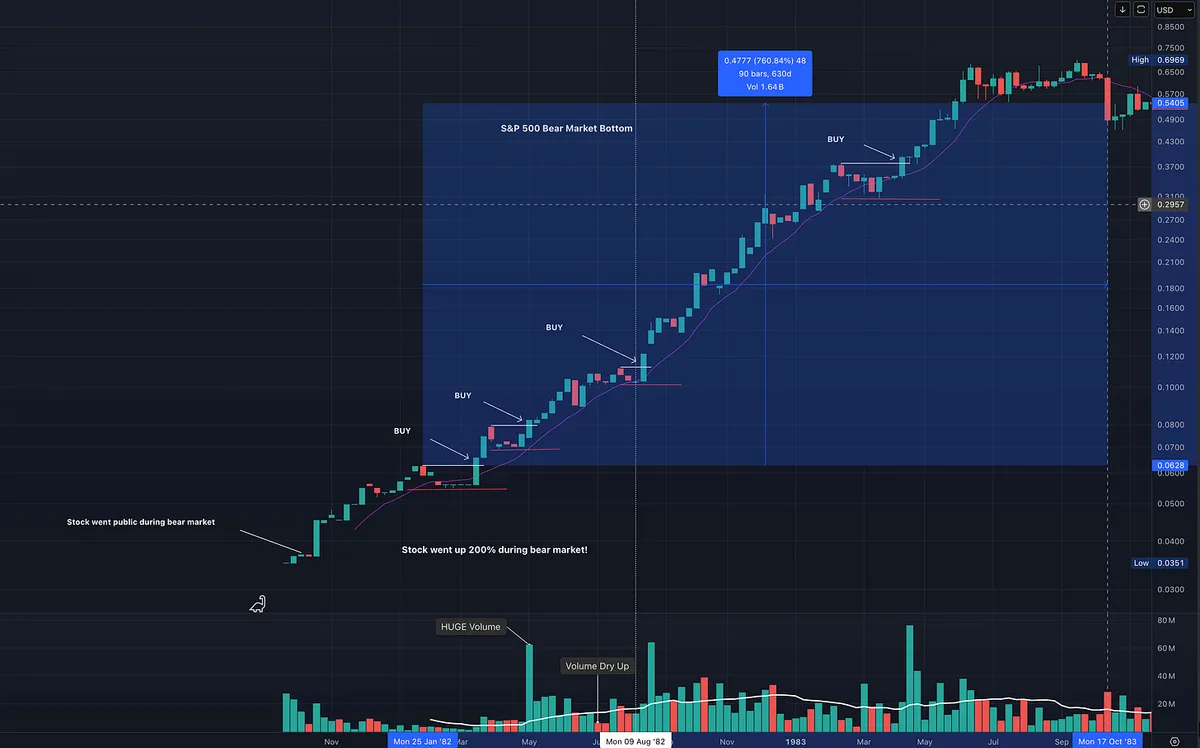
This chart, originally shown in How to Make Money in Stocks by William J. O’Neil , shows something important.

Yes, the stock is extended from what most would call a traditional base.

But Home Depot in the early 80s kept offering low risk, high reward entries inside a powerful Stage 2 uptrend.

Look at the areas marked BUY:

  • Tight consolidations

  • Volume contraction

  • Higher lows

  • Breakout through short resistance

  • Immediate continuation

That is not chasing.

That is entering strength with defined risk.

You do not always need:

  • A cup with handle

  • A massive reset

  • A 30 percent correction

Big institutional leaders often stair step higher.

They build tight flags. They pause. They break out. They continue.

If the stock is trending above a rising moving average, If price is contracting, If volume dries up before expansion,

That is opportunity.

This is not FOMO into a straight up name. We are still being patient. We are still waiting for tight pullbacks inside strength.

It looks very similar to some of the biggest winners we have had recently.

How many could have stepped into MU, LITE, or AVGO using similar entry tactics?

Study that difference.

View on Substack ↗

From RS Screener to Weekly Paid Newsletter to 55% Gain

We have been talking about buying pullbacks and upside reversals.

LITE just gave a textbook one.

What is interesting is how it first came onto our radar.

It showed up on our relative strength screener weeks before the breakout, while it was still setting up.

  • Top tier relative strength.

  • Strong on multiple timeframes.

  • Fund ownership accelerating.

  • Big earnings. Big sales.

You would have missed it on the MarketSurge O’Neil scan, which highlights the importance of casting a wider net. That is what I do when using the relative strength screener. First I scan for strength, then I dive into the chart and the fundamentals.

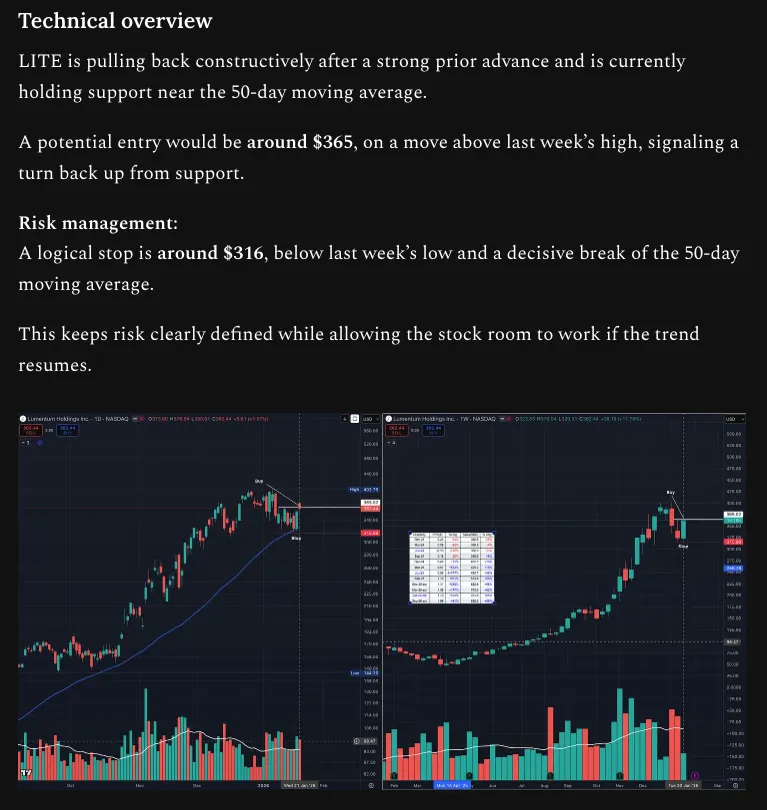
When we walked through this setup with paid subscribers, it was pulling back constructively after a strong advance and sitting near the 50 day moving average.

The plan was simple.

Entry around $365 on a move above the prior week’s high. Stop below the weekly low. We were also looking for follow through at the breakout level around $400.

We defined our risk, like we do with every trade.

No guessing.

Now it is up 55 percent from that area.

Here is the important part.

I am not some guru. I did not know LITE would be a winner. It simply met the criteria of big winners. Plenty of stocks meet the criteria and fail. When they do, I take a small loss.

But when a stock with elite relative strength sets up technically, offering a low risk, high reward opportunity, combined with strong CANSLIM type fundamentals, those are the kinds of names that can become major winners. You take them.

One stock like this can cover multiple failed attempts.

That is why we scan for strength.

Look for low risk, high reward technical setups.

Align with big sales, big earnings, accelerating fund ownership, and a bull market theme.

This is why we focus on process.

And that process produces the results.

View on Substack ↗

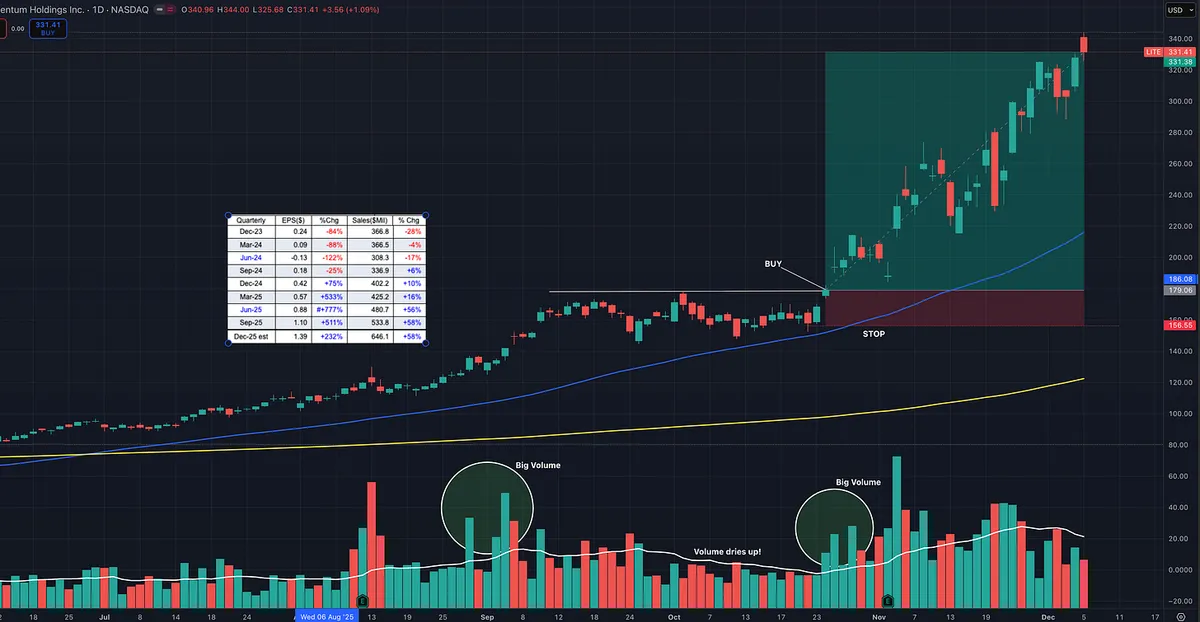
Great example of volume and price analysis with LITE.

LITE was easily spotted on scanners for its Relative Strength performance (RS 99), huge earnings and sales acceleration, and its position in a leading sector and theme. This is exactly what real leadership looks like from a top industry group in telecom and fiber optics.

The setup was a flat base breakout after tight consolidation. Big volume came in on the first move up, followed by controlled consolidation where volume dried up, and then another surge of big volume on the breakout.

The combination of strong fundamentals, clean technical price action, increasing fund ownership, and leadership within its sector created a high quality risk and reward opportunity.