Momentum Trading Strategy

Notes

Chart Setups & Entries

When and where to buy a stock you have already found: chart patterns, buy points and entry tactics.

Showing 1–12 of 12 notes

$SNDK ×
View on Substack ↗

Missed the Breakout? Learn to Buy the Pullback.

A stock moving beyond its base breakout doesn’t mean you’ve missed every opportunity to get involved. But if you want to participate in the next leg higher, you need to learn how to recognize and buy constructive pullbacks.

You also need to understand which entries the market is rewarding.

Just as we study the market environment, we should study how leading stocks are behaving.

Are breakouts to new highs following through? Or are better opportunities appearing earlier, as stocks find support and begin turning higher?

If you’re always waiting for a new high before entering, pay attention to how much of the move has already happened by the time you buy.

Buying pullbacks has been critical for me over the last few years. It has helped me get involved in several of my biggest winners. LITE and SNDK.

The key is recognizing a pullback within an established uptrend, watching for evidence of support, and identifying an entry where you can clearly define your risk.

Study more than which stocks are working. Study which entries are working.

That can make a meaningful difference in both the opportunities you recognize and the risk you take.

View on Substack ↗

The Best Setups Often Look the Scariest

Some of the strongest stocks will look expensive by the time you notice them.

That doesn’t automatically make them bad trades.

I want stocks showing relative strength. A strong advance gets my attention, then I look for a proper setup where I can define my entry and risk.

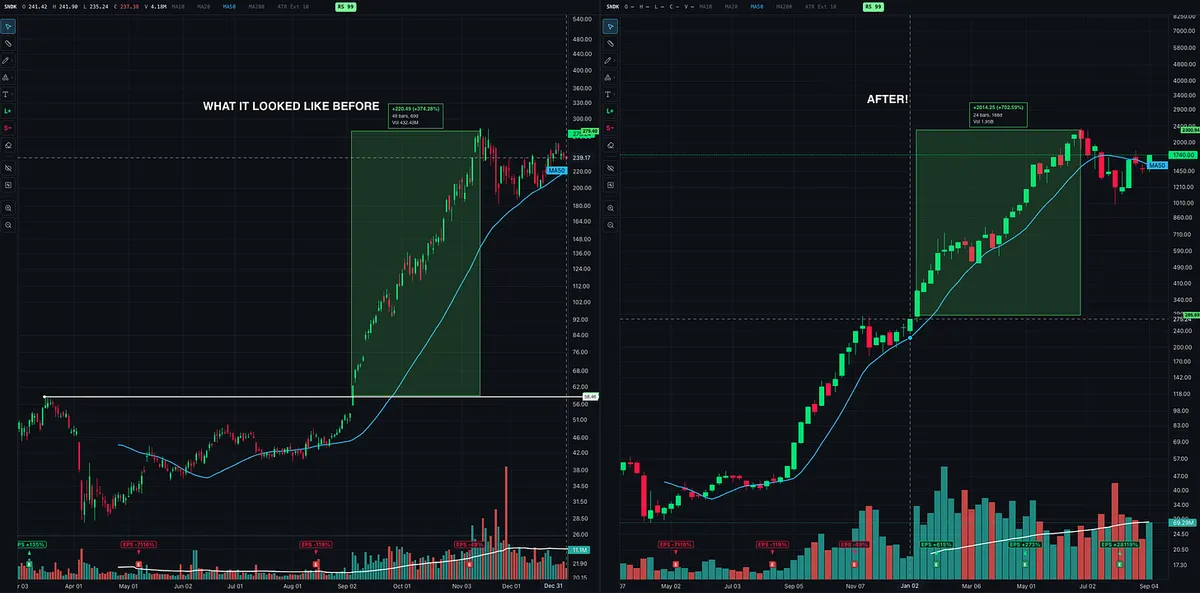
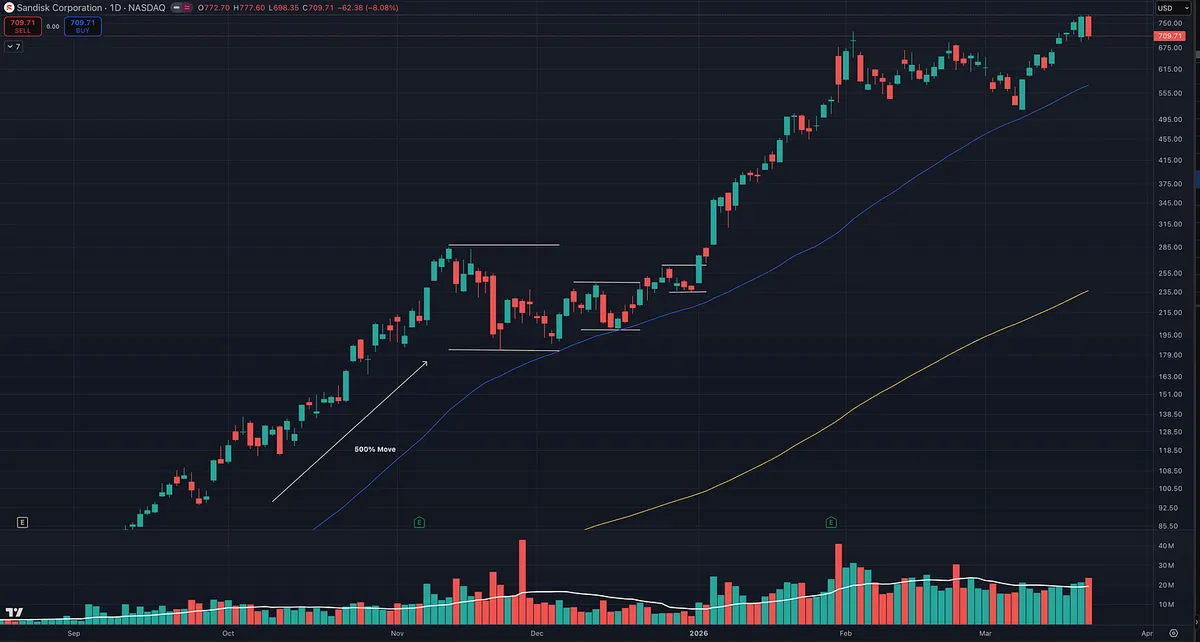
Look at SNDK. The first highlighted advance was roughly 374%. It then consolidated, and the next marked advance was roughly 703% to the later peak.

If I dismissed it because it had “already gone up too much,” I would have stopped looking before the next setup developed.

The trap is letting the price you could have paid months ago determine whether today’s opportunity deserves consideration.

A strong stock still needs a proper entry, a logical stop, and a position size that fits the risk. Its earlier advance doesn’t replace any of that.

Don’t confuse discomfort with danger. Judge the setup in front of you, not the price you wish you had paid.

View on Substack ↗

Stocks Like SNDK Are Nothing New

Over the last year, I’ve heard people talk about massive winners like SNDK as though these moves are something unique to modern markets. Open William O’Neil’s How to Make Money in Stocks and study the historical charts. You’ll find stock after stock, across more than a century, that looks remarkably similar to the leaders we see today.

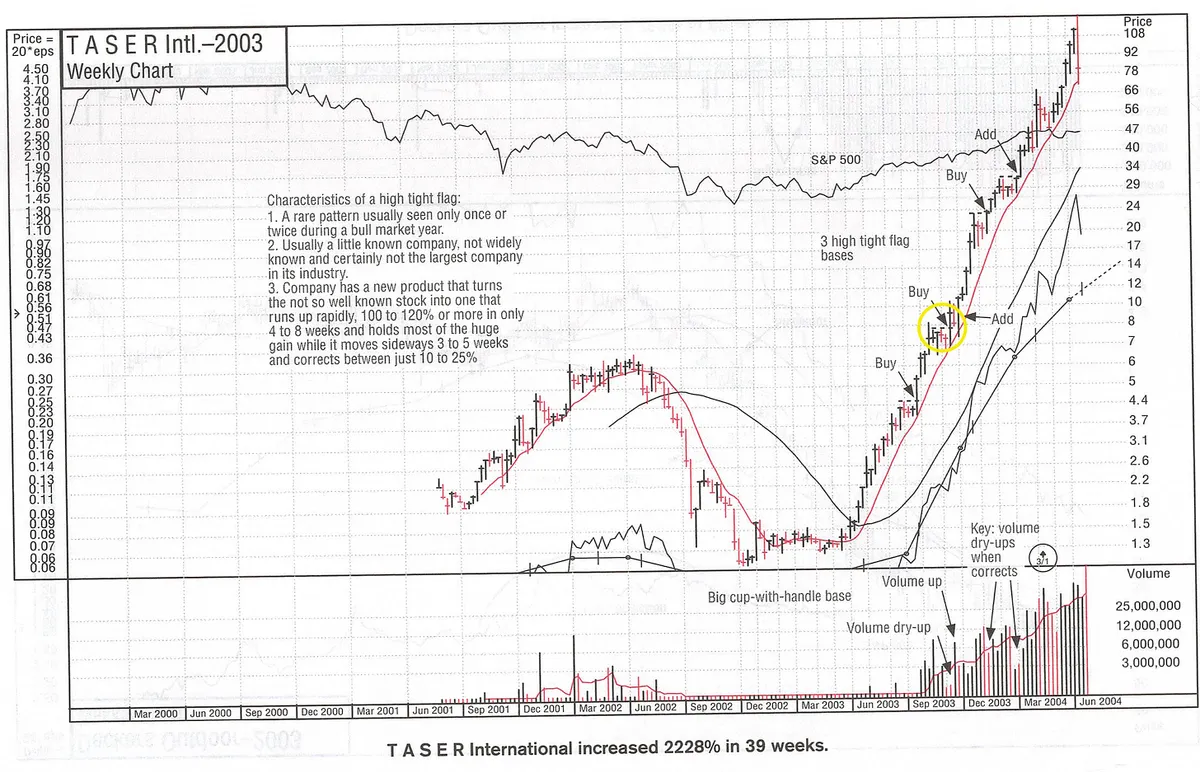
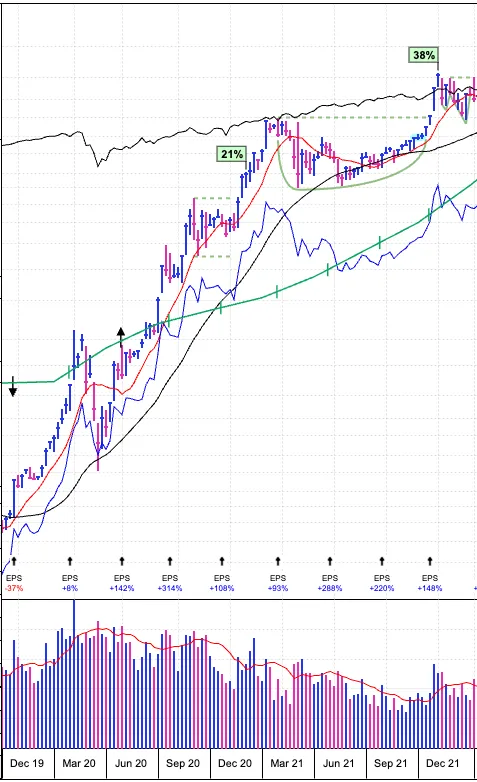
Look at TASER in 2003. O’Neil’s chart identifies three high tight flag bases during an advance that ultimately produced a 2,228% gain in 39 weeks. Notice the buy and add points as the stock keeps moving into new highs.

I’ve shared and discussed many stocks with similar patterns over the last couple of years, and the response is often the same: “It looks too extended.” But a stock having already made a huge move doesn’t automatically mean its next setup is unbuyable. I think some traders are missing what bull flags and pennants actually look like, and how tight consolidations or pullbacks can provide opportunities to enter and manage risk. They let fear or memories of past failed trades keep them from taking the next valid setup, potentially missing a huge opportunity.

If you call yourself a growth stock investor or momentum trader, study the biggest winning stocks in history. Buying strength and new highs is central to this discipline. We look for powerful stocks forming valid setups, and we use sell rules to cut losses when we’re wrong and protect gains as trends break down.

History gives us the confidence to buy strength. Discipline helps us manage the risk.

View on Substack ↗

When Low Short-Term Relative Strength Is Actually Bullish (Most Traders Get This Wrong)

A lot of traders misunderstand what they’re seeing when they sort stocks by Relative Strength.

When a stock is ripping higher, you’ll usually see strong RS across nearly every timeframe: 1-year, 6-month, 3-month, 1-month, even 1-week.

But that’s also usually when everyone starts saying:

“It’s too extended.”

The more interesting opportunity can appear when a major leader finally starts to consolidate.

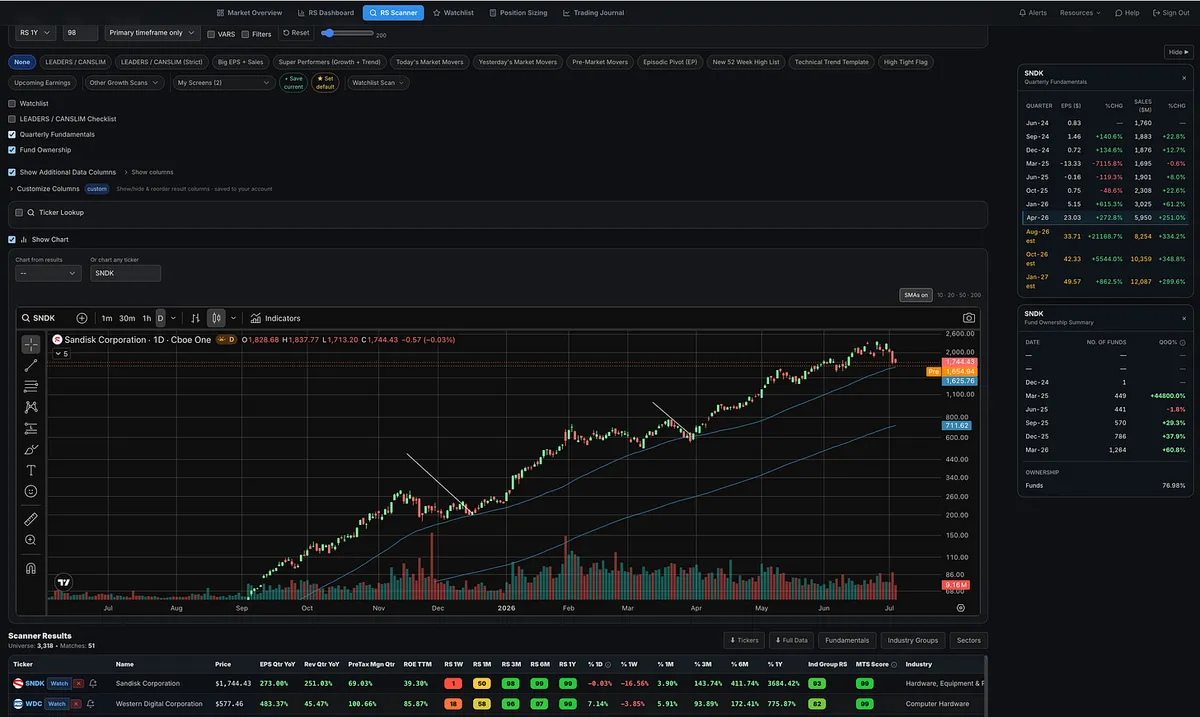
In this SNDK example, the stock still had elite longer-term Relative Strength, but its shorter-term RS started falling as price consolidated, found support, volume dried up, and higher lows began forming.

At first glance, that weaker short-term RS might look bearish.

But in the right context, it can be exactly the opposite.

It can be telling you that a powerful leader has finally stopped running long enough to build another potential buying opportunity.

That’s the part many traders miss.

But there’s a catch.

The exact same RS relationship can also appear when a former leader is actually breaking down.

If price loses important moving averages, fails to reclaim them, starts making lower lows, and the overall chart deteriorates, then falling short-term RS may be confirming that the stock’s leadership is ending.

Same Relative Strength readings. Completely different message.

That’s why I never use Relative Strength in isolation.

A screener can help me find the stock.

Price, volume, trend, and the chart tell me what the RS actually means.

This clip comes from a longer video where I walk through some of the exact stock screens I personally use inside MTS Velocity, including how I combine different Relative Strength timeframes, fundamentals, volume, trend, and market context to narrow thousands of stocks down to the names I actually want to study.

The full video and MTS Velocity Stock Screener are available to all paid subscribers.

Watch the video on Substack →
View on Substack ↗

This Is One of My Favorite Price Patterns to Watch

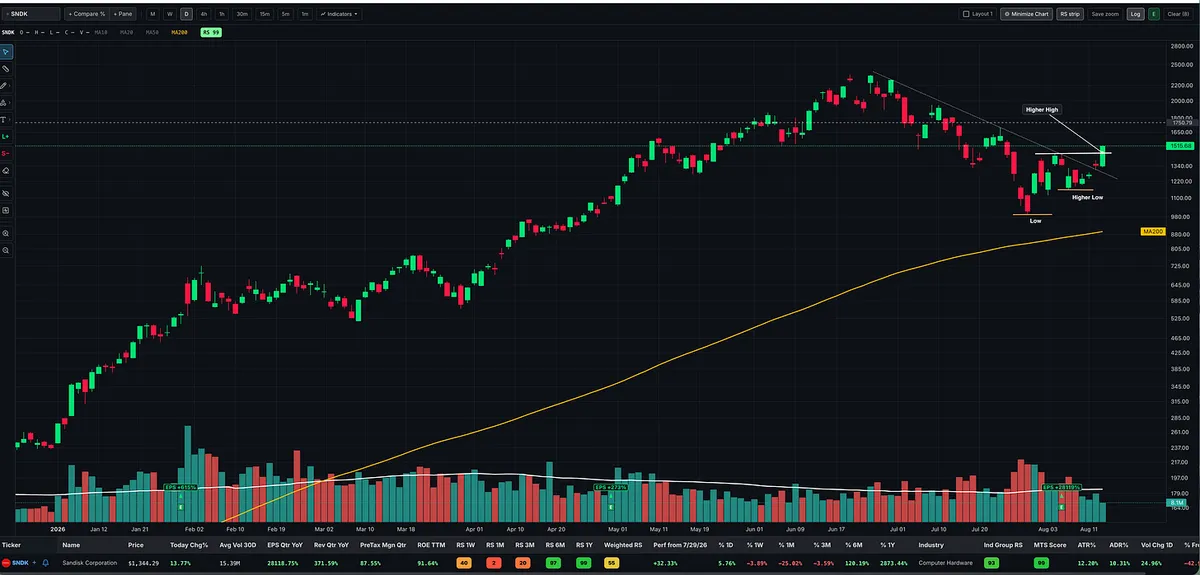
SNDK is showing up near the top of today’s market mover scan.

Big earnings growth. Big sales growth. Strong relative strength. And now the price action is starting to get interesting.

Look at the chart.

SNDK put in a low, rallied, pulled back without making a new low, and formed a higher low.

Today it pushed above the August 4 swing high, giving us the next higher high.

Higher low → Higher high.

This is one of my favorite patterns to watch because I’m not trying to guess the exact bottom. I want price to start showing me evidence that the trend may be changing.

There are still plenty of reasons to remain patient.

The stock is still below its 50-day moving average, and I would like to see more volume coming into the advance.

And this stock has a lot of work left to do.

From around current prices, SNDK would still need to climb more than 50% just to get back to its June highs.

So I’m not saying the stock is suddenly fixed or that it has to go back to the highs.

I’m simply saying:

This is the type of price action that gets my attention.

Strong fundamentals get the stock on my radar.

Price has to earn the trade.

View on Substack ↗

SNDK Loves the 50-Day

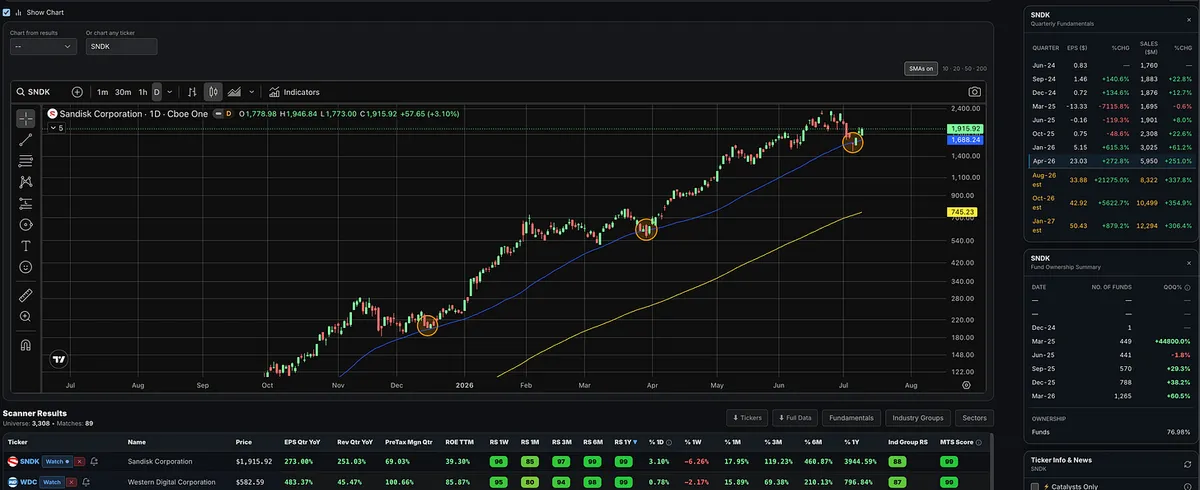
SNDK has repeatedly found support around the rising 50-day moving average throughout this massive run.

It happened in December 2025.

It happened again in late March as the market bottomed.

And now, SNDK has done it again, briefly undercutting the 50-day before reversing sharply and closing near the top of the day’s range.

We will see if the trend continues.

“The trend is your friend until the end when it bends.”

-Ed Seykota

View on Substack ↗

Is a 5% Stop Too Tight in Today’s Market?

I got a great comment recently:

“It’s just that -5% is not much in today’s markets. Not enough not to get whipsawed. What’s your view?”

Here’s my answer.

I disagree.

There are still plenty of setups where you can risk 5 percent or less.

If that wasn’t the case, traders like Kristjan Kullamägi wouldn’t be as successful as they are.

Same with Mark Minervini. He won the U.S. Investing Championship in 2021. He’s still finding tight entries in today’s market.

It comes down to tactics and timing.

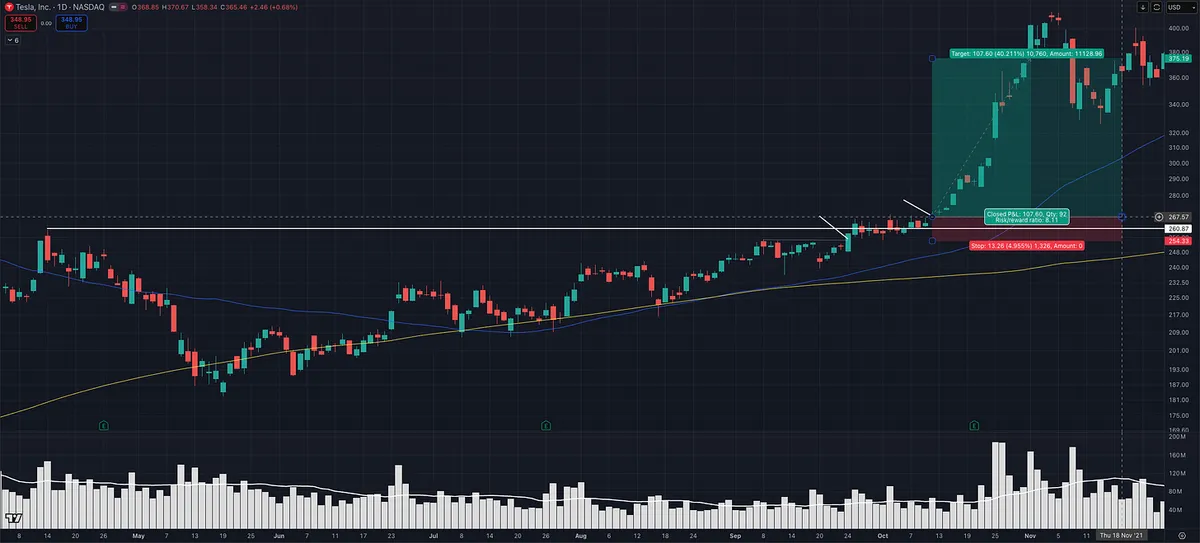
This TSLA example is a good illustration.

On the right side of the base, price was tightening and structure was clean. That created multiple opportunities where risk could be kept at 5 percent or less.

Recently (2025-2026), with many of the big winners already extended in Stage 2 uptrends, it’s a different environment.

If you’re only buying standard breakouts here, then yes, your stop likely needs to be 7 to 10 percent.

But that’s just one way to play it.

A lot of the big winners from 2025 to now in areas like computer data storage and telecom, names like LITE, SNDK, MU, CIEN, WDC, were harder to trade with tight risk using traditional breakout entries.

Their ADR% was higher, and there was less contraction into the pivot, so traders had to adapt.

Pullback entries. Low cheats. Intraday entries like ORB.

Those allow you to define risk much tighter and still participate without getting shaken out.

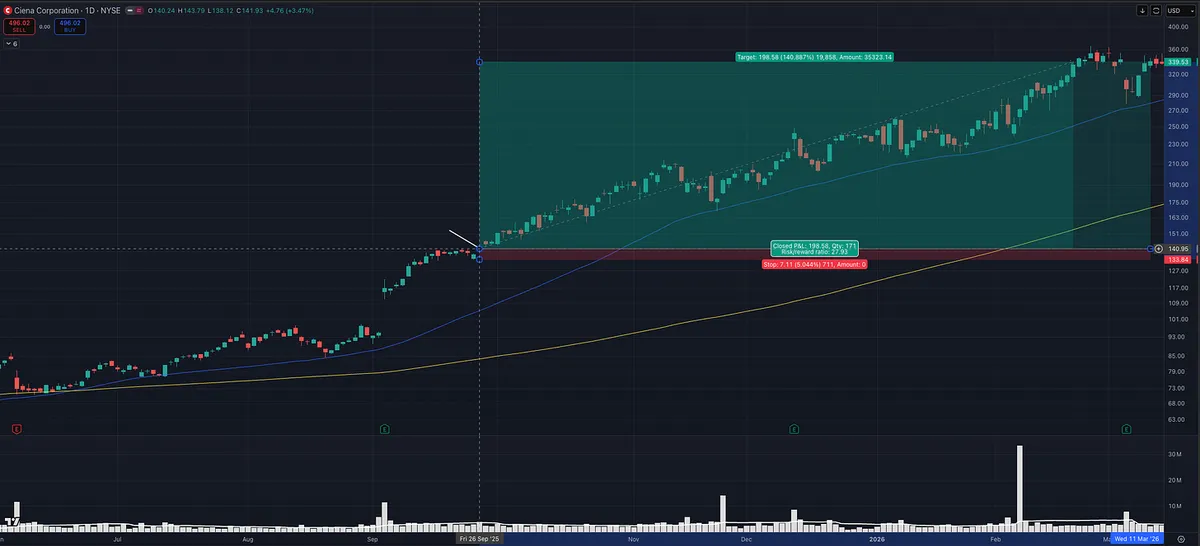
CIEN is another good example.

After an episodic pivot on earnings, price ran, then tightened sideways. That created a clean opportunity to enter with defined, tight risk.

This isn’t about forcing a fixed 5 percent stop on every trade.

It’s about finding entries with proven setups where tight risk actually makes sense.

Timeframe matters. Setup matters. Execution matters.

And just like Minervini, I’m not rigid with it.

Some trades might be 3 percent risk. Some 5 percent. Some 6 to 8 percent depending on the setup.

I’ll even go up to 10 percent and adjust position size, but I prefer tighter risk when the setup allows it.

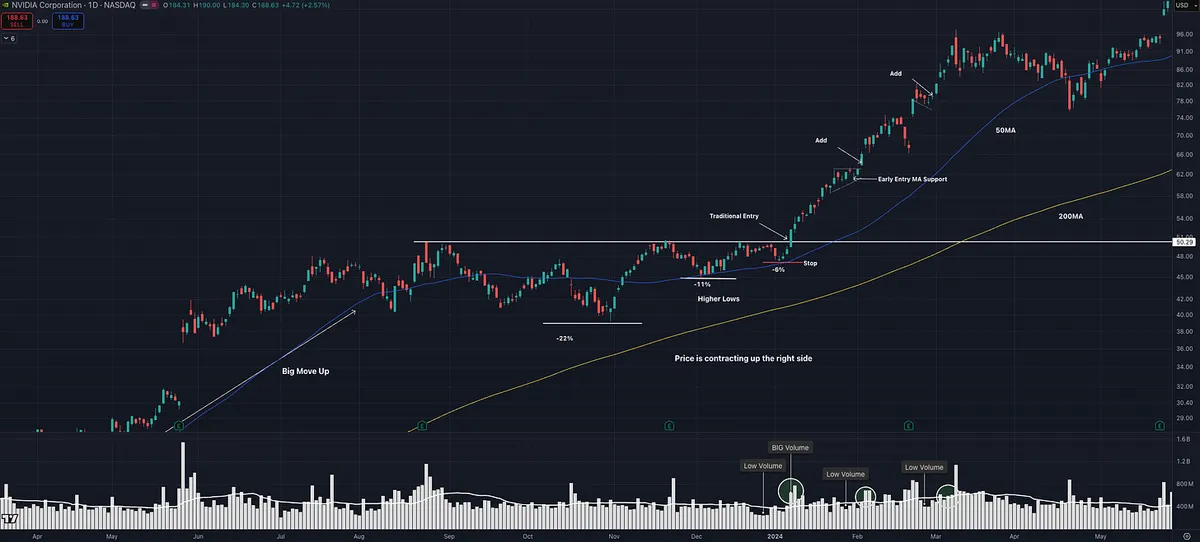
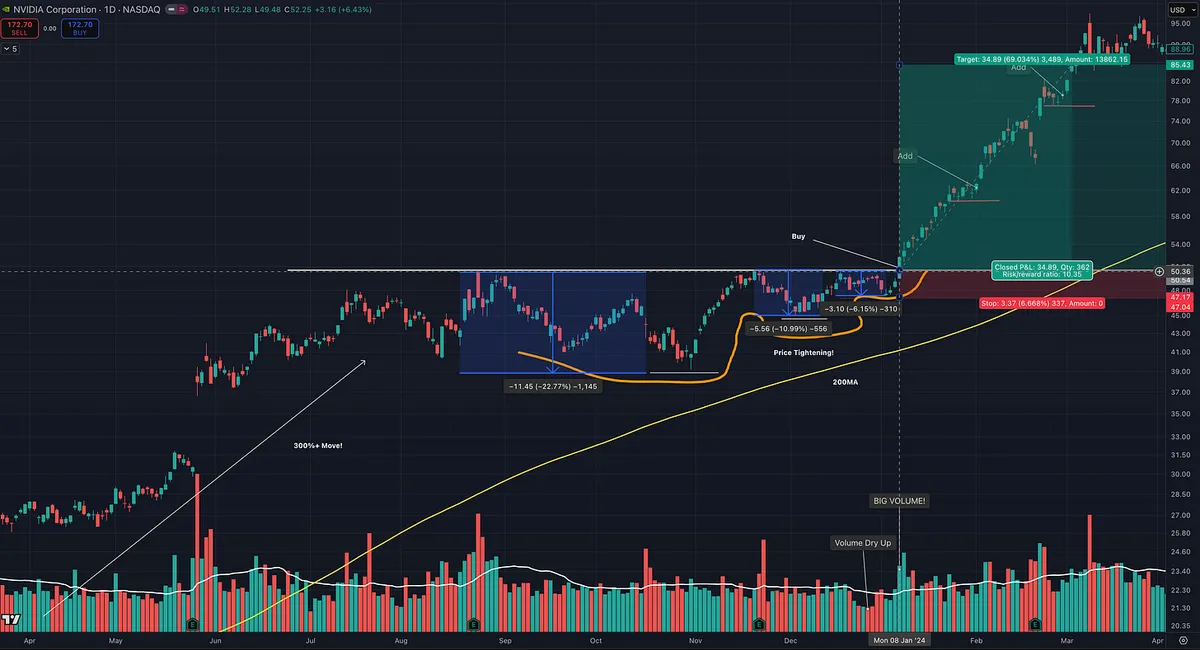
Another good example is NVDA in 2024. I had about 6 percent risk. Someone else could have taken the same trade and used the breakout day opening range low as a stop and risked closer to 1.82 percent and likely wouldn’t have been stopped out.

Like David Ryan often emphasizes, the best trades tend to be hard to buy, work right away, and don’t look back.

The principle stays the same.

Keep losses small. Don’t let one trade do real damage.

And at the end of the day, we all trade differently and that’s ok.

That’s what makes a market.

Different styles can still make money.

View on Substack ↗

Why You Can’t Find VCPs Right Now (And Why That’s Not a Problem)

Received a great question today about VCPs that I think a lot of traders are struggling with right now.

They mentioned how hard it has been to actually find clean VCP setups, even after studying charts and screening for them.

This is a great question, and honestly what you’re experiencing is completely normal.

The first thing to understand is that most VCPs are not going to look like the textbook examples. The clean, perfectly staged contractions that many show are the exception, not the rule.

Minervini is not teaching you to find a perfect pattern. He is teaching you to recognize behavior.

What you are really looking for is:

  • volatility contraction over time

  • tighter price action

  • controlled pullbacks instead of sharp selloffs

  • volume drying up into the pivot

  • price tightening up the right side of the chart

Those things can show up in many different ways, and often they are subtle.

The second part of this is the environment.

Right now, it is harder to find clean setups. That is not a coincidence.

The best looking VCPs tend to show up earlier in a bull cycle when institutions are aggressively building positions and leadership is expanding. As the market matures, stocks become more extended, price action gets looser, and breakouts become less reliable.

So when you are scanning and thinking “these don’t look like the examples,” that is actually information.

It is telling you that either:

  • the setup is not truly there

  • or the environment is not ideal for it

A good way to think about it is this:

You are not trying to find a perfect VCP. You are trying to identify when supply is being absorbed before a potential expansion move.

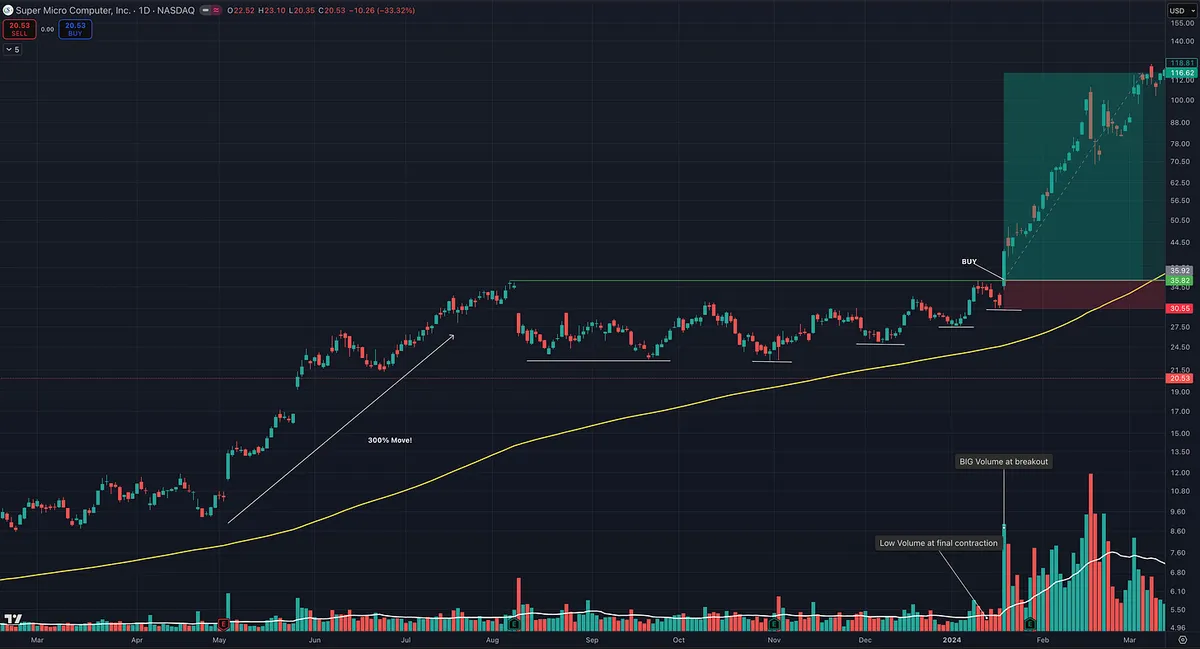
Sometimes that will look very clean like NVDA earlier in 2024 or slightly less perfect like SMCI. Other times it will look much messier, like SNDK in 2025, and require more experience to recognize.

If you are struggling to find them right now, that might not be a skill issue. It is very likely a reflection of the current market conditions.

Over time, you will get better at spotting these. It comes from screen time and reviewing charts over and over. What looks unclear now will start to stand out much more with experience.

Also, you do not need to master every setup to be successful. Some traders naturally see certain patterns better than others.

For example, you might find that:

  • cup with handle setups stand out more to you

  • or flat base breakouts are easier to recognize

That is completely fine.

The goal is not to trade every setup. The goal is to find the ones you can consistently recognize and execute well, and focus on those.

View on Substack ↗

How to Buy Pullbacks in Strong Stocks (SNDK Example)

If you're a swing trader, one of the highest probability opportunities is buying pullbacks in leading stocks.

A good example right now is SNDK.

Over the past year SNDK has been a huge winner and it sits inside a very strong industry group: Computer Data Storage. When leadership groups are hot, the best strategy is usually simple.

Don’t argue with the trend. Trade with it.

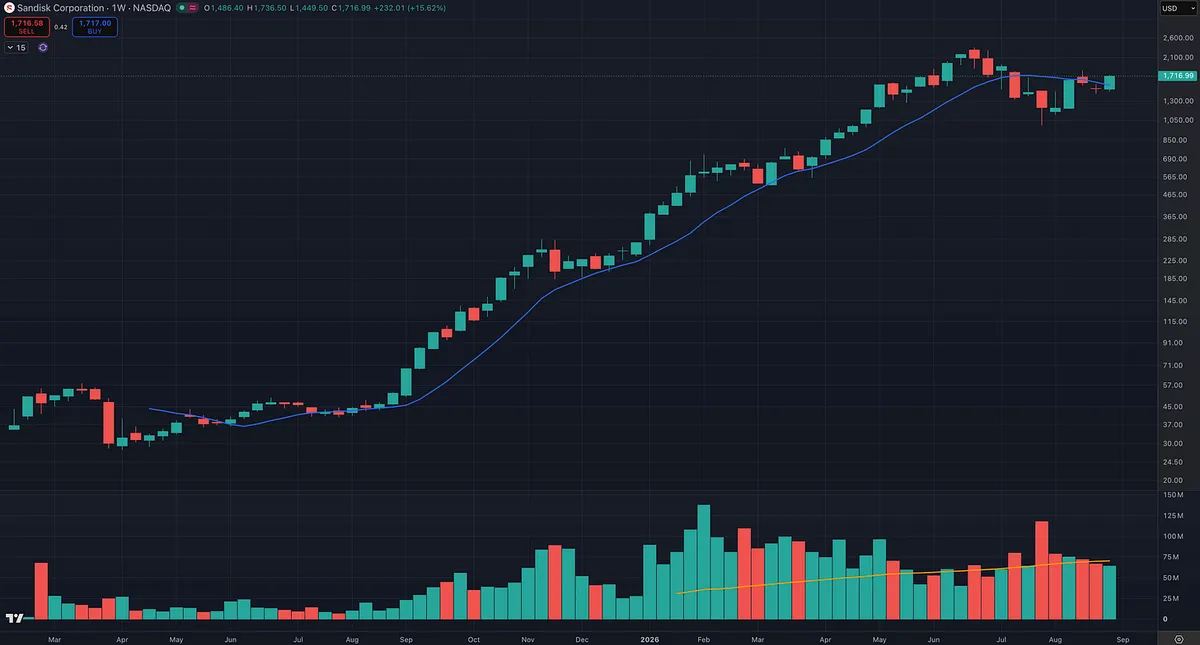
Looking at the weekly chart, price has repeatedly respected the 10-week moving average, pulling back to support and then continuing higher. When a stock behaves like this, the playbook becomes straightforward:

Wait for the pullback.

Wait for support.

Then look for an entry trigger.

That’s exactly what happened here.

Before the open we saw the overall market approaching the 200-day moving average in futures. When the market found support at that level, strong stocks started to respond.

At the same time SNDK was sitting right on its 10-week support area.

That created the setup.

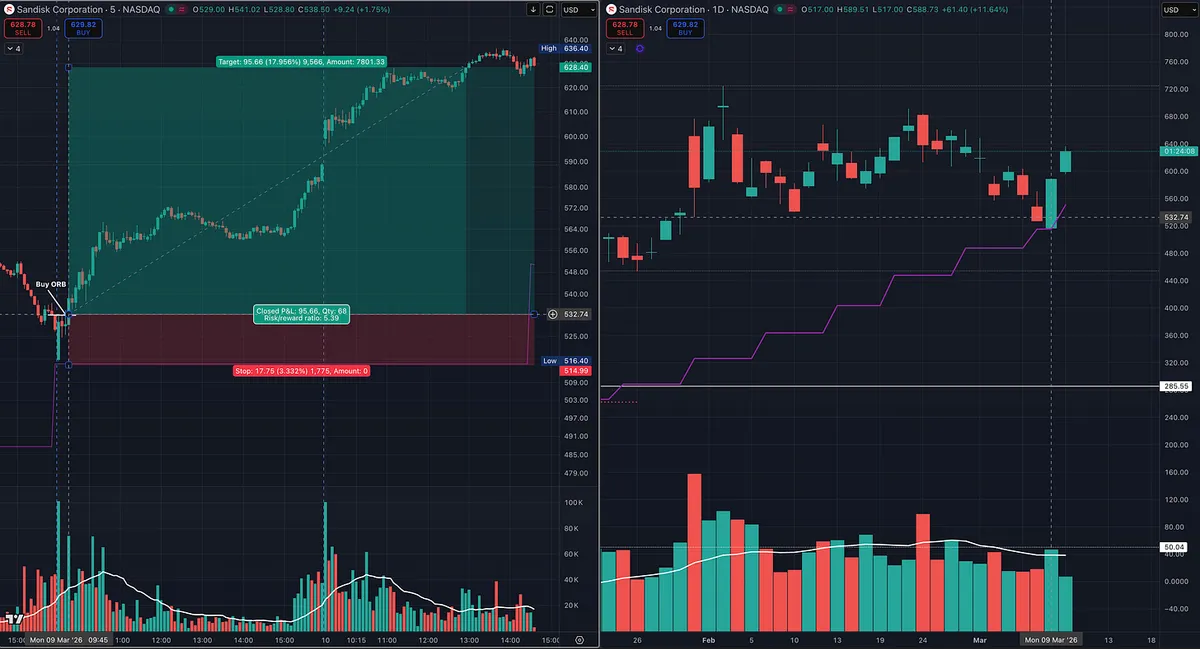
Instead of guessing, we waited for a tactical entry using an Opening Range Breakout, a strategy popularized by traders like Quallamaggie and Dan Zanger.

The trade was simple:

• Entry: Opening range breakout

• Risk: stop at opening range low ~3%

• Current move: ~18%

That’s roughly 5x the initial risk.

When you get a move like that, you now have choices.

You can:

• Take partial profits into strength

• Move stops higher

• Let the remaining position run

One approach is to sell some shares into strength and let the rest ride, effectively financing the remainder of the trade.

Another important lesson from this example is multi-timeframe analysis.

The weekly and daily charts provide the setup. The daily and intraday charts provide the execution.

This allows you to combine institutional trend structure with tactical entries, which is where many swing traders gain their edge.

And remember something important.

This is not a random small cap or pump-and-dump stock.

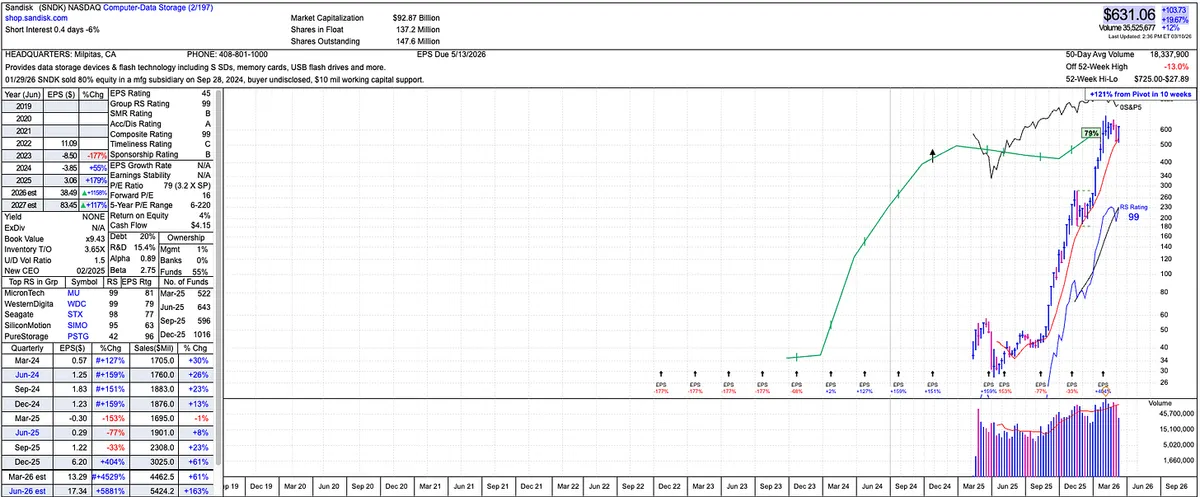
SNDK is a true growth name with strong fundamentals and massive forward estimates for earnings and sales growth. Just look at the earnings and sales on the chart!

When growth stocks in leading groups pull back to support, the goal isn’t to predict when the run will end.

It’s simply to take the setup while it works.

Because the truth is, the moment a hot sector pulls back, the commentary always starts:

“It’s extended.” “It’s overvalued.” “The run is over.”

Eventually that will be true.

But guessing when that happens costs traders enormous opportunity.

I was telling our members in the Substack Chat to keep an eye on SNDK and this is exactly why.

With setups like this we can be wrong 70% of the time and still come out ahead.

Instead, a better approach is simple:

Keep taking the setups until they stop working.

View on Substack ↗

Study This Chart. This Is Leadership.

One area that has quietly dominated since the April correction is data storage, a key part of the broader AI theme.

SNDK is a great example.

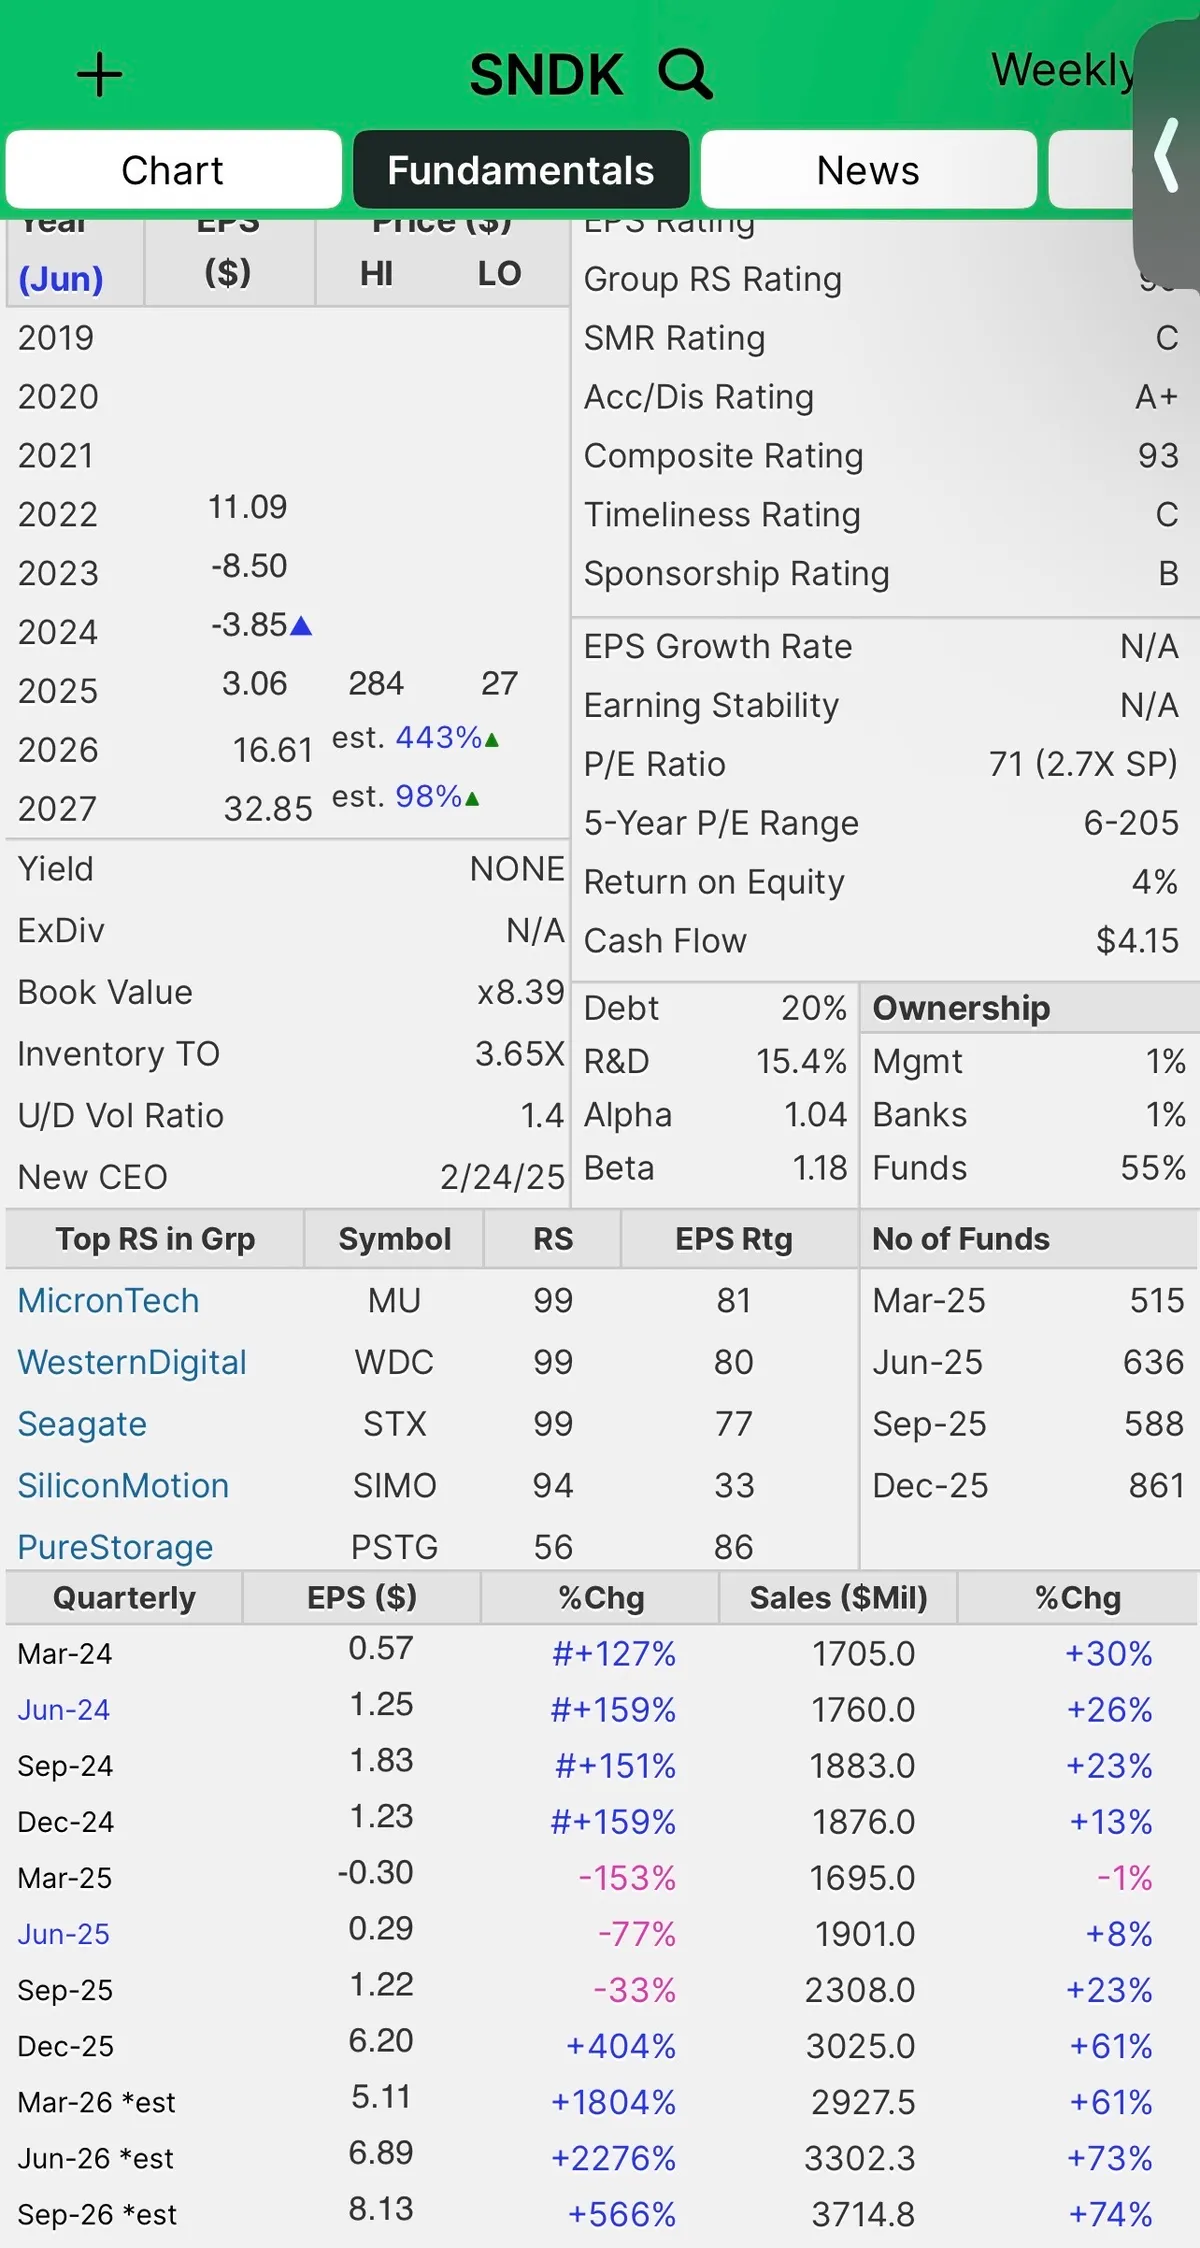
The fundamentals are there.

High relative strength.

Earnings and sales acceleration.

Rapid increase in fund ownership.

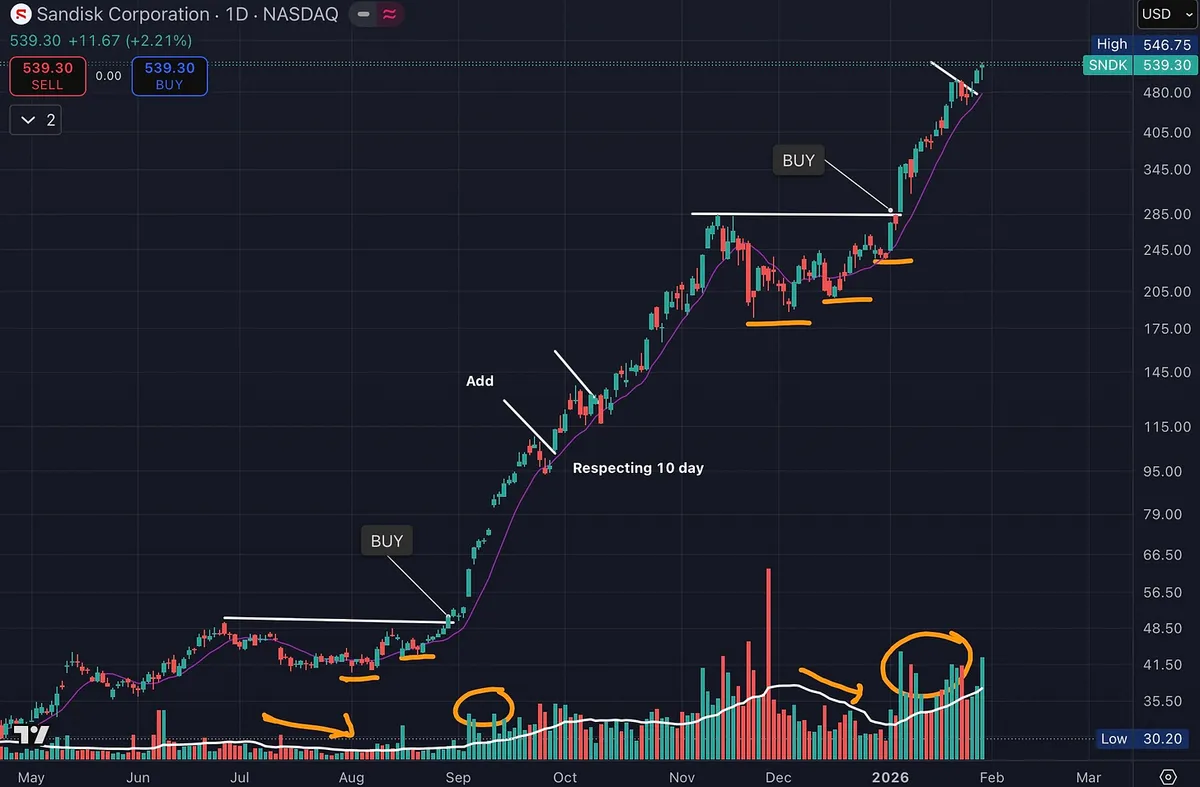
But the real lesson is in the chart.

Price exploded higher on heavy volume. That’s institutional demand showing its hand.

Then price paused.

Volume dried up during consolidation. Pullbacks stayed shallow. The right side tightened up. Sellers stepped aside.

Price respected the 10-day moving average with a smooth, orderly advance. No volatility. No panic. Just controlled strength.

Then it did it again.

Another tight consolidation.

Another dry-up in volume.

Another expansion higher on strong volume.

This is textbook supply and demand in action.

Strong stocks don’t give back much. They move up, rest, absorb supply, and continue higher. That’s exactly what’s happening here.

And this wasn’t a one-off.

The category gave it away. Other data storage names were acting the same way. When multiple leaders in a group show identical behavior, pay attention.

This is the kind of chart that should be studied over and over.

Not because it’s perfect.

But because it clearly shows where risk is defined and why big trends are built the way they are.

Charts like this are how you learn to recognize real leadership.

Study this.

View on Substack ↗

This Is What Institutional Accumulation Looks Like

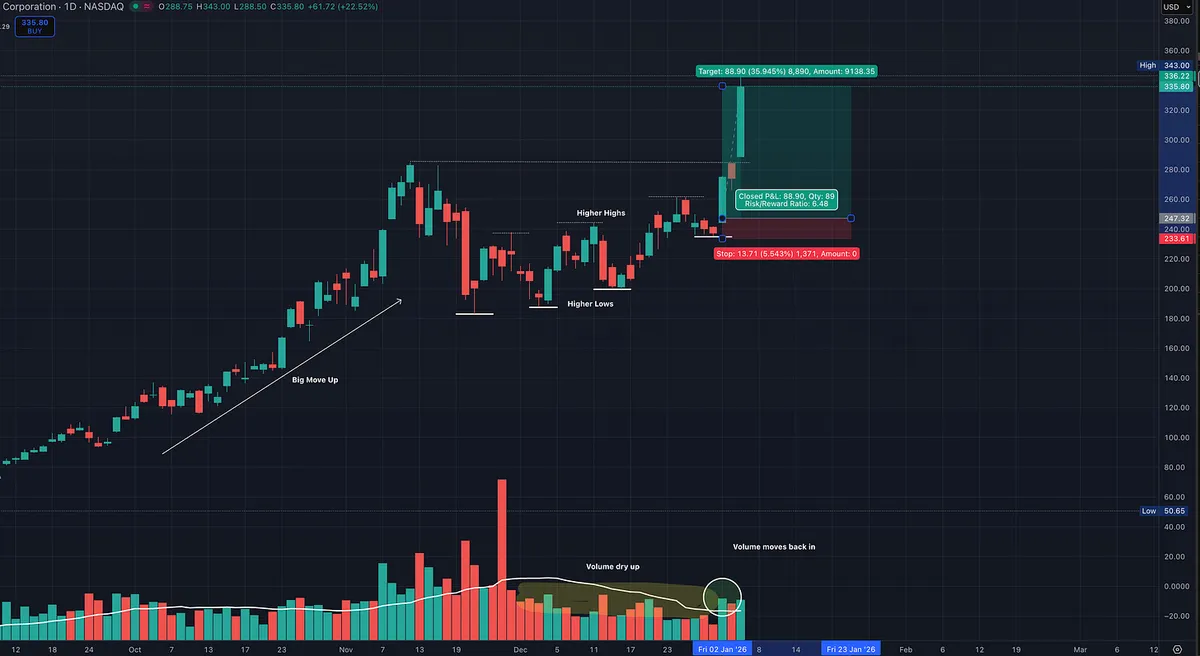
Here is a great example of a true leader digesting a major advance. Volume dries up as price tightens, forming higher lows and higher highs. Selling pressure fades while the structure strengthens.

As volume begins to move back in, demand returns ahead of the next powerful move higher.

SNDK also shows increasing fund ownership, confirming institutional accumulation. With a 99 Relative Strength rating, this is exactly the type of behavior you want to see in big winners before the next leg.