Momentum Trading Strategy

Notes

Finding Leading Stocks

What to buy: how to find, screen and rank the strongest stocks and industry groups.

Showing 1–20 of 299 notes

View on Substack ↗

The Stock Was Up 133%. Nobody Chose Buy. Here's What Happened Next.

First, thank you to everyone who participated in the chart challenge! Not a single person selected Buy. Most chose to wait or avoid the trade, and I understand why.

The stock had already rallied 133% in approximately four weeks. Surely it was too extended to buy, right?

Not necessarily.

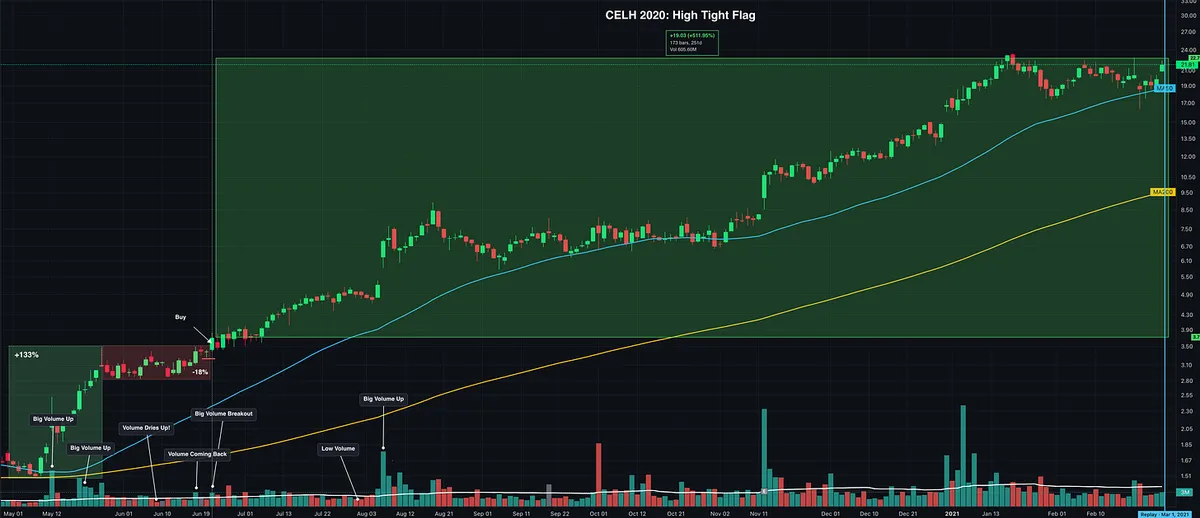
The stock was CELH, and what you were looking at was a High Tight Flag, a rare but powerful chart pattern documented by William O'Neil.

In How to Make Money in Stocks, O'Neil describes the characteristics:

  • Explosive advance: Generally 100% to 120% in just 4 to 8 weeks.

  • Consolidation: A sideways correction of roughly 10% to 25%, typically lasting 3 to 5 weeks.

  • Volume: Ideally, selling pressure diminishes during the consolidation, followed by renewed buying demand as price breaks out.

Notice what happened on the chart.

After that enormous advance, the stock stopped climbing and began consolidating. Price held relatively tight, volume quieted, and a new potential buy point developed.

The arrow marked the breakout above that consolidation.

The overall market was in a Stage 2 uptrend, and CELH belonged to a strong industry group. The broader conditions were supportive.

O'Neil documented examples of these formations dating back to 1915, including some of history's greatest stock market winners. He even bought Syntex from a High, Tight Flag in 1963 before its subsequent enormous advance.

But he also warned that these patterns are extremely risky and difficult to interpret correctly. A valid-looking setup can still fail.

The opportunity isn't simply buying a stock because it doubled. It's recognizing when that explosive advance produces a new, actionable setup with defined risk and potentially asymmetric reward.

If you didn't recognize it, no big deal. That's the whole point of studying historical winners and putting in the reps.

Go back through O'Neil's charts and study these formations. You'll start recognizing similarities in how exceptional stocks behave.

Now look at the second chart and see what happened next.

Here's the biggest takeaway:

Too many traders dismiss potentially exceptional setups simply because a stock has already made a massive advance. But a stock can double, consolidate, and offer an entirely new buying opportunity.

I've written a deeper article explaining this concept, but one of the best ways to train your eye is to study historical winners using Chart Bar Replay. Look at the charts BEFORE the breakout, make your own assessment, then advance the chart to see what happened next.

STOP thinking big moves = extended

START thinking extended = distance from the buy point
Quoting Momentum Trading StrategyThis Stock Just Rallied 133%. Would You Buy It HERE? No ticker. No dates. No hindsight. You're looking at this chart in real time. You have no idea what happens next. What's your move? A) Buy. I like what I see. B) Wait. I need more confirmation. C) Pass. It's too extended. A, B, or C? And WHY? I'll reveal the stock…
View on Substack ↗

Your Favorite Growth Stock May Have Already Grown Up

You watched it make other people rich.

Now you finally feel comfortable buying it.

But are you buying its next growth phase, or the reputation it earned during its last one?

That’s a trap William O’Neil discusses in How to Make Money in Stocks.

He describes a company with a strong three-year earnings growth record of 30%, whose recent quarterly growth has slowed to 10% or 15%. Its impressive history can disguise the fact that it’s behaving like a mature growth company.

The business may still be profitable. Earnings may still be great. But great earnings and accelerating earnings growth are different things.

A growth stock can deliver for years. The mistake is treating that label as permanent.

O’Neil also writes:

“Many growth leaders in one cycle do not repeat in the next cycle.”

Yet traders can act like generals preparing to fight the last war. We keep returning to familiar names because we remember what they did.

Meanwhile, the next generation of leaders may still feel unfamiliar, uncomfortable, or “too expensive.”

That doesn’t mean an older company can’t reaccelerate or lead again. It means it has to earn its place through current evidence.

Ask yourself:

  • Is earnings and sales growth strengthening or fading?

  • Is the stock showing leadership in its price and relative strength?

  • Am I buying because of what’s happening now, or because I remember what happened before?

Is your watchlist built around today’s leaders, or yesterday’s memories?

View on Substack ↗

Not Every Soaring Stock Is a Growth Stock

A stock breaks out. Sales surge. Earnings jump triple digits. It starts appearing on your growth screens.

But what’s actually driving those numbers?

In Chapter 4 of How to Make Money in Stocks, William O’Neil explains that three out of four big market winners historically were growth stocks. One in four was a cyclical or turnaround situation.

He specifically describes how China’s industrial expansion drove demand for steel, copper, chemicals, and oil after 2003, bringing cyclical stocks back into leadership. Their earnings exploded, but their businesses remained cyclical.

I believe parts of today’s market illustrate that same distinction.

Consider the forces behind several areas attracting attention:

  • Oil producers and refiners: The Iran conflict has disrupted energy supplies and transportation. Producers can benefit from higher realized oil prices, while refiners benefit when the spread between crude costs and refined fuel prices widens. Those are different earnings drivers. We have been seeing several U.S. refiners reaching all-time highs alongside triple-digit profit growth.

  • Marine shipping, particularly tankers: Disrupted routes and tight vessel availability can push freight rates sharply higher. That can produce an earnings boom without a company adding many ships, although operating costs and risks also rise.

  • Copper and energy infrastructure: Electrification, AI, and data centers create longer-term demand for copper and electricity. Natural gas is an important part of the U.S. power supply supporting that demand. These structural trends can strengthen the outlook while commodity-sensitive businesses remain cyclical.

A company can report tremendous sales and earnings growth because the price of what it sells has increased, industry capacity is constrained, or margins have expanded. That is different from growth driven primarily by new products, new customers, and sustained market-share gains.

Both can produce exceptional stock moves. And a business can have both cyclical and long-term growth drivers.

The mistake is assuming a few explosive quarters establish a durable growth business. Strong earnings and relative strength may satisfy parts of CAN SLIM, but understanding the earnings history and what is driving the acceleration still matters.

Both can be big winners. Understanding what’s driving the earnings helps you avoid mistaking a cyclical boom for growth that can last for years.

View on Substack ↗

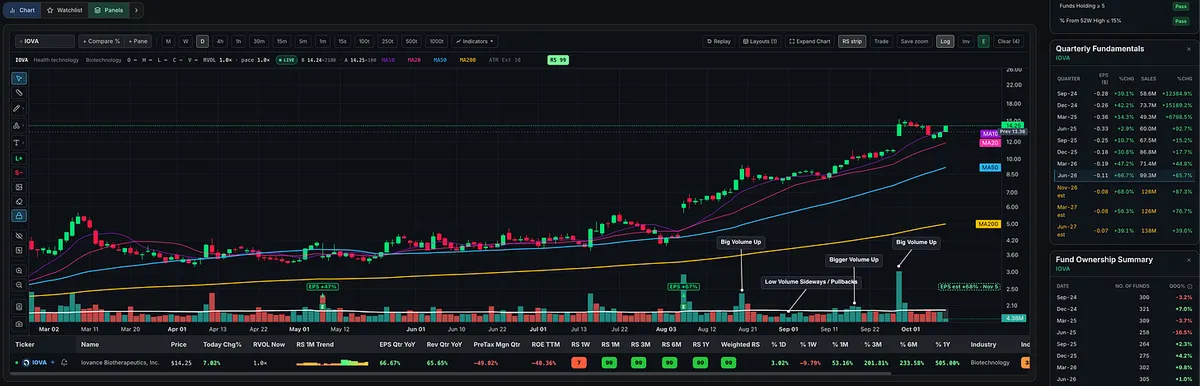
IOVA: A Great Example of Price, Volume, and Trend Alignment

This is exactly the type of price and volume action I look for in leading stocks.

  • Volume expands on advances, suggesting strong institutional buying demand.

  • Volume dries up during sideways consolidations and pullbacks, indicating relatively light selling pressure.

  • Price remains tight during pauses before momentum returns.

  • Moving averages are properly stacked: 10-day > 20-day > 50-day > 200-day, all trending higher.

  • Relative Strength: 99, demonstrating exceptional price leadership.

Now, let's look at the fundamentals, because this is a biotech.

$IOVA reported quarterly sales growth of 65.7% YoY, while EPS improved 66.7% YoY. However, earnings remain negative at -$0.11 per share, and forward estimates are still negative.

That EPS improvement means the company is losing less money, not that it's generating positive earnings. I place much more weight on the actual sales growth and the trend toward profitability than on that EPS percentage.

This is where William O'Neil and Mark Minervini differ somewhat.

O'Neil's CAN SLIM methodology strongly emphasizes positive, accelerating earnings and sales growth. A company reporting smaller losses generally wouldn't meet his preferred earnings criteria.

Minervini, while also favoring strong earnings and sales, makes exceptions for certain situations, particularly biotechs. He explains that many biotechs lack positive earnings, so he will evaluate them based on technical strength, price and volume, and potential drug-development catalysts.

I take a similar approach. With biotechs, I'm willing to overlook negative ROE and pre-tax margins when other characteristics are compelling. That doesn't mean fundamentals don't matter. Strong sales growth, improving losses, and a potential path to profitability are still important.

IOVA is an excellent chart to study for price and volume characteristics, relative strength, and moving average alignment.

Not every leading stock will check every fundamental box, particularly in biotech. Learn to recognize the characteristics that matter, understand the industry you're trading.

View on Substack ↗

“Nike Isn’t Going Anywhere” Is Not a Buy Signal

Nike doesn’t have to go bankrupt to cost you years.

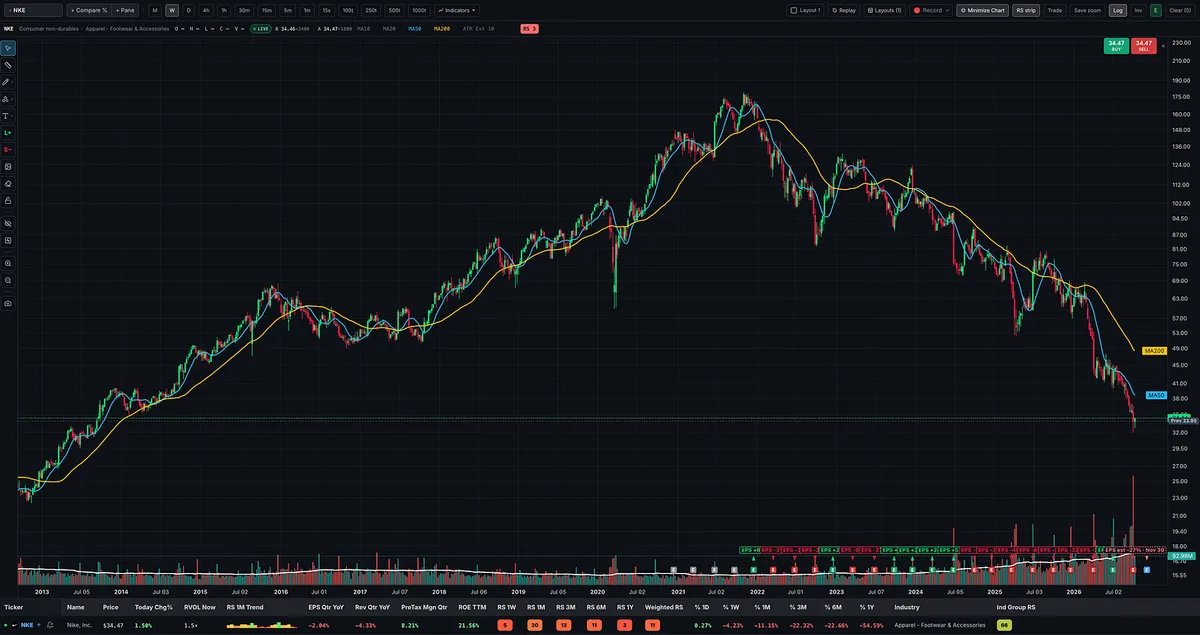
The stock is roughly 80% below its 2021 peak, back around prices last seen in 2013. Yet one of the most common defenses I keep seeing is: “It’s Nike. The company isn’t going anywhere.”

Okay, but the company’s survival doesn’t tell you when to buy its stock.

On the chart in front of me, I see a Stage 4 decline: lower highs, lower lows, and price beneath falling major moving averages. A familiar name doesn’t change that evidence.

If you’re a value investor or turnaround investor, you may have a different process, time horizon, and set of rules. Fair enough.

But if you call yourself a growth stock or momentum trader, buying an aggressive Stage 4 decline because “it’s Nike” is a departure from your process.

You can believe in Nike’s future and still require its stock to earn your capital.

That principle runs through the trading books I study. These are the published rules I’m applying to this chart.

William O’Neil wrote in How to Make Money in Stocks:

“You should buy stocks when they’re on the way up in price, not on the way down.”

Mark Minervini wrote in Think & Trade Like a Champion:

“I avoid going long a stock in any stage except Stage 2.”

Stan Weinstein made the instruction unmistakable in Secrets for Profiting in Bull and Bear Markets:

“Never buy a stock that’s in Stage 3 or 4 (especially Stage 4).”

And when David Ryan was asked in Momentum Masters whether he ever bottom-fishes, his answer was:

“I never buy new lows, if that is what you are asking.”

Their methods have differences, but they all agree on this. Dan Zanger describes his preference in Momentum Masters this way:

“Uptrends are my best friend and certainly my preference…”

There is a reason this emphasis on strength keeps appearing.

Minervini describes making the opposite mistake early in his career: buying depressed household names like AT&T and General Electric because he assumed their familiarity and size made them safer and that they eventually had to go up. That reasoning led to losses.

“It’s a great company” can become a very expensive substitute for an entry strategy.

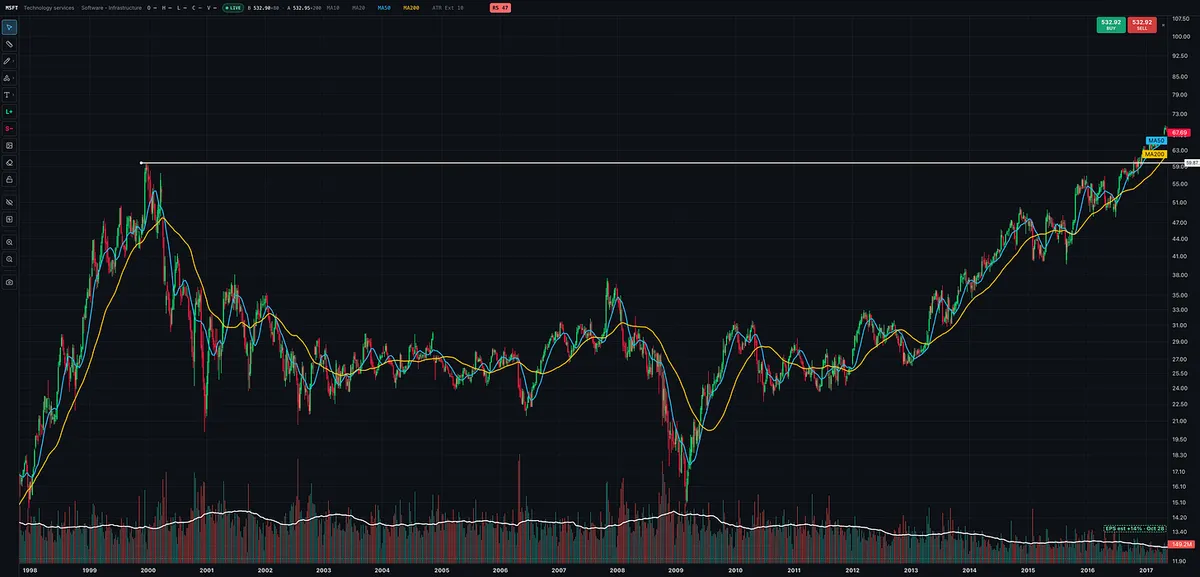
Microsoft is a reminder of how long the wait can be.

After its late-1999 peak, Microsoft’s share price did not set a new record until October 2016, nearly 17 years later. That is a share-price comparison, excluding dividends. Recovering an old price also does not restore purchasing power lost to inflation.

Also, the cost is more than the decline in your account. There is also the time spent waiting and the other opportunities you cannot take with that same capital.

Nicolas Darvas captured the discipline in How I Made $2,000,000 in the Stock Market:

“I should hold the rising ones and sell those that fall.”

Nike may recover. It may become an attractive momentum setup again. I can reconsider it when the evidence changes.

Let it end the decline. Let it build a base, establish a Stage 2 uptrend, and present a valid entry with defined risk.

Until then, “it’s Nike” does not satisfy my buying criteria.

A famous logo does not get an exception to your rules.

View on Substack ↗

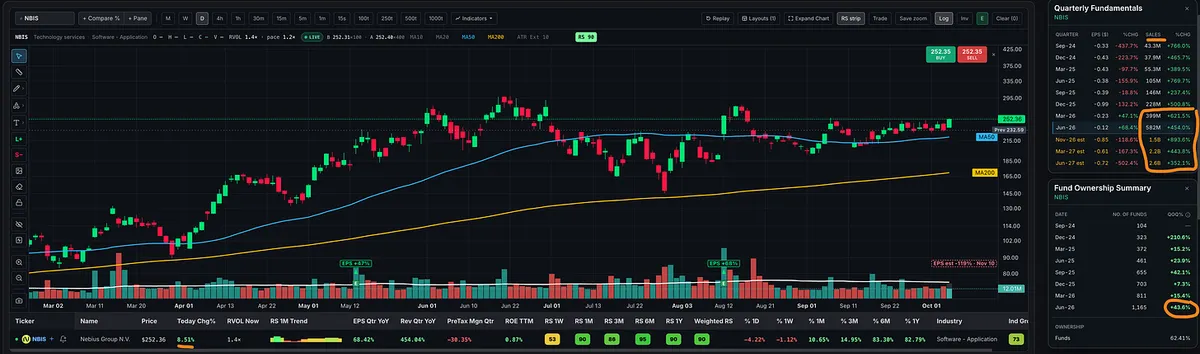
NBIS has been showing up on my screens.

Going through today’s movers, I pulled it up again. A lot of us have been watching this one for a while, but look at those sales numbers.

That growth is insane.

Then you look at fund ownership: up 43% in the last reported quarter.

Apparently, I’m not the only one who’s been staring at that sales column.

Who else has this one on their radar?

View on Substack ↗

6,400% From a Stock I Knew Nothing About

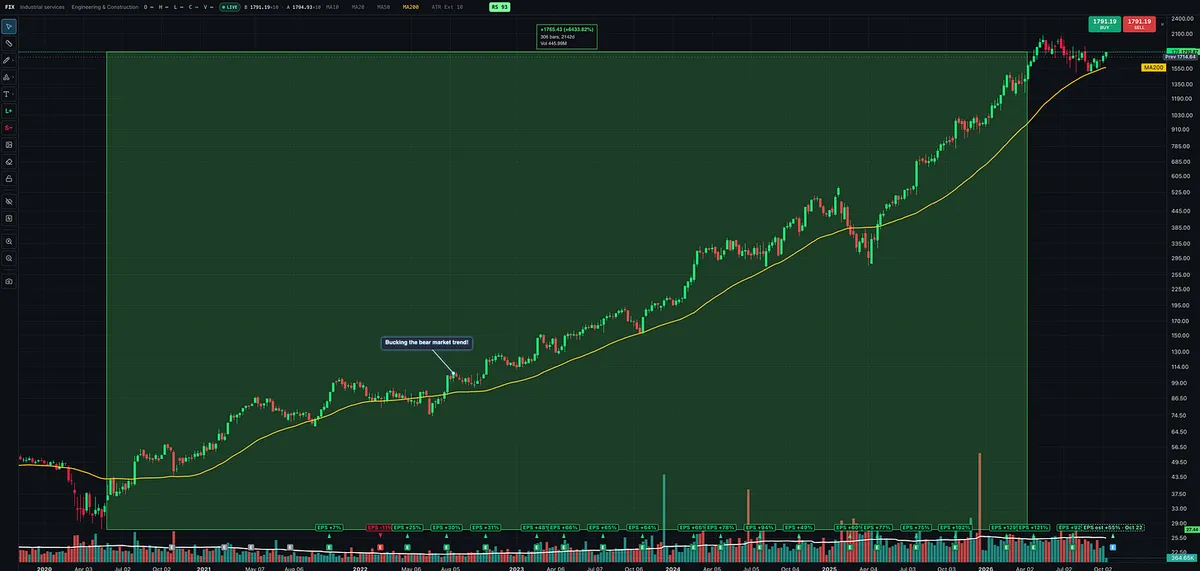
FIX has climbed more than 6,400% from the 2020 level marked on this chart.

When it first appeared on my stock screeners, I knew nothing about the company.

That is exactly why this chart is worth studying.

Comfort Systems USA first caught my attention in the summer of 2022. The broader market was in a bear market, yet FIX was pushing to new highs and bucking the trend.

By January 2023, when there was still plenty of uncertainty about whether the indexes were emerging from the bear market, FIX was already establishing higher highs and higher lows.

The stock was demonstrating leadership before the market’s recovery felt comfortable.

I wasn’t searching for an AI trade when I found it. I was screening for the CAN SLIM leadership characteristics I look for.

As it turns out, FIX is an AI infrastructure beneficiary. Its mechanical, electrical, cooling, and modular construction capabilities help build the data centers supporting AI. Management has explicitly identified AI as an additional source of data center demand.

But I didn’t understand that connection when the stock first appeared on my screens.

My process found the strength before I understood the story.

Throughout much of the advance, the fundamentals reinforced the price action. From 2023 to 2025, annual sales rose from $5.2 billion to $9.1 billion, diluted earnings per share more than tripled, and gross margins expanded from 19% to 24.1%.

To me, FIX is a modern model book stock.

It displays the combination William O’Neil teaches us to recognize in How to Make Money in Stocks: strong earnings and sales, improving profitability, relative strength, and constructive price action. There is a reason he opens the book with 100 charts of past market winners. Studying their recurring characteristics helps us recognize potential leaders while their moves are still developing.

Mark Minervini makes a point in Think & Trade Like a Champion that fits this experience perfectly:

“I embrace new names instead of avoiding them.”

The discussions in Momentum Masters reinforce another lesson: leading stocks can emerge before the indexes make a new uptrend obvious. Stan Weinstein’s Stage 2 framework gives us a way to recognize the advancing phase, with rising prices, higher highs, and higher lows.

These lessons come together in FIX.

A process helps you find potential leaders, identify proper entries, define your risk, and manage the trade as it develops. Following that process requires discipline, especially when the company is unfamiliar or the market still feels uncertain.

“The trend is your friend until the end, when it bends.”

The last part is important, too. Give a winner room to develop within your rules, and respect your exits when the evidence changes.

You need a process that can bring an unfamiliar leader to your attention, the patience to let a winner develop, and the discipline to follow your rules from entry to exit.

View on Substack ↗

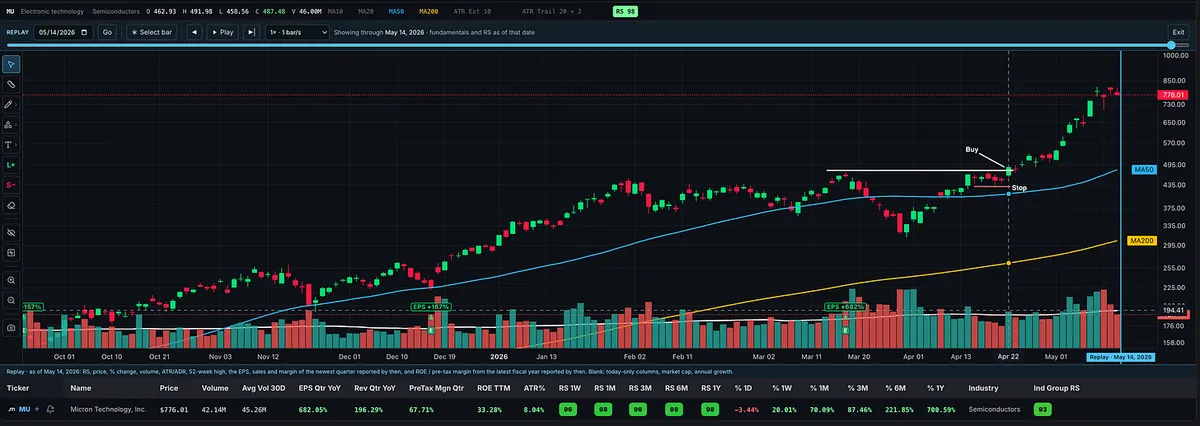
Ummm… hello, MU. 👀

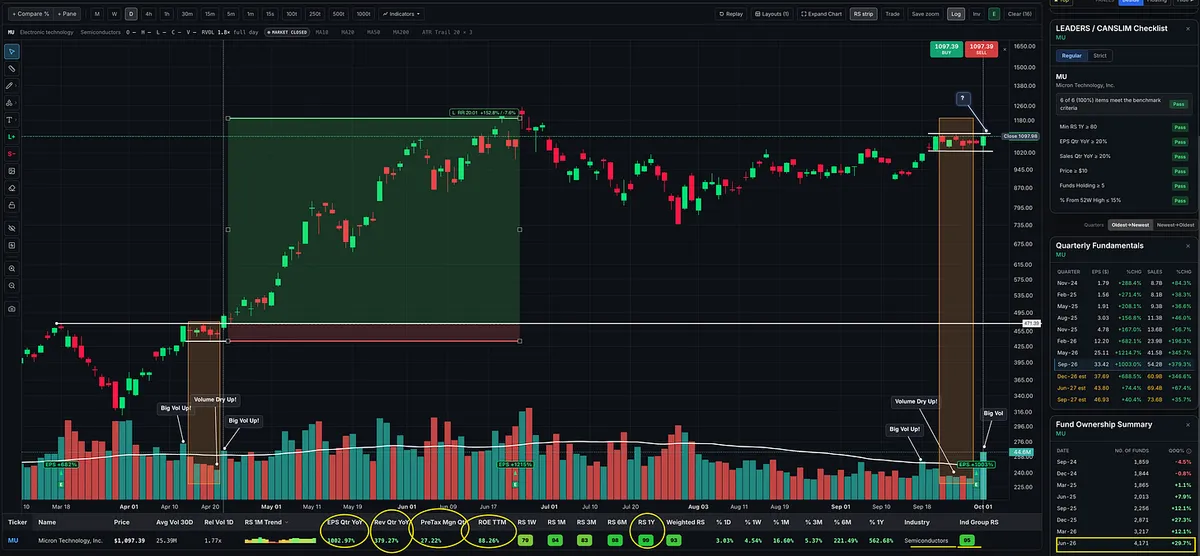
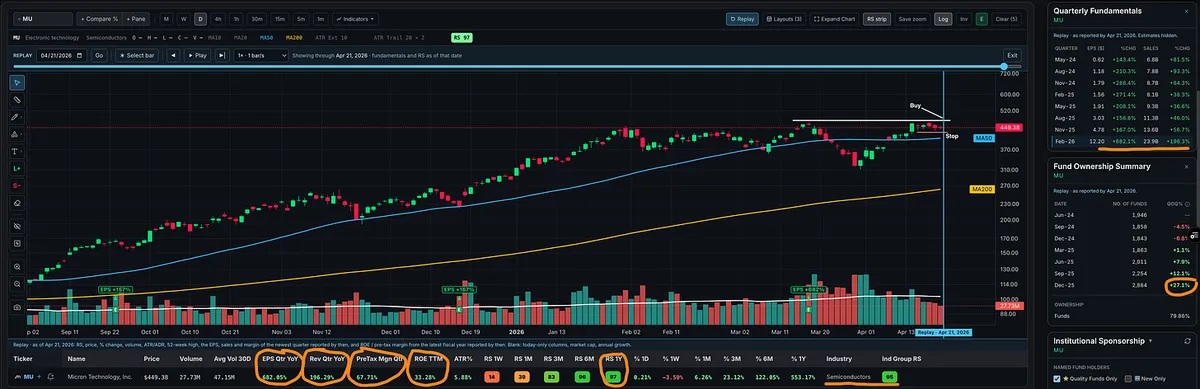
Another massive earnings report, and the chart is getting interesting.

Look at the highlighted setup in April. Now look at the right side of the chart.

Price tightened, volume dried up, and then buyers showed up before that huge advance.

Now MU is tightening again in the upper half of its base, with volume starting to return. This is exactly the kind of price and volume behavior I like.

I’m watching for a decisive move through the top of this tight range, backed by volume and follow-through.

MU, are we getting ready for another launch? 🚀

View on Substack ↗

Biotech Keeps Stealing the Show 🧬

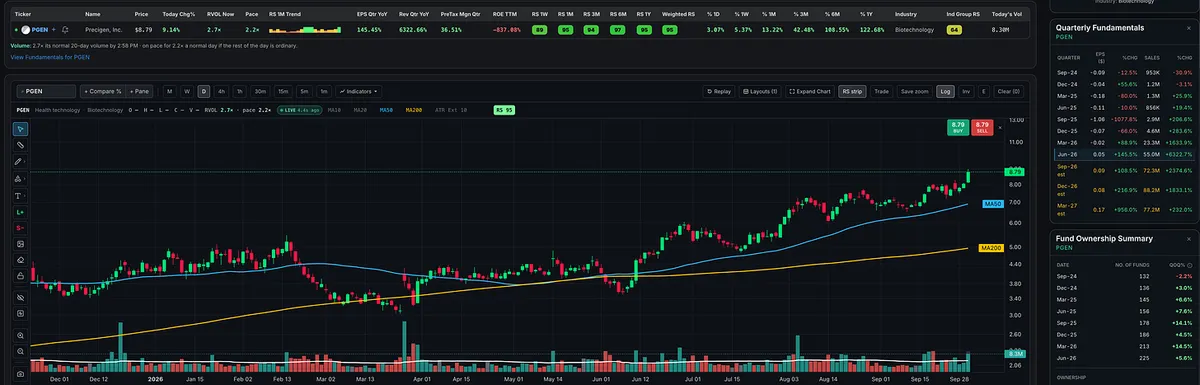
Another day of biotech names delivering big gains with strong volume behind the moves.

PGEN is one example: pushing higher with 2.7x relative volume.

View on Substack ↗

Another Monster Move in Biotech

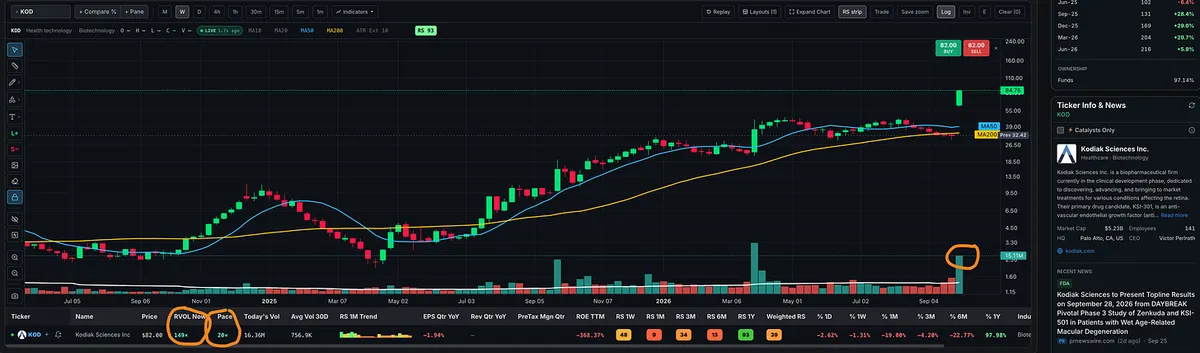
$KOD with a huge gap up and massive volume today. Another explosive biotech move that brings $MRNA to mind.

Today’s catalyst: positive Phase 3 results from Kodiak’s DAYBREAK trial for wet age-related macular degeneration. Clinical results can change expectations for a company very quickly, and the chart shows that repricing in real time.

Looking further ahead, I think AI will help accelerate drug discovery and development, potentially opening the door to more biotech breakthroughs. If those advances translate into successful treatments, we could see more massive moves like this in the years ahead.

Biotech is an area worth watching.

View on Substack ↗

A Hot Group Doesn’t Make Every Stock a Leader

“I missed the leader. I’ll buy this one. It hasn’t moved yet.”

That’s how you can identify the right industry group and still buy the wrong stock.

Strong groups often have a few stocks setting the pace. Those are the names I want to study first: strong earnings and sales, leading relative strength, and constructive price-and-volume action.

The stock that looks cheaper may have weaker growth, more overhead supply, or less demand. Sharing an industry with a big winner doesn’t mean it deserves the same buying interest.

“It hasn’t moved yet” is not evidence that it will catch up.

A later breakout isn’t automatically a laggard, but that stock still needs to qualify on its own. I want evidence of strength, not a discount to another stock’s performance.

And identifying the leader doesn’t give me permission to chase it. If it’s extended, I wait for another qualifying entry or look for a different stock that meets my criteria.

Find the leading group. Find the leading stocks in that group. Then wait for your entry.

View on Substack ↗

The “Bargain” Can Be Your Most Expensive Trade

A stock near its 52-week high with a high P/E gets dismissed as “too expensive.”

A stock down 60% gets called “a bargain.”

But the first may be attracting buyers because its business is accelerating. The second may be falling because its prospects are deteriorating.

A lower price doesn’t automatically mean better value.

Minervini makes this point in Trade Like a Stock Market Wizard: many exceptional growth stocks looked expensive before their biggest advances. Investors were willing to pay a premium for rapid growth.

Meanwhile, buying a stock simply because it has fallen creates a dangerous trap. If it drops again, it looks even cheaper. The reason you bought becomes the excuse for staying.

I want strong earnings and sales, leading relative strength, and constructive price and volume action. Then I need a qualifying entry with defined risk.

Don’t let a high P/E alone scare you away from a potential winner.

View on Substack ↗

Hello Again, $MXL 👀

Making a comeback, I see.

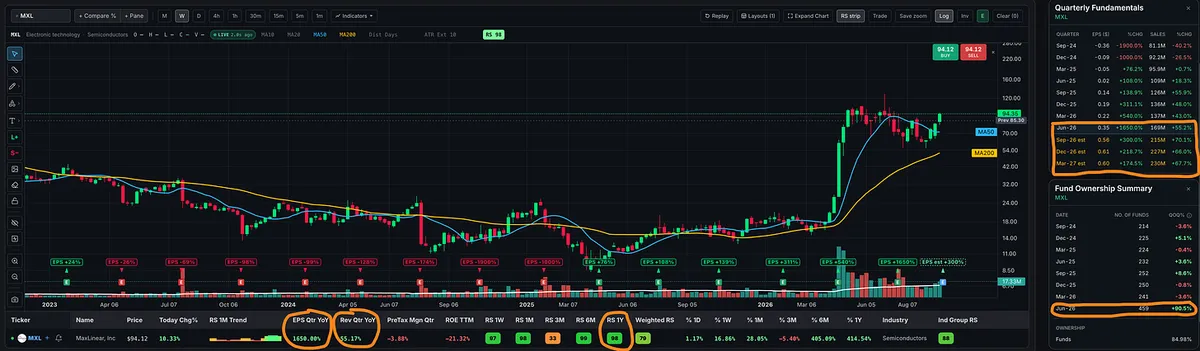
Up +10% today, sporting a 98 Relative Strength rating, and working back up the right side of its consolidation. Latest quarterly sales growth: 55%. BIG jump in fund ownership.

View on Substack ↗

The Discovery That Turned “Buy Low” on Its Head

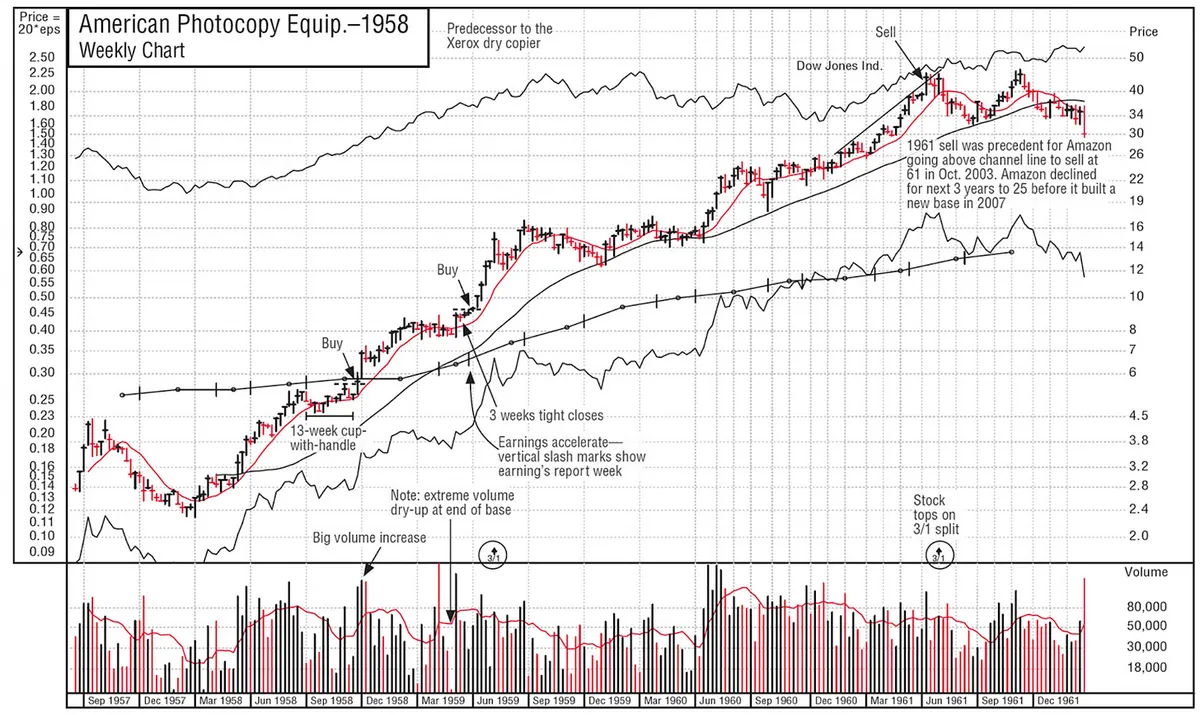
In January 1960, William O’Neil studied the best-performing mutual funds to understand what separated them from their competitors. The Dreyfus Fund stood out. He obtained its reports from 1957 through 1959, calculated the average purchase prices of its new holdings, and marked those prices on stock charts.

After examining more than 100 new purchases, he made what he called a “stunning discovery”: every stock in that sample had been bought at the highest price it had traded at during the preceding year.

Think about that. While many investors associated bargains with stocks that had fallen, one of the standout funds was buying stocks reaching new highs. Those purchases also followed recognizable chart patterns. O’Neil had found two essential clues: strength mattered, and the pattern preceding the breakout mattered.

For an individual stock, a new high shows that price has overcome the selling that previously contained it. When that happens as the stock emerges from a sound base on heavy volume, it provides evidence of demand consistent with institutional buying. Combine that with strong earnings, sales, and relative strength, and you begin to understand why new highs became central to O’Neil’s stock selection.

A true all-time high adds another advantage: the stock has cleared its historical overhead supply. Investors who bought at higher prices are no longer waiting above it to sell at breakeven. A 52-week high is significant too, although older resistance can still exist.

For the general market, new highs help reveal the strength of the environment in which those stocks are trading. O’Neil studied the major indexes’ price and volume action because market direction could support or undermine even an excellent stock selection. An index reaching new highs is good evidence, while volume, distribution, and the behavior of leading stocks help determine how much confidence that strength deserves.

He also examined which industries dominated the new-high list. Multiple strong stocks from the same group helped identify where leadership was developing.

This became part of a coherent strategy: a supportive market, leading companies, sound bases, and strong demand at the breakout. New highs off properly formed bases were explicitly part of the “N” in CAN SLIM.

O’Neil’s lesson was to study what successful stocks actually did and let that evidence challenge what felt comfortable.

A new high can be the beginning of a major move. Learn to recognize the conditions that make it worth buying.

View on Substack ↗

What Did the Numbers Look Like Before the Breakout?

I need to do a better job highlighting some of the features I’ve added to MTS Velocity. One of my favorites is chart replay.

Rewinding a stock’s chart helps you train your eye to recognize the setup before the breakout. You can also see what its earnings, sales, margins, and relative strength ratings looked like at that point in time.

That makes it useful for studying past winners. Go back before the big move and examine the whole picture: the setup, the growth, the profitability, and the relative strength.

Were the characteristics there before the breakout? Would this stock have earned a place on your watchlist?

That’s how I want people to use it: to study what made a stock stand out before the outcome was obvious.

View on Substack ↗

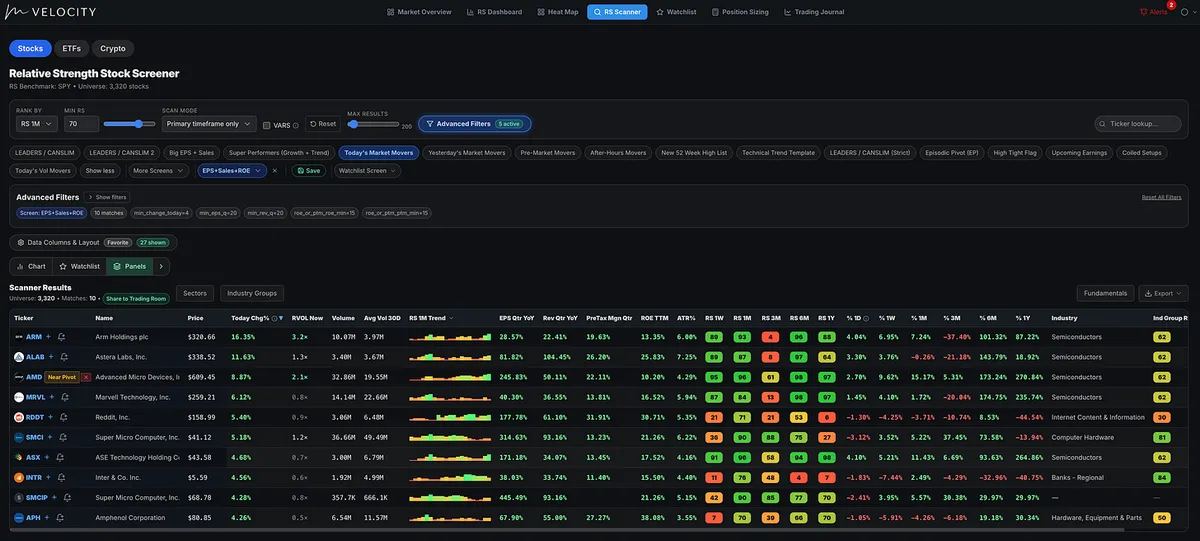
“Hey MTS Velocity, show me today’s market movers with the earnings, sales, and profitability to back up the move.”

Here’s the scan:

✅ Up at least 4% today

✅ 1-month RS rating of 70+

✅ Quarterly EPS growth of at least 20%

✅ Quarterly sales growth of at least 20%

✅ ROE or pre-tax margins of at least 15%

My starting universe: 3,320 NYSE and Nasdaq stocks, already filtered for minimum price, average trading volume, and market cap.

Just 10 matches.

$ARM · $ALAB · $AMD · $MRVL · $RDDT · $SMCI · $ASX · $INTR · $SMCIP · $APH

Leading the list when I ran the scan: ARM +16.35%, ALAB +11.63%, and AMD +8.87%.

View on Substack ↗

98% of the Big Winners Had This in Common

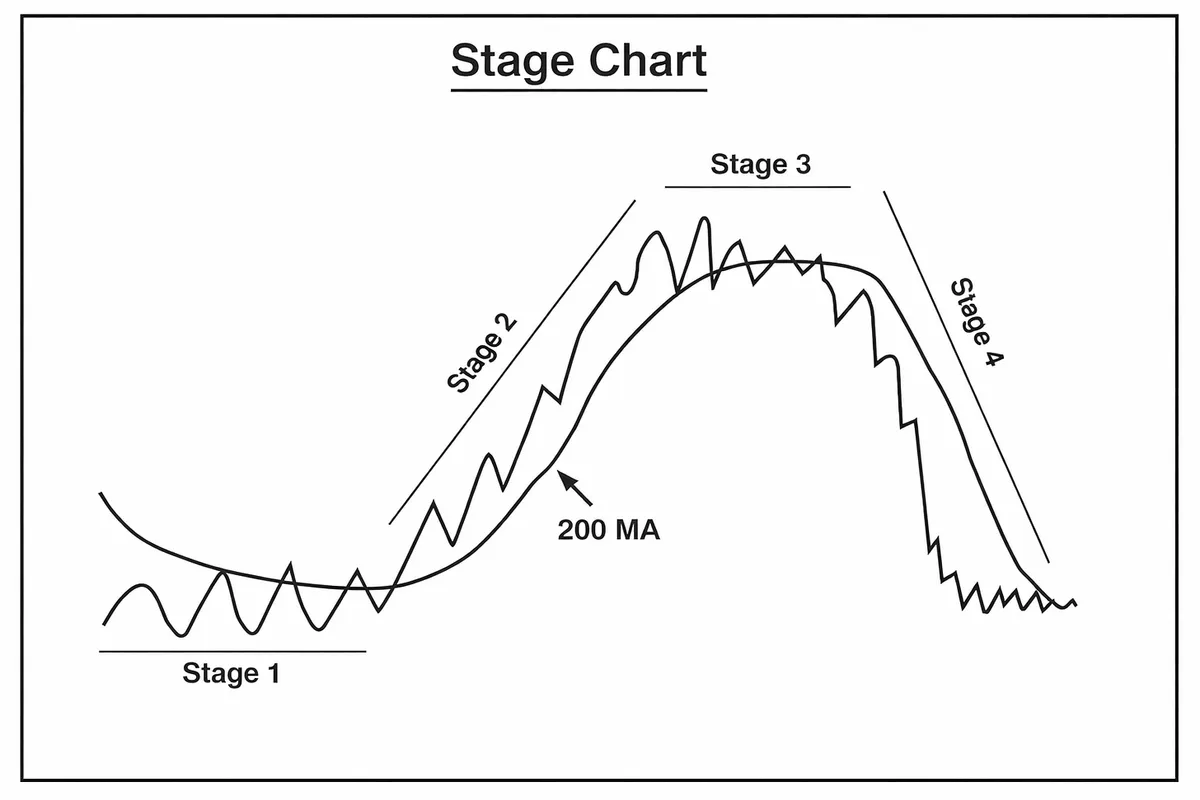
Mark Minervini explains that, in his historical studies, 98% of the big market leaders made their major advances during a Stage 2 uptrend.

That should tell you where to concentrate your search.

Yet traders spend countless hours looking for a bottom, buying stocks because they look cheap, or convincing themselves that a great company deserves their money while its stock keeps falling.

For my approach, the first question is simple:

Is this stock in a confirmed Stage 2 uptrend?

Before I get attached to the name or start finding reasons to like the company, I want the trend to qualify.

Stage 2 is the advancing phase. I’m looking for an established uptrend, price above rising longer-term moving averages, and constructive price and volume action consistent with institutional accumulation.

A stock being down substantially from its high doesn’t satisfy that requirement. Neither does a few strong days inside a longer downtrend.

But Stage 2 alone doesn’t make a stock a buy.

I still need the earnings, sales, relative strength, setup, and entry to meet my criteria. And I need a stop and position size that keep the planned risk within my limits.

The trend qualifies the stock for further consideration. The complete setup determines whether I trade it.

Stage 2 first. Every other requirement still applies.

View on Substack ↗

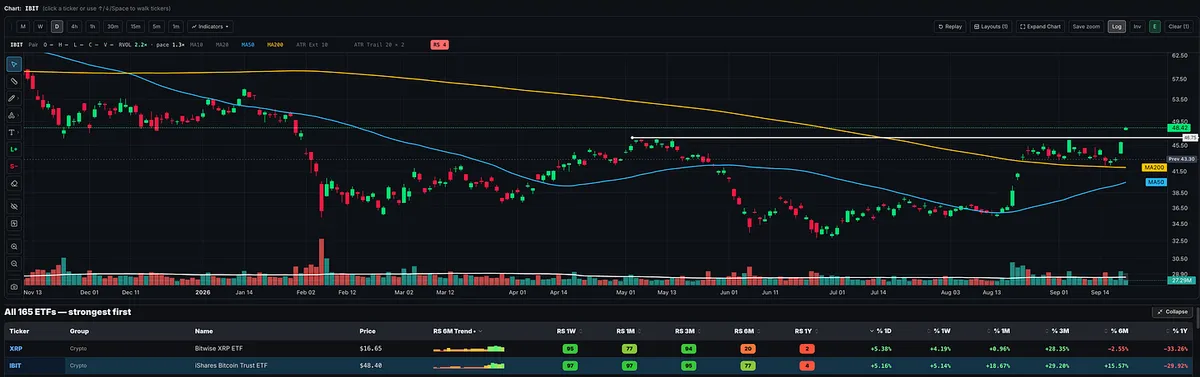
There goes IBIT, moving into new 52-week highs

William O’Neil’s research found that, during bull markets, stocks making new highs tended to keep moving higher. The strongest opportunities emerged when price broke out of a sound base with strong volume. What looked “too expensive” to many investors could be the beginning of a substantial advance.

Nicolas Darvas built his approach around a similar principle. He watched stocks consolidate within a defined box, then bought as price broke into a higher range. He deliberately sought strength near new highs, allowing the market to demonstrate demand before committing his money.

A new 52-week high puts the entire past year’s trading range beneath the current price. Buyers have absorbed the selling encountered along the way. Why is this important? Because investors trapped at higher prices can create resistance when they finally get an opportunity to sell near breakeven.

That’s what makes IBIT’s move worth paying attention to. The next evidence is whether the breakout holds, and follows through.