Momentum Trading Strategy

Notes

Market Conditions

Reading the overall market and deciding how aggressive to be.

Showing 1–20 of 227 notes

View on Substack ↗

Stop Trading Other People’s Fear

Most people remember a market selloff. Far fewer carry the lesson into the next one. My trading improved significantly when I stopped forgetting what the last panic had taught me.

I put real effort into staying stoic. My politics, personal beliefs, and opinions about what should happen cannot dictate how I trade. The market doesn’t owe me an outcome that agrees with my worldview.

COVID. The 2025 tariff scare. Different headlines, same temptation to let fear take over and convince yourself that this time, there’s no coming back. Even experienced traders can become so invested in a bearish narrative that they struggle to recognize when the market starts proving it wrong.

When pessimism gets overwhelming, I start feeling like a jockey holding back a horse that wants to run. I’ve learned that some of the most prosperous trading periods emerge from the wreckage of a bear market or a major scare. The challenge is staying patient enough to wait for price to confirm the turn.

Fear gets my attention. Price gives me permission.

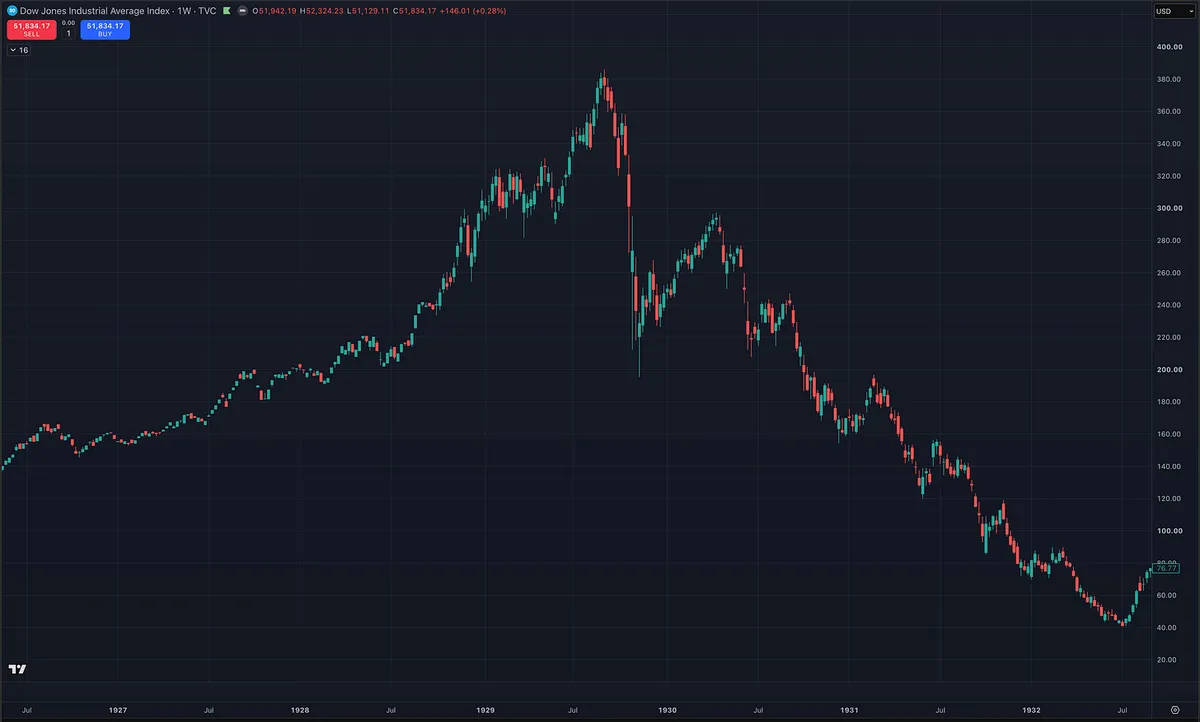
Everyone calling for another 1929 doesn’t mean the bottom is in. It means I need to stay alert to a change in character instead of letting everyone else’s emotions close my mind to opportunity. And when bearish voices disappear and everyone thinks making money is easy, I want to be paying just as much attention.

You don’t need an opinion on every headline. Follow price action, a few key moving averages, and the behavior of leading stocks. When the market’s character deteriorates, reduce exposure and honor your exits. When it improves and valid setups emerge, start putting money back to work.

Be more stoic. Stay flexible. Learn the lessons, and carry them into the next cycle.
View on Substack ↗

New Highs. Mixed Signals. Are You Prepared?

A new trading week is here, with the Nasdaq Composite and Nasdaq 100 sitting right at all-time highs. Yet weak breadth, elevated distribution, and rising Treasury yields deserve attention.

O’Neil emphasized market direction and leading stocks. Zweig taught us to respect the tape while watching monetary conditions. Together, those lessons call for following price without dismissing the risks.

We don’t need every indicator to agree. We do need a plan.

This week’s Big Picture Market Pulse breaks down the conflicting signals, where leadership stands, and the stocks and groups I’m watching.

Read it before the trading week gets moving.

https://tradingmomentum.substack.com/p/the-nasdaq-at-all-time-highs-who

On SubstackBig Picture Market Pulse | October 4, 2026: The Nasdaq at All-Time Highs: Who Needs Market Breadth Anyway?
View on Substack ↗

The Market Can Turn Before Your Opinion Does

Breadth looks terrible. The Nasdaq is at all-time highs. Both matter.

These two screenshots track breadth across 11,700+ stocks, comparable to the broad-market view on platforms like Finviz.

In the spring, the percentage above the 50-day moving average climbed from 17% on March 27 to 24% on April 3, then 72% on April 17.

Conditions changed quickly. Waiting for every indicator to look healthy would have meant missing much of that recovery.

Now that same measure has fallen from 64% on August 14 to 33% on October 2.

Another recovery is possible, but the warnings are real: elevated S&P 500 distribution, Nasdaq new lows overwhelming new highs, rising Treasury yields, downtrends in the Dow and Russell, and Fed rates no longer falling.

I remain bullish because the Nasdaq and select leaders are holding up despite those pressures. But continued deterioration could eventually pull those leaders lower, too.

The spring comparison shows how quickly breadth can improve.

Stay nimble. Be willing to shift from bearish to bullish, or bullish to bearish, when the evidence changes.

Size positions appropriately. Define your risk. Cut failed trades. Increase exposure as positions work, and reduce it when they stop working.

You do not need to predict the next move to prepare for it. Keep your opinions flexible and your risk discipline consistent.

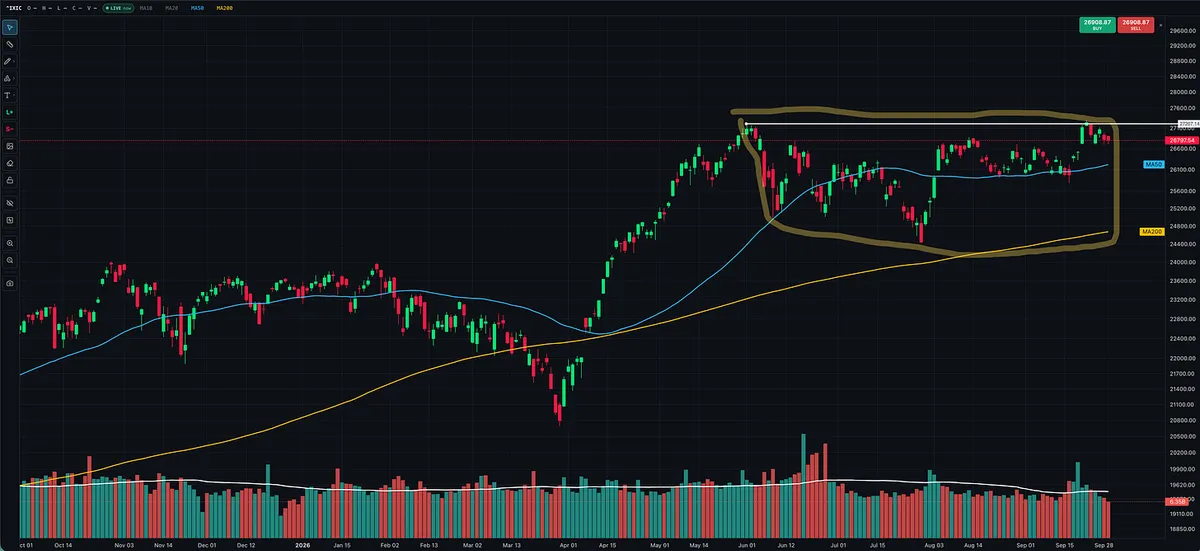
With all that said, the Nasdaq is at all-time highs, forming higher lows and tightening up the right side of the chart. Price remains the most important indicator. 😉

View on Substack ↗

Buying Earlier Won’t Fix a Bad Market.

Most of the time in a sideways, choppy market, I’m in cash.

Growth-stock momentum trading needs sustained follow-through. When the market keeps chopping up our setups, preserving capital is part of the strategy.

When I do trade, it’s usually because strong stocks are emerging within strong industry groups, while the market is pushing toward its highs and showing signs of transitioning out of the range. That’s why I was buying AEHR and other names in early August.

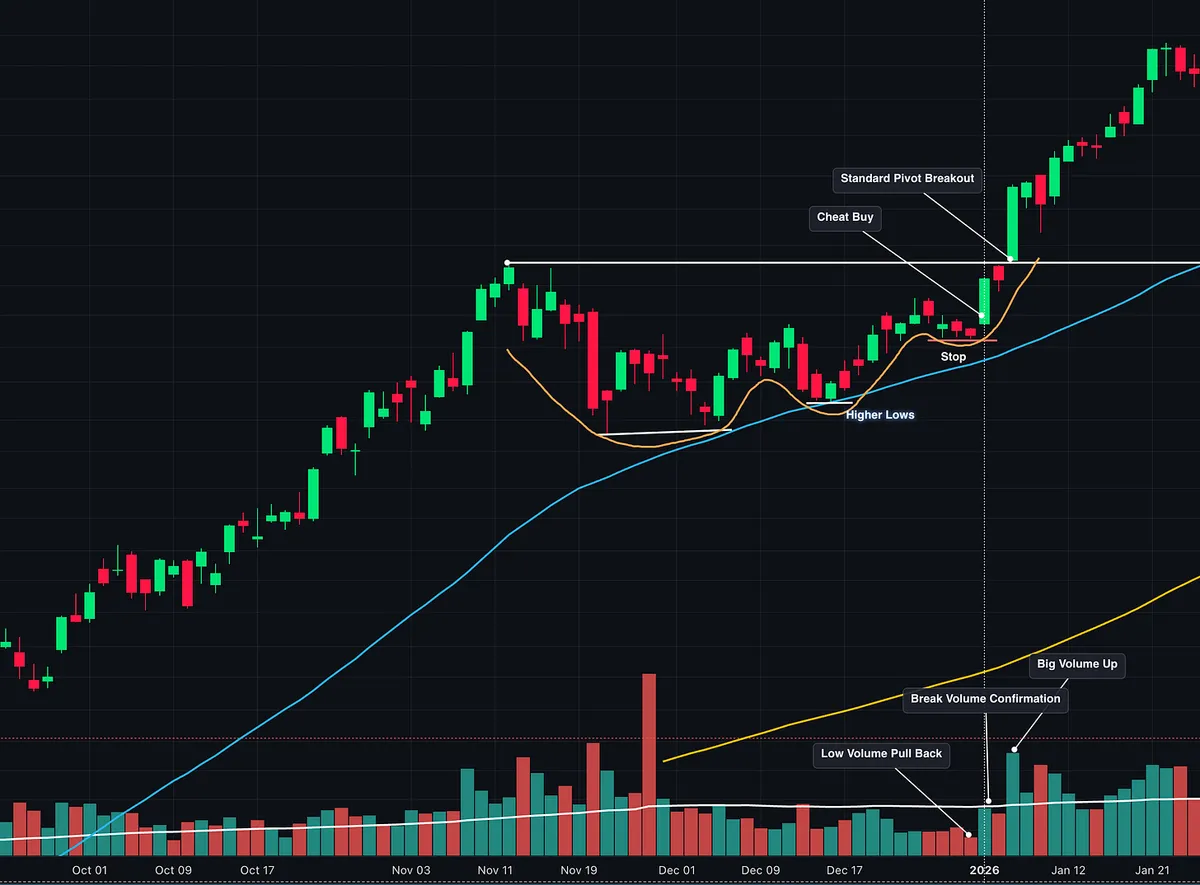
During those transitions, I’ve often found pullbacks and cheat entries easier to work with than traditional breakouts. That’s my experience, not an automatic rule.

I adapt to what the market is rewarding, including what my own trades are telling me.

The stock-selection standards stay the same: strong relative strength, earnings and sales growth, industry leadership, and constructive price and volume action. I want volume supporting advances, quieter pullbacks, higher lows, and tightening price action up the right side of the chart.

A cheat entry means buying the turn higher through an earlier buy point within the base, before the standard breakout. A pullback entry means waiting for controlled selling to give way to a defined turn higher.

Neither means buying simply because the price is lower.

My stop is defined before entry, usually below the tight setup, relevant pullback low, or low of entry day provided that distance fits my risk limits.

There are trade-offs. Low cheats face more overhead supply. During transitions, I’m quicker to reduce risk as trades progress, even if that means cutting some off prematurely.

I make selective attempts and build exposure as they work. If the market keeps rejecting those attempts, I return to cash.

Cheat entry below: Buying the turn higher before the standard pivot breakout, with risk defined below the recent pullback low.

View on Substack ↗

The Market Doesn’t Have to Crash to Wreck Your Account

Everybody fears the big market drop, but for a momentum trader, a sideways, choppy market can do more damage than a clear downtrend.

Think about COVID or the tariff selloff. Those moves were large, and sudden gaps can carry a stock beyond your stop. But with disciplined sell rules, a sustained breakdown pushes us out of positions and into cash. We take the losses, reduce exposure, and wait for conditions to improve.

The danger in a choppy market is that it keeps convincing you to come back.

A stock sets up. You buy. It breaks out, stalls, reverses, and stops you out. Another setup appears, and you think this one will be different. Maybe you even make a little money before the next few trades take it back.

Each loss looks manageable. The cumulative damage is not.

Mark Minervini addresses this directly in Momentum Masters:

“A whipsaw market is more dangerous than a bear market.”

He describes the repeated buying and stopping out as “death by a thousand cuts.” His point is that a clear bear market can force you into cash, while a whipsaw market keeps drawing you into trades that fail.

David Ryan calls a whipsaw market the toughest environment to trade. His response is to reduce exposure, trade smaller, and favor selective pullbacks in leading stocks over breakouts.

Dan Zanger often steps aside entirely:

“Long or short, chop will eat you alive.”

This is why having a stop on every trade is only part of risk management. You also have to manage how often you trade and how much you commit when your setups aren’t working.

You can obey every individual stop and still bleed your account by repeatedly taking full-size positions in an environment that offers little follow-through.

For me, repeated failures are a signal to slow down, reduce size, and become more selective. I want successful trades to justify increasing exposure.

We don’t need to wait for a crash, or settle the debate over whether the market is officially in Stage 3, to recognize that our approach isn’t being rewarded.

Protect your capital from the small losses you keep volunteering to take, too.

View on Substack ↗

Think Today’s Market Is Different? Read This

Before the 1929 crash, Gerald Loeb noticed something familiar: his leading stocks were starting to act badly.

He sold them and moved into other names. Then those started deteriorating too. Eventually, he looked for something strong to buy and couldn’t find anything.

The market was pushing him toward cash, one failed opportunity at a time.

Loeb later placed the market’s top on September 3, almost two months before the Great Crash. By his own account, he was mostly out when it arrived.

The lesson isn’t that you should be able to predict the next crash. It’s that you don’t need to predict a crash to recognize when your stocks have stopped behaving well.

That is the same lesson I emphasize today. Watch the leaders. Watch what happens after you buy. When leading stocks deteriorate, replacement ideas keep failing, and your screens stop producing quality setups, stop forcing trades.

You don’t have to find something to buy just because you have money available.

Yes, technology has changed. But faster execution doesn’t turn a broken leader into a healthy stock. More information doesn’t make a failed breakout successful. And a sophisticated platform won’t protect you from refusing to take a loss.

Loeb was learning these lessons nearly a century ago. He later wrote The Battle for Investment Survival, a title that tells you something about how those experiences shaped his thinking.

Recognize when the market is no longer rewarding what you’re doing, protect your capital, and be ready when conditions improve.

Before dismissing an old trading lesson, make sure you aren’t repeating the mistake that taught it.

View on Substack ↗

The Warnings Are There, but So Is the Strength

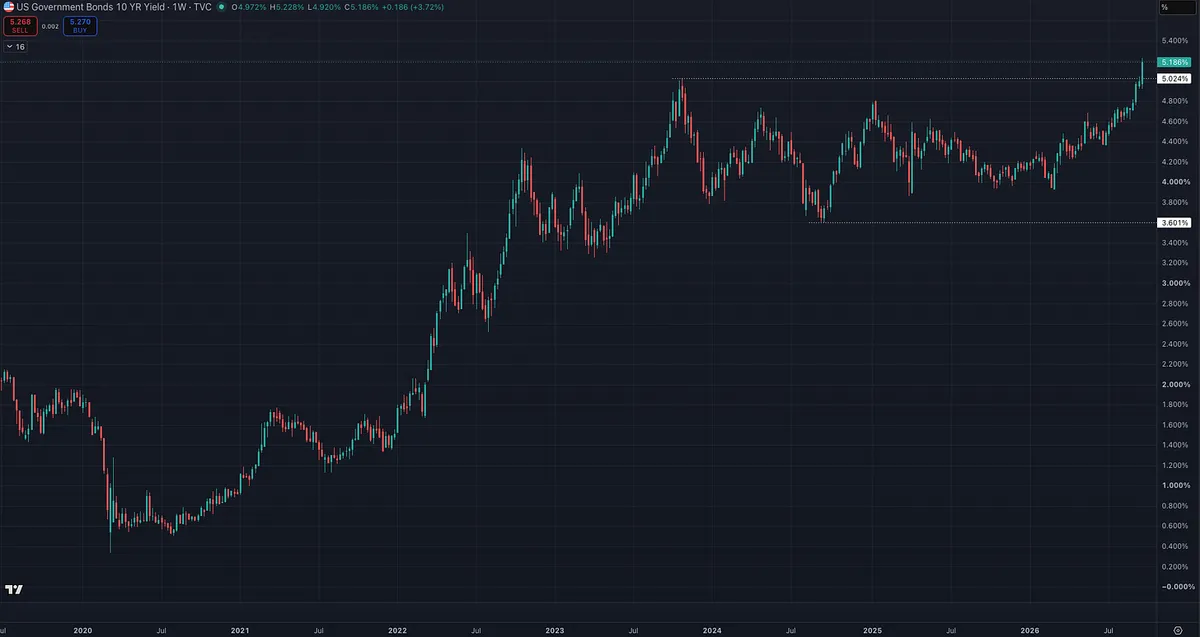
Net new lows and the percentage of stocks above key moving averages are showing some of the weakest readings I’ve seen since March. Stocks falling 4% have substantially outnumbered those rising 4%. Add a 10-year Treasury yield around 5.2%, and there are plenty of reasons to approach this market cautiously.

Yet look at QQQ and the Nasdaq Composite.

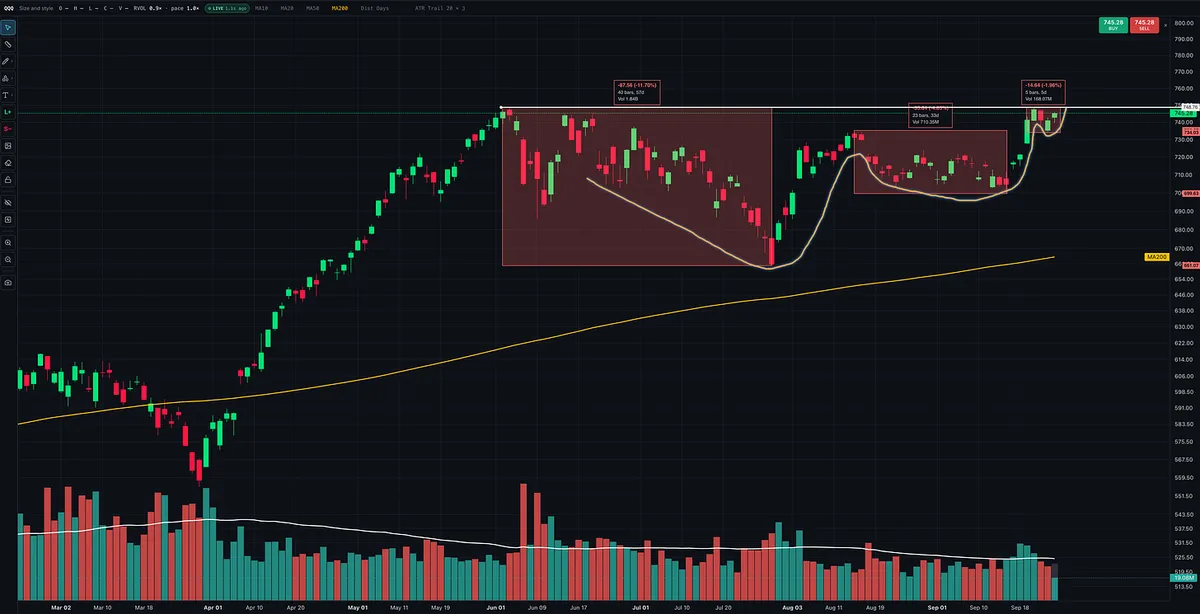
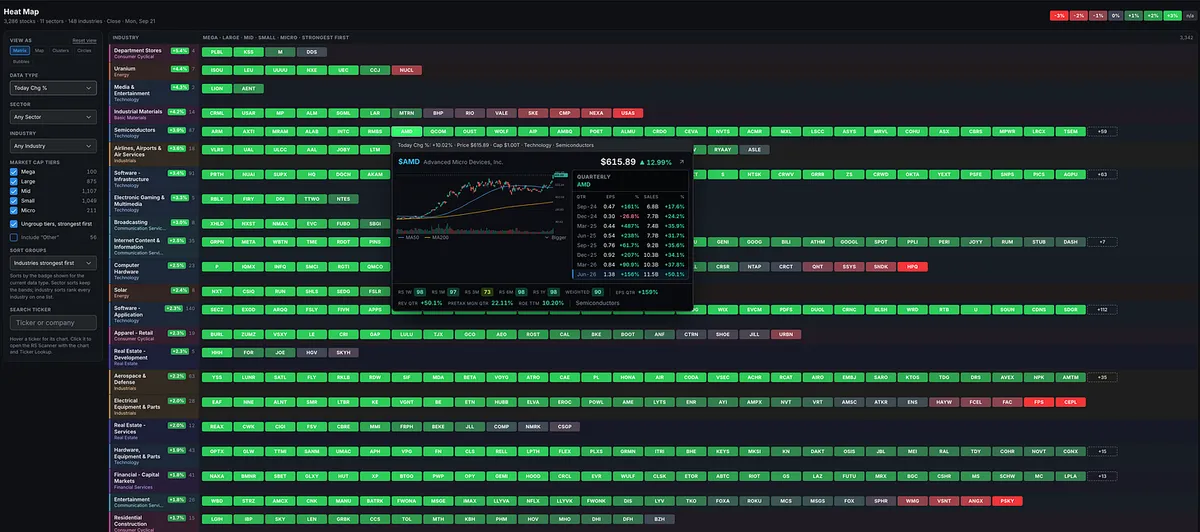
Both are sitting near their highs. On QQQ, successive pullbacks have narrowed from roughly 12% to 5% to 2%, creating VCP-like tightening up the right side of the chart. Meanwhile, leaders such as AMD continue to show strength.

The internal weakness is real, but so is the resilience in the leaders.

O’Neil explained that a market can continue advancing under the leadership of fewer, stronger stocks even as breadth deteriorates. Weinstein emphasized that weakening participation can warn of trouble before it becomes obvious in the averages. Those observations help explain why a constructive index chart and a weak broader market can exist at the same time.

The mistake would be letting either observation erase the other. QQQ holding near its highs doesn’t make the breadth deterioration irrelevant. Weak breadth doesn’t establish when the strongest stocks will stop advancing.

My approach is to respect the leading stocks and the indexes that reflect their strength. We are growth stock investors and momentum traders. We do not need every part of the market to be doing well to find opportunities in our stocks. Leadership is selective, and substantial gains can be concentrated in a relatively narrow group.

If stocks are setting up, breaking out, and following through, I will let those results help determine my exposure. The 10-year, the Dow, the Russell, and broader participation all provide context, but they do not automatically overrule constructive action in the stocks I trade. Price remains my most important indicator.

Will I remain aware of the poor breadth and rising yields? Absolutely.

But those warnings alone will not keep me on the sidelines while leading stocks continue to offer valid entries and reward them with progress. Successful breakouts and an expanding list of quality setups would support becoming more aggressive. Failed breakouts and deterioration in the leaders would support becoming more defensive.

Does participation improve around the leaders, or does the broader weakness eventually reach them?

That is what I’m watching, and I’ll adjust my exposure as the evidence develops.

View on Substack ↗

You Don’t Need Hindsight to Spot Stage 3

Someone recently commented that identifying Stage 3 is difficult and questioned whether it can only be spotted after the fact. It’s a fair concern. Recognizing a developing stage 3 takes practice, but it can be done while it is happening.

You won’t necessarily recognize Stage 3 the moment it begins. What initially looks like a normal pullback may gradually reveal a change in character as the evidence builds. That delay does not mean you have to wait until the damage is obvious.

Stan Weinstein and Mark Minervini describe the characteristics of a developing Stage 3. William O’Neil also emphasizes watching distribution, abnormal behavior in leading stocks, and the performance of your recent purchases. These observations help you recognize changing conditions and make decisions while the outcome is still uncertain.

That’s exactly what I walk through in this video. Using chart replay in MTS Velocity, I examine the indexes, sectors, industry groups, and leading stocks to show how the warning signs develop. We discuss what those changes mean for protecting gains, reducing exposure, and deciding when conditions justify getting more involved again.

A potential top can still resolve into another advance, so recognizing Stage 3 requires staying responsive to new evidence. I’ve sped the video up to 1.5× to keep the walkthrough moving. If you’re getting started with stage analysis, this should help you understand what to look for and how to practice recognizing it.

Watch the video: Stage Analysis: How to Spot Stage 3 in Real Time

https://tradingmomentum.substack.com/p/stage-analysis-how-to-spot-stage

ArticleStage Analysis: How to Spot Stage 3 in Real Time
View on Substack ↗

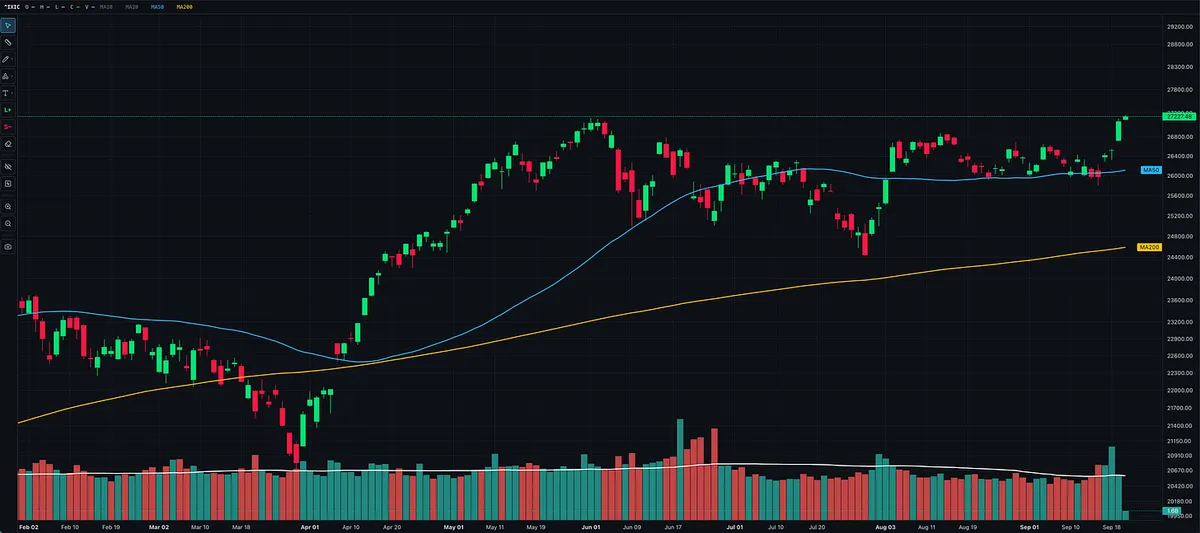
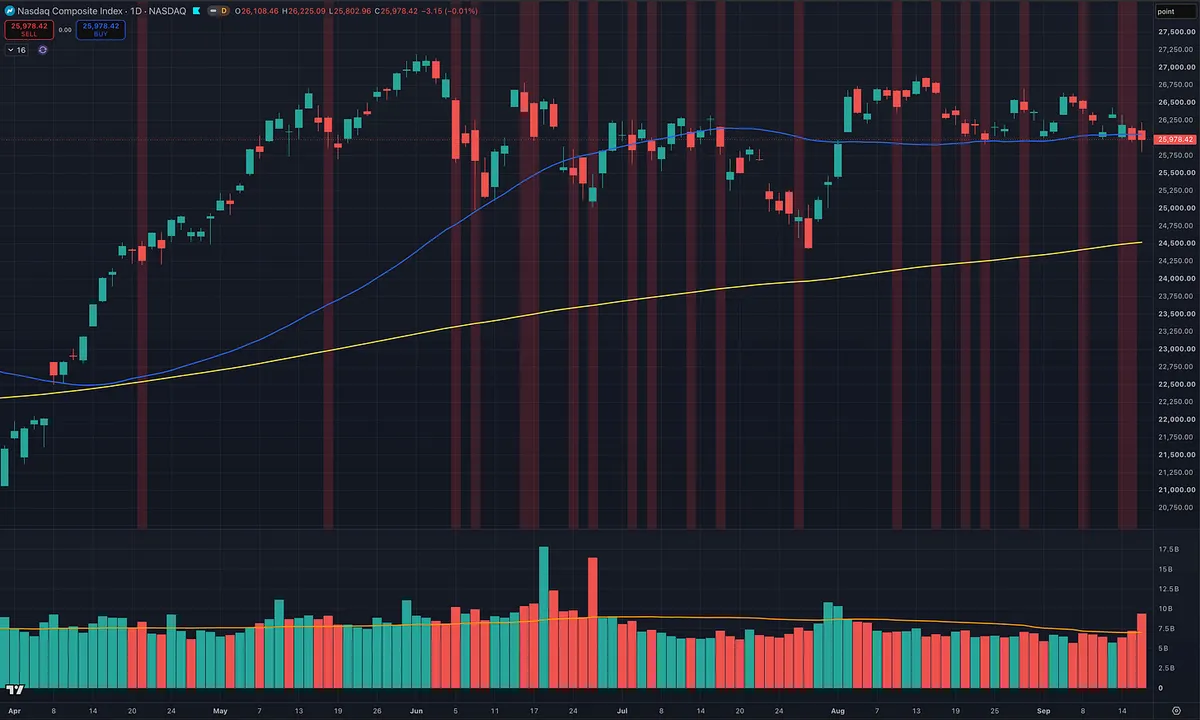
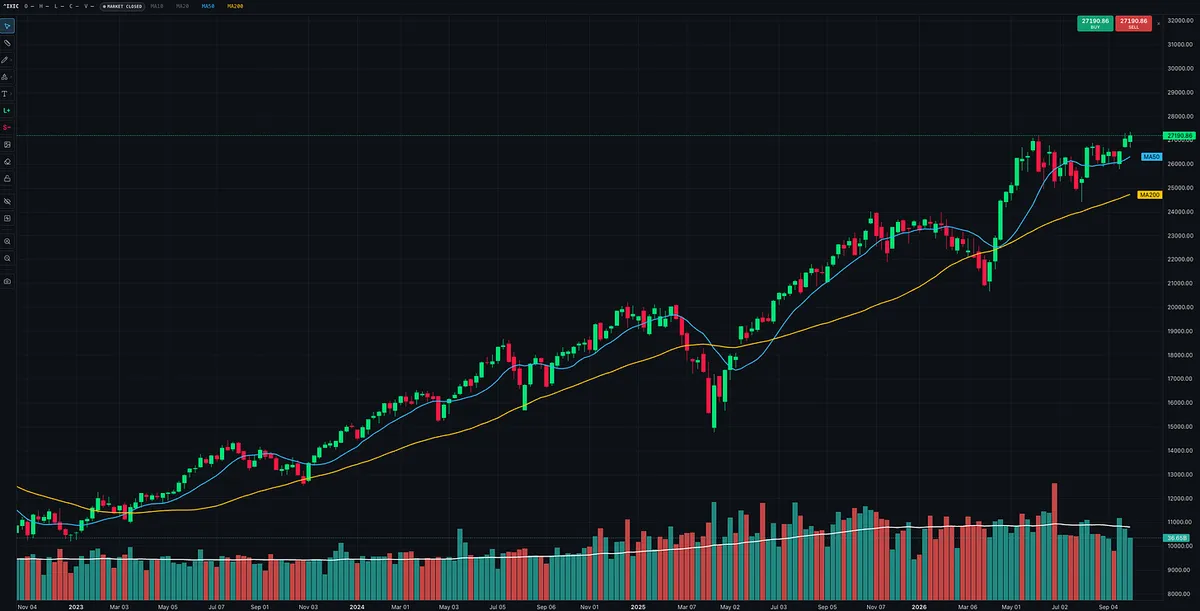
🚨 Attention: The Nasdaq Composite is at an all-time high. That’s telling you something.

After months of sideways trading, the index is pushing above its prior peak and trading above its 50-day and 200-day moving averages. That is a meaningful improvement in price action, and it deserves our attention.

William O’Neil emphasized studying the major indexes’ price and volume action to determine the market’s direction. In How to Make Money in Stocks, he writes: “Learn to accurately read what the market is actually doing each day as it is doing it.”

That means being willing to change our outlook as the evidence changes. If a sideways market has kept us cautious, a move into all-time highs is a reason to reassess. Our opinions have to remain flexible.

Now I’m watching whether the Nasdaq holds this breakout into the close, whether volume expands versus the prior session, and whether leading stocks confirm the strength by breaking out of sound bases on strong volume.

The index is showing strength. Let the quality of the setups and the success of our trades determine how aggressively we respond.

View on Substack ↗

Growth Stocks Took the Wheel Today

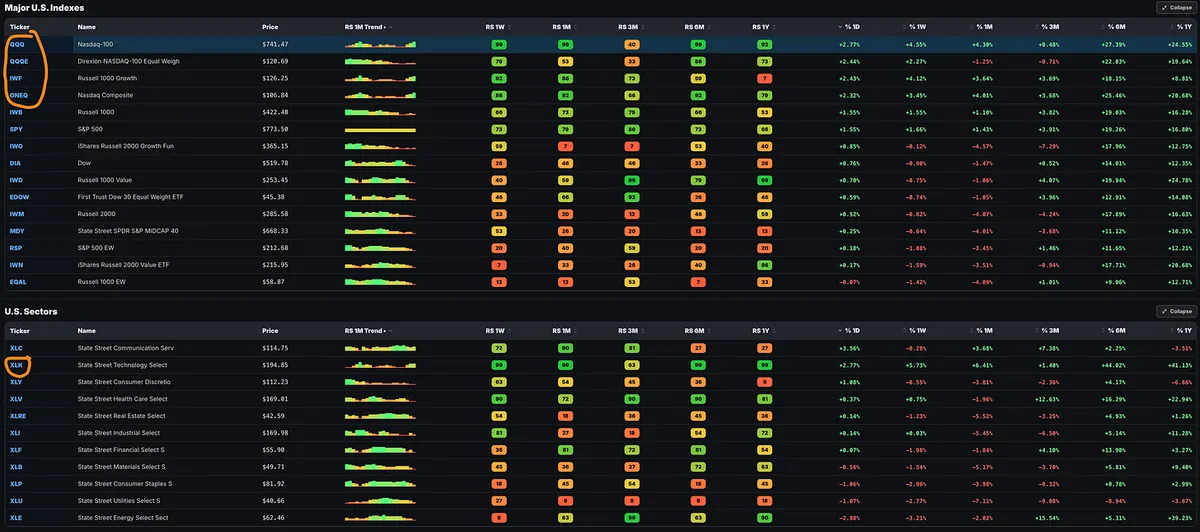
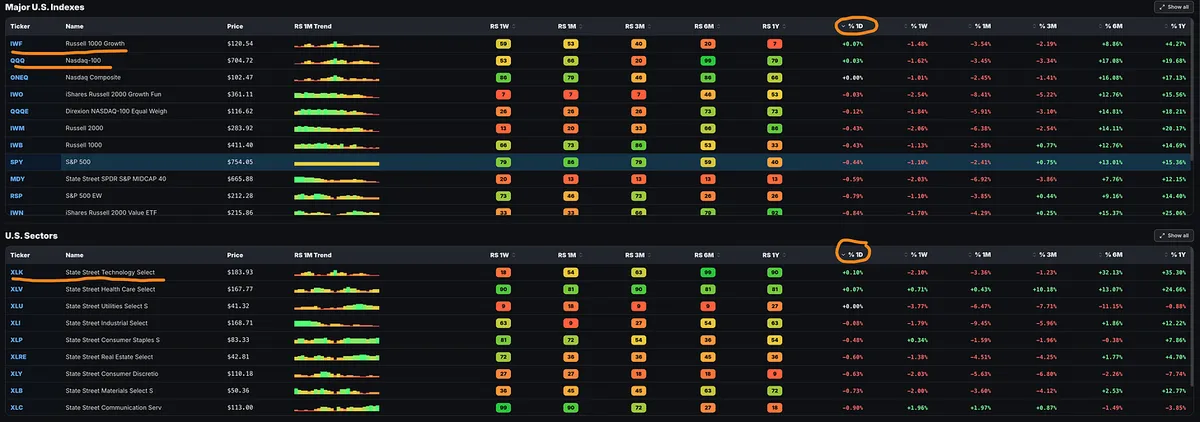
Nice day today, especially in growth and technology. A look at MTS Velocity’s RS Dashboard shows where the strength showed up:

  • Nasdaq-100 $QQQ: +2.77%

  • Nasdaq-100 Equal Weight $QQQE: +2.44%

  • Russell 1000 Growth $IWF: +2.43%

  • Nasdaq Composite ETF $ONEQ: +2.32%

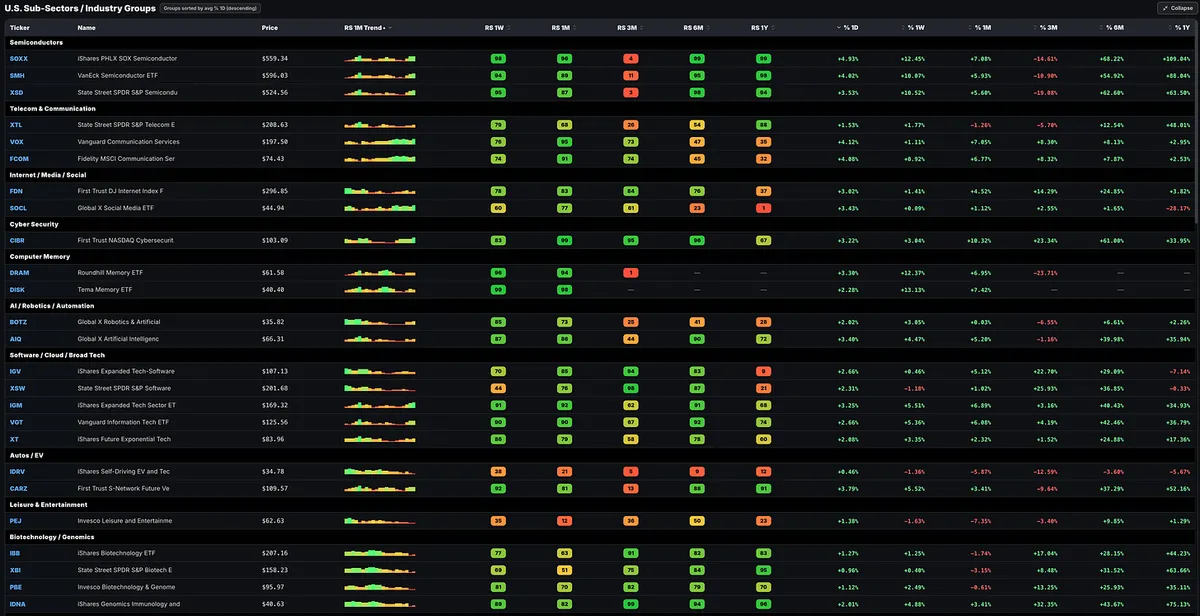
Semiconductors led the industry groups, with $SOXX gaining 4.93% and $SMH 4.02%. Memory, cybersecurity, internet, and software participated too. At the sector level, Communication Services +3.56% and Technology +2.77% led the way.

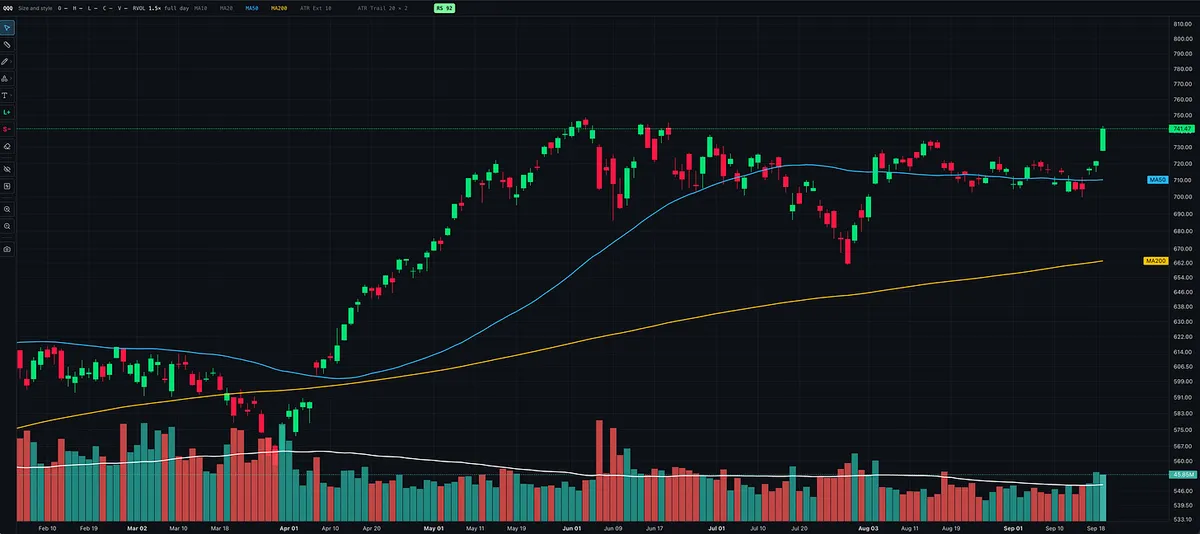
The QQQ chart is looking good: a strong move back toward the top of its multi-month range on above-average volume, putting the prior highs within reach.

Encouraging action in growth. Now I’m watching whether Nasdaq Composite and QQQ can clear those prior highs and whether more individual stocks can complete their bases and break out alongside it.

View on Substack ↗

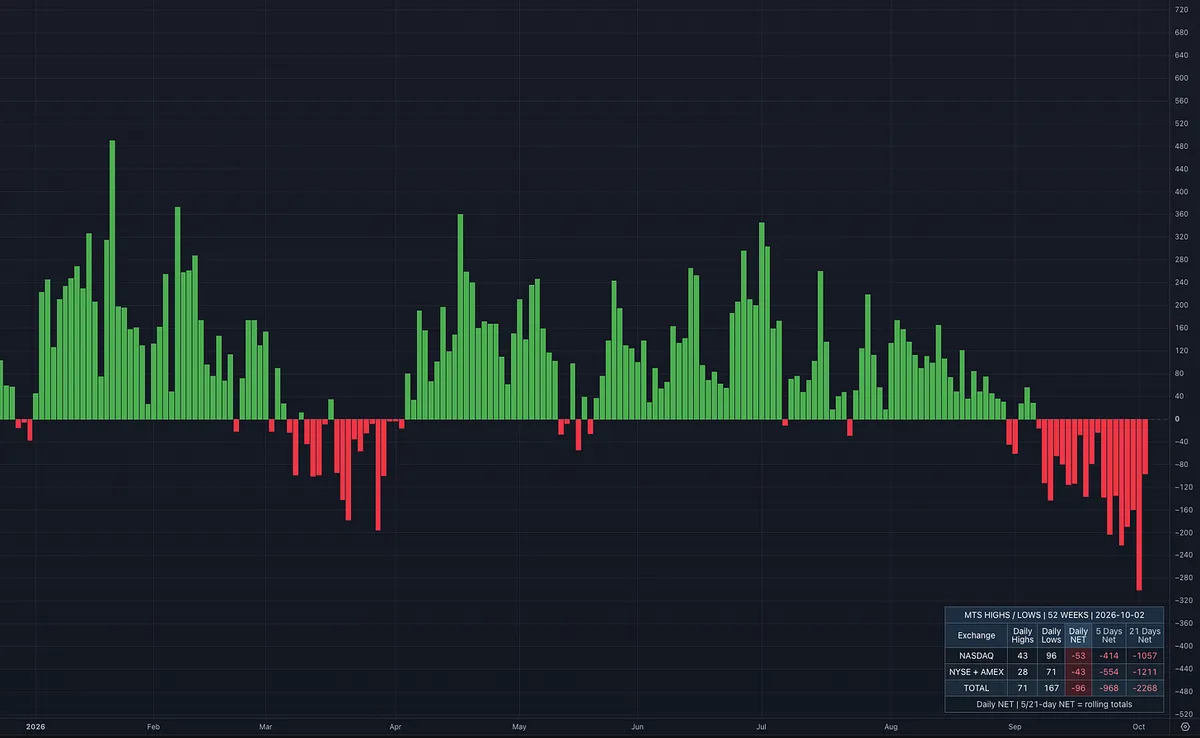
Nine Straight Sessions of More New Lows Than New Highs

The market’s underlying health has been deteriorating.

In How to Make Money in Stocks, William O’Neil explains that his research found stocks making new highs tended to continue higher, while stocks making new lows tended to continue lower. He used IBD’s new-high list to help identify leading stocks and the sectors driving a bull market.

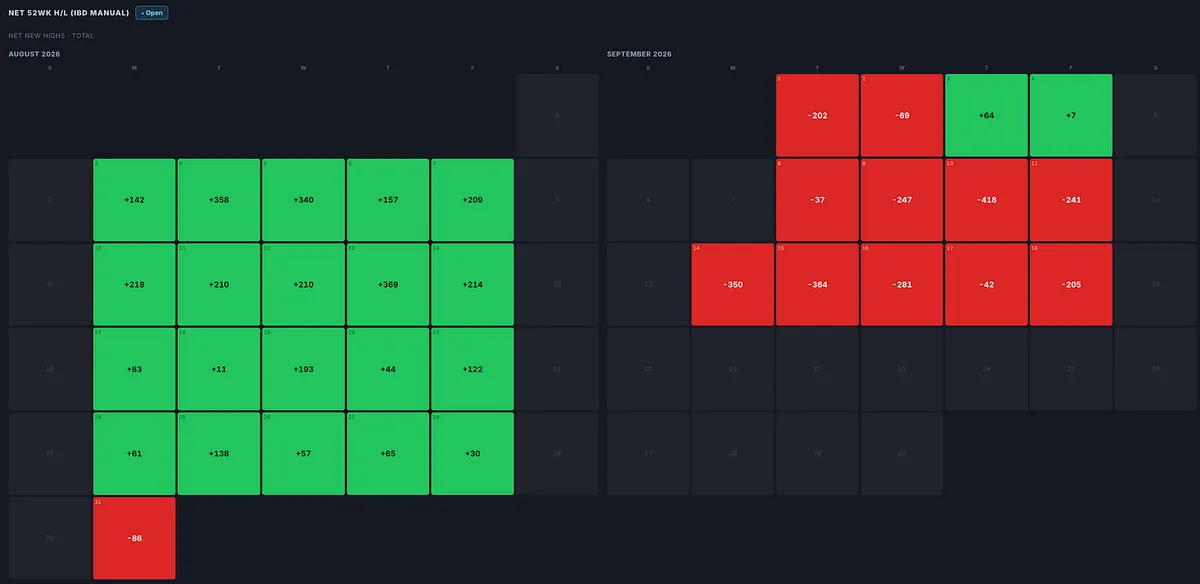
That’s why we track net 52-week new highs: the number of stocks making new highs minus those making new lows. It helps reveal whether strength is spreading beneath the major indexes or weakness is becoming more prevalent.

The combined readings across Nasdaq, NYSE, and AMEX show a clear shift:

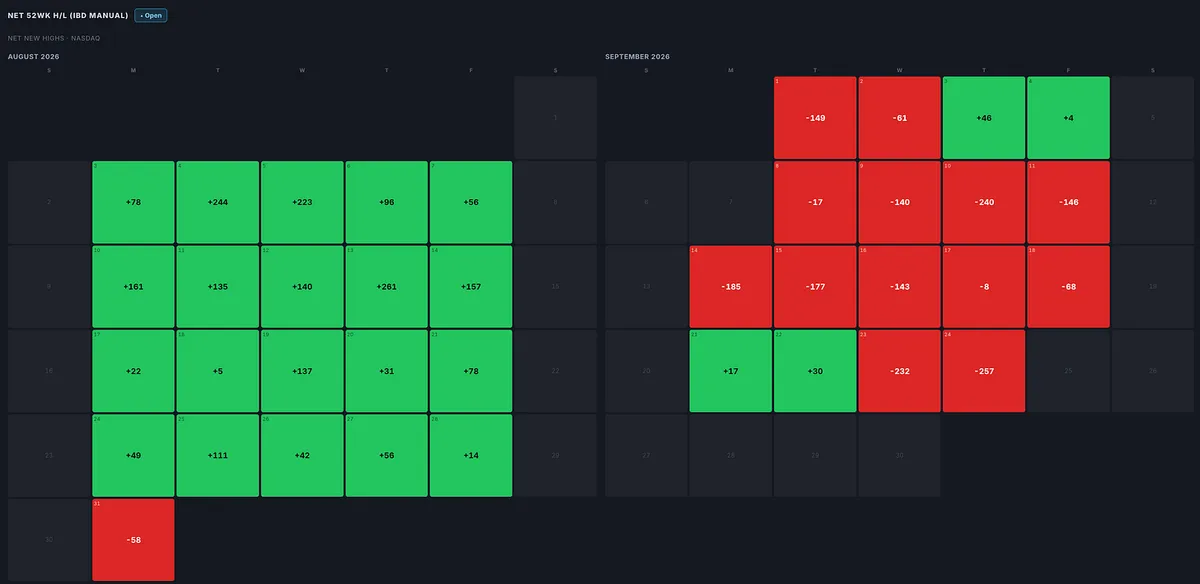
  • August 3–28: Positive in all 20 trading sessions.

  • September 1–18: Negative in 11 of 13 sessions.

  • Through September 18: Nine consecutive sessions with more new lows than new highs.

On September 10, new lows exceeded new highs by 418. On September 18, the deficit was still 205.

Sideways indexes can make the market look relatively stable, but when more stocks consistently reach annual lows than annual highs, that stability deserves closer scrutiny. Large stocks can support the indexes while weakness develops underneath.

We want quality stocks reaching new highs, supported by other leaders and successful breakouts. Persistent negative breadth gives us less confidence that the broader market will support those moves.

O’Neil placed the greatest weight on index price and volume action and the behavior of leading stocks. These breadth readings add to that assessment.

View on Substack ↗

Seven Distribution Days. O’Neil Took This Seriously.

My current distribution-day count over the last 25 trading sessions:

  • Nasdaq Composite: 6

  • S&P 500: 7

  • Nasdaq 100: 4

William O’Neil treated repeated distribution as evidence that institutions were selling and the market’s uptrend was becoming vulnerable.

In How to Make Money in Stocks, his down-day rule was specific: an index declines more than 0.2% on higher volume than the previous session. He also recognized distribution through stalling, when heavier volume produces little upward progress.

The market can come under distribution while it is still advancing. That is what makes these warnings easy to overlook.

O’Neil wrote:

“After four or five days of definite distribution over any span of four or five weeks, the general market will almost always turn down.”

He took these signals seriously enough to act.

In his discussion of the 2007 market top, O’Neil explained that investors should have taken some selling action by the fifth distribution day and cut back further after the sixth. By the seventh, he described “seven crucial warnings.”

That historical example does not mean today must unfold like 2007. It shows how much weight he placed on repeated distribution.

Another detail matters:

“It takes only one of the indexes to give you a valid repeated signal of too much distribution.”

The Nasdaq 100’s lower count therefore does not cancel the warnings from the Nasdaq Composite and S&P 500.

Seven distribution days on both of those indexes deserves serious attention.

O’Neil also watched leading stocks closely. Are breakouts working? Are leaders holding support? Are declines attracting heavier volume while rebounds struggle? He considered the behavior of leading stocks the second most important indication of a major market change, after the indexes themselves.

The count belongs alongside that evidence. How closely the distribution days cluster, how the indexes respond, and how your stocks behave all matter.

As those warnings accumulate and price action deteriorates, O’Neil’s approach calls for selling, raising cash, and protecting capital.

You don’t have to know how far the market will fall to recognize when the evidence calls for less risk.

View on Substack ↗

Rates Up. Growth Holds Up.

The initial reaction caught my attention.

The Nasdaq 100 and Russell 1000 Growth led the indexes I track. Technology was the top sector, with strength in memory and semiconductor names.

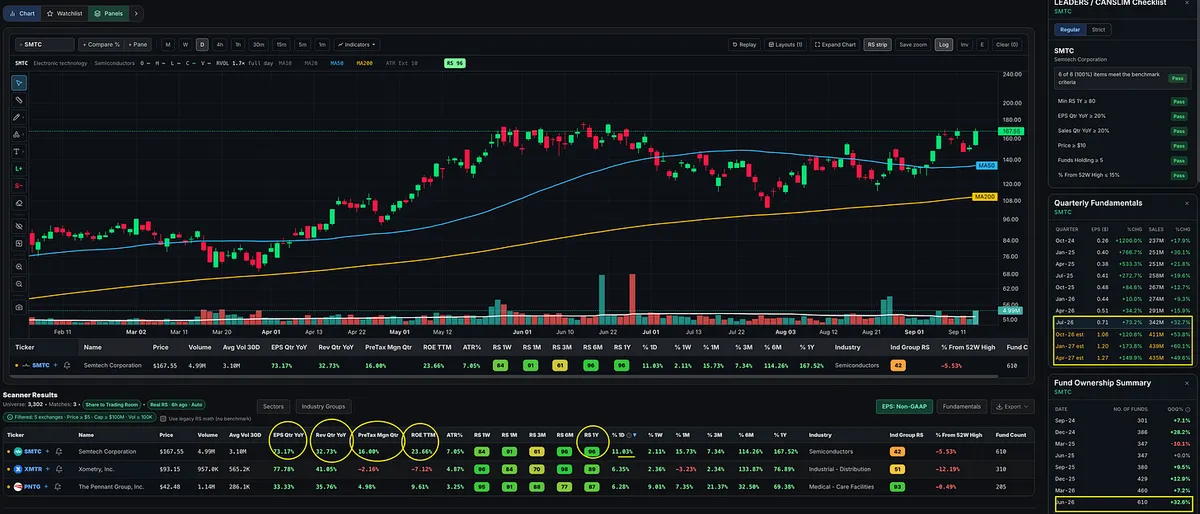
That same theme showed up when I opened the MTS Velocity RS Screener and looked for today’s strong performers meeting my growth-based earnings and sales criteria.

One standout: SMTC, Semtech, up 11.03%.

The numbers behind the move:

  • Quarterly earnings growth: +73.17% year over year.

  • Quarterly sales growth: +32.73% year over year.

  • Return on equity: 23.66%.

  • Quarterly pretax margin: 16%.

  • One-year relative strength rating: 96.

And institutional sponsorship is expanding. The latest reported fund count increased 32.6%.

That’s a semiconductor stock showing strong growth, profitability, high relative strength, and increasing fund participation, gaining 11% with BIG volume on a rate-hike day.

One session doesn’t settle the market’s direction. But seeing the same strength emerge across indexes, sectors, and individual stocks is information worth paying attention to.

View on Substack ↗

The First Rate Hike Matters. Martin Zweig Explained Why.

Today, September 16, the Fed raised rates 0.25 percentage points to 3.75%–4.00%, its first increase since July 2023.

We went from cutting, to holding, to raising.

Even an expected hike changes the monetary backdrop.

This is where Martin Zweig’s Winning on Wall Street deserves another read. In his chapter “Don’t Fight the Fed,” he wrote:

“Generally, a rising trend in rates is bearish for stocks; a falling trend is bullish.”

He also emphasized that the trend in interest rates mattered more than the level itself.

When rates rise, savings accounts, CDs, and Treasury bills can offer higher yields with considerably less risk than stocks. Stocks may still deliver greater returns, but some investors may decide the potential extra gain no longer justifies the additional risk. Meanwhile, businesses face higher borrowing costs that can eat into their profits.

Zweig turned that observation into a specific rule.

In his Fed Indicator, a rate hike clears any remaining positive points in the affected component and adds one negative point. Each negative point expires after six months unless a reversal toward easing in that component removes it sooner. His revised rules explicitly included changes in the federal funds rate.

The positive points awarded for earlier cuts also expire according to his rules, even when rates remain unchanged.

In Zweig’s model, earlier easing does not provide permanent bullish credit. That credit fades with time, and a hike wipes out whatever remains in that component.

And with the 10-year Treasury yield around 5%, longer-term borrowing costs deserve attention alongside the Fed’s decision.

Zweig’s work earned respect from some exceptional traders. In Market Wizards, Michael Marcus, Bruce Kovner, Richard Dennis, Paul Tudor Jones, and David Ryan all praised or recommended his work. Marty Schwartz also described consulting with Zweig.

During Marcus’s interview, Jack Schwager observed that Zweig was probably the person most mentioned by the traders he interviewed.

One hike does not automatically mean a bear market starts today. Zweig also followed the tape, combining monetary conditions with market momentum in his broader model.

William O’Neil made an important distinction in How to Make Money in Stocks. He considered Fed rate changes valuable and discussed three successive significant hikes as a historical warning. But he explicitly cautioned:

“Fed rate changes, however, should not be your primary market indicator because the stock market itself is always your best barometer.”

That is how I’m applying these lessons: give the change in policy weight, evaluate it alongside breadth, leadership, and credit conditions, and let the indexes’ price and volume action and the behavior of leading stocks guide my trading decisions.

I remain open to a rally despite the hike. How stocks behave in the coming days will help us judge how well the market is absorbing tighter policy. A rally that gains participation and shows accumulation would tell us something different from a weak bounce that quickly fails.

We have to remain open to that evidence while recognizing that the monetary backdrop has changed.

Although today’s rate hike was widely expected, “priced in” does not mean “irrelevant.” Yesterday’s easing is no reason to ignore today’s tightening.

View on Substack ↗

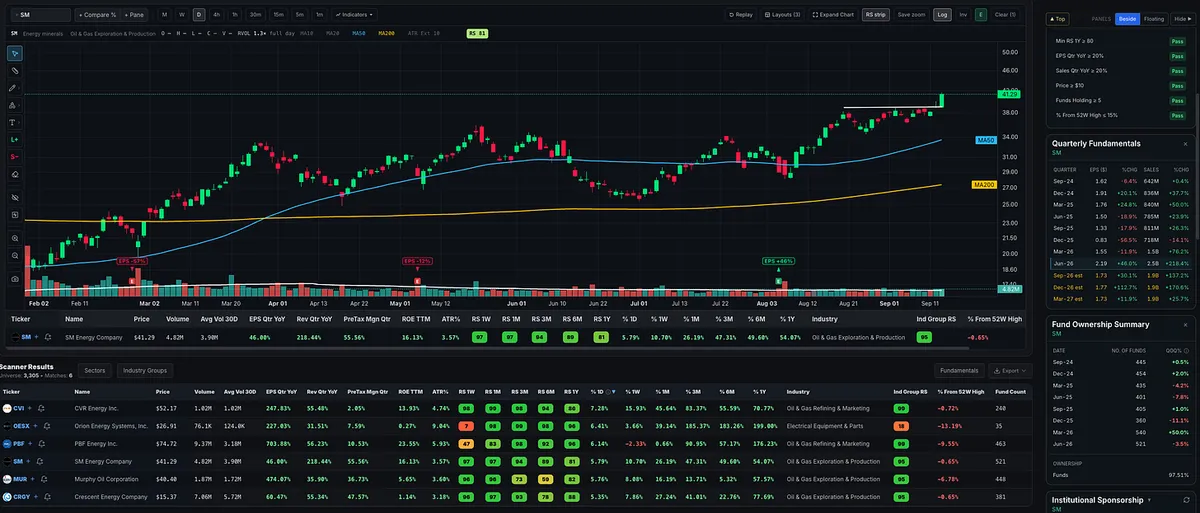
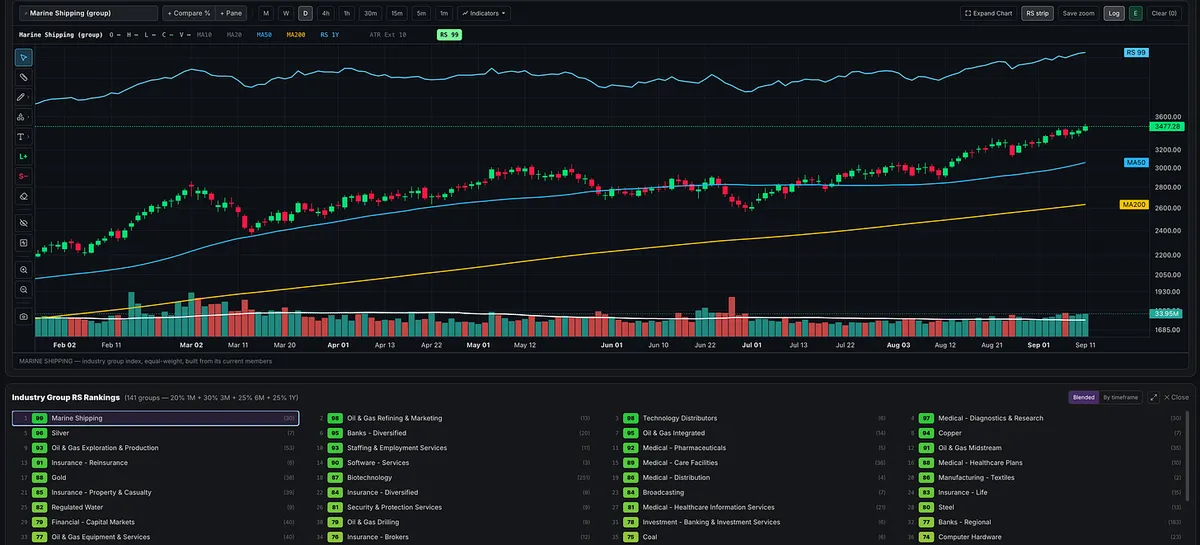
I Asked MTS Velocity for Growth. It Gave Me Oil.

I started with my normal tradable universe of roughly 3,300 NYSE and Nasdaq stocks, after basic price, liquidity, and market-cap filters.

Then I ran a simple scan in MTS Velocity: show me stocks moving higher that also have high relative strength, big earnings growth, big sales growth, and are within 15% of their 52-week highs.

Almost every stock that made the final list was oil and gas.

Not AI. Not software. Not semiconductors.

Oil and gas.

Your stock screens will tell you what is actually happening in the market more than any headline, narrative, or opinion ever could.

View on Substack ↗

Watch What They Do. Not What They Say.

People ask why I pay more attention to the put/call ratio (PCC) than popular sentiment surveys.

It’s the same reason I study price instead of letting someone on television tell me what to think.

I care less about what investors say and more about what they actually do with their money.

The PCC compares put option activity with call option activity. Higher readings can reflect greater fear or caution, while lower readings can reflect greater optimism. It isn’t perfect, but it gives me a window into actual market behavior rather than simply asking investors how they feel.

The VIX gives me another perspective. It reflects the volatility being priced into S&P 500 options. It isn’t a direct measure of money flowing into or out of the market, but it shows what options market participants are actually pricing, rather than what they’re telling a survey.

I use both for context, not as standalone buy or sell signals.

Price still gets the final vote.

And this goes far beyond indicators.

Trading has a way of teaching you very quickly how much of what people say is bullshit. A compelling story is not evidence. Someone sounding certain does not make them right. If you can easily be influenced by what everyone around you thinks, trading is going to be a very difficult game.

Now, you might say: “But you’re a growth momentum trader. Aren’t you buying stocks when everyone else is buying them?”

Sometimes, absolutely.

My style of trading is heavily influenced by William O’Neil, Mark Minervini, Dan Zanger, and David Ryan. I’m looking for growth stocks with characteristics such as big earnings and sales growth, high relative strength, strong price and volume action, leadership within strong industry groups, and proper technical setups.

Sometimes the stock everyone is talking about is exactly the stock I want to own.

I bought NVDA in early 2024 when it was one of the biggest stories in the market because the evidence supported it. Big earnings. Big sales. High relative strength. New highs. A powerful market theme. A strong industry group.

It met the criteria.

Other times, the stock everyone is talking about doesn’t meet my criteria, and I’m perfectly comfortable watching it go without me.

The purpose isn’t to disagree with the crowd.

That’s just another form of letting the crowd control your thinking.

The goal is to develop enough independence that whether everyone agrees with you or disagrees with you becomes largely irrelevant.

You follow the evidence.

You follow your process.

And you make your own decision.

There’s a funny but revealing YouTube clip I’m going to share below showing just how powerful the human desire to conform can be. People begin standing up simply because everyone around them is standing up.

As you watch it, ask yourself:

Would I eventually stand up too, even if I had no idea why everyone was doing it?

Then ask yourself the trading version.

Am I buying because I see a legitimate opportunity, or because everyone else is excited?

Am I selling because the evidence changed, or because everyone around me is scared?

Am I holding because my analysis still supports the trade, or because someone else keeps reassuring me?

Trading can be a lonely game. Even when you have a great community around you, ultimately it’s you, your decisions, and the market.

You have to learn to lead yourself.

Let the crowd have its opinions. Let your process guide your decisions.

https://youtu.be/X6kWygqR0L8?si=8LV0dgTlNFxQ_DpN

youtube.comBrain Games Conformity Waiting Room
View on Substack ↗

Momentum and trend have worked for more than 100 years.

They’ve been studied academically, traded successfully by some of the greatest individual traders, and used systematically by major firms for decades.

That doesn’t mean they work all the time.

There are periods when momentum dominates and periods when it struggles. But over the long run, momentum and trend have continued to reappear because the forces behind them haven’t disappeared: human behavior, institutional money flows, and supply and demand.

The mistake is thinking that means you trade every market the exact same way.

Different environments favor different setups.

There are markets where momentum is working, but pullbacks, low cheats, and middle cheats are producing most of the opportunities.

Then there are markets where flat-base breakouts, VCPs, and stocks pushing into new highs are dominating.

Same underlying philosophy.

Different execution.

That’s why I believe in having a playbook, not just one setup.

Know your strategy. Know the market environment. Then adapt your execution to what the market is actually rewarding.

View on Substack ↗

Before You Pick the Stock, Understand the Market.

When I read Market Wizards, one name kept catching my attention: Martin Zweig.

Michael Marcus, Bruce Kovner, Richard Dennis, Paul Tudor Jones, David Ryan, and Marty Schwartz all discussed his work, whether through praise for his analysis, recommendations, or direct consultation. That respect across very different trading styles motivated me to read Winning on Wall Street.

Zweig’s work, combined with William O’Neil’s How to Make Money in Stocks, helped shape the weekend analysis behind my Big Picture Market Pulse. O’Neil’s emphasis on market direction, the M in CAN SLIM, is central to that process.

Over the years, I kept encountering the importance of market context across different approaches, from day trading to swing trading and position trading.

Dr. Van Tharp stressed that traders need to understand the conditions in which their strategy works. Expecting the same system to perform well in every market environment is a mistake he repeatedly warned against. His explanation of market types is worth reading.

Even for intraday traders, context matters. Mike Bellafiore, co-founder of SMB Capital and author of One Good Trade, places understanding the big picture at the beginning of his trade-analysis framework in The PlayBook.

That is why I spend time each weekend studying the indexes, industry groups, market indicators, relative strength leadership, and macro backdrop. It helps me decide whether conditions support my style of trading.

A promising stock setup still needs to be considered in the environment surrounding it.

Before you dive into screening stocks and planning next week’s trades, take a step back. Look at what the broader market is doing, whether leading stocks are following through, and how your own trades are behaving.

That preparation is the purpose behind every Big Picture Market Pulse.

View on Substack ↗

Your Last Five Trades May Tell You More About the Market Than the Index

William O’Neil made a point that I think is one of the most useful market indicators there is:

Pay attention to what is happening with your own recent trades.

If you’ve bought four or five quality setups and none of them are gaining traction, breakouts are failing, stocks are reversing after entry, and positions that should be working simply aren’t, the market may be telling you something before it becomes obvious in the indexes.

There is an important caveat.

This only works if you have learned how to trade, have a defined system, are selecting legitimate setups, managing risk correctly, and have your emotions under control.

If you’re chasing extended stocks, forcing trades, buying mediocre setups, or breaking your rules, your results may be telling you more about your trading than the market.

But once your process is sound and repeatable, I believe the behavior of your individual stocks is one of the best market indicators you can have.

This is also why Mark Minervini talks so much about watching individual stocks. The indexes can look healthy while fewer leaders are setting up, breakouts are failing, and your initial positions aren't gaining traction. Conversely, leading stocks can begin acting well before the indexes make the turn obvious.

The stocks often have the final word.

If I put out a few pilot positions and they immediately start working, holding gains, and offering additional opportunities, I can progressively increase exposure.

If those positions repeatedly fail, I don't need to argue with the market.

I back off.