Momentum Trading Strategy

Notes

Market Conditions

Reading the overall market and deciding how aggressive to be.

Showing 1–5 of 5 notes

$WDC ×
View on Substack ↗

The Market Shift Was Hiding in the Screens

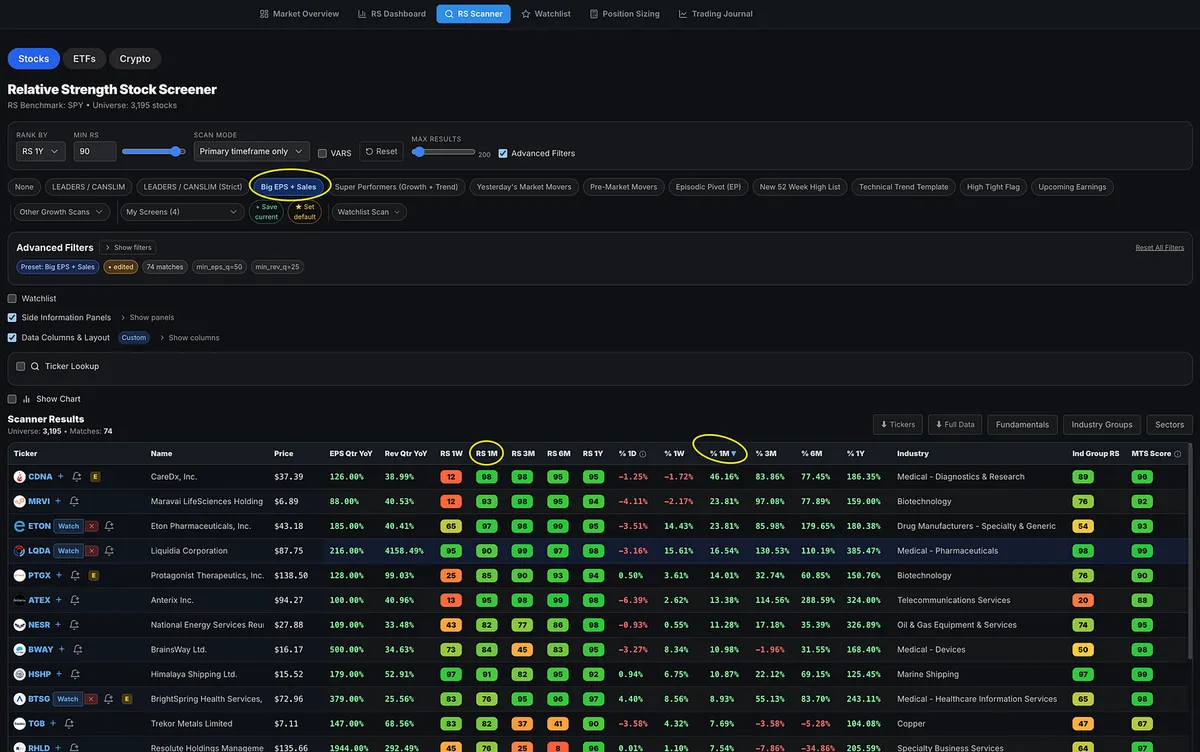
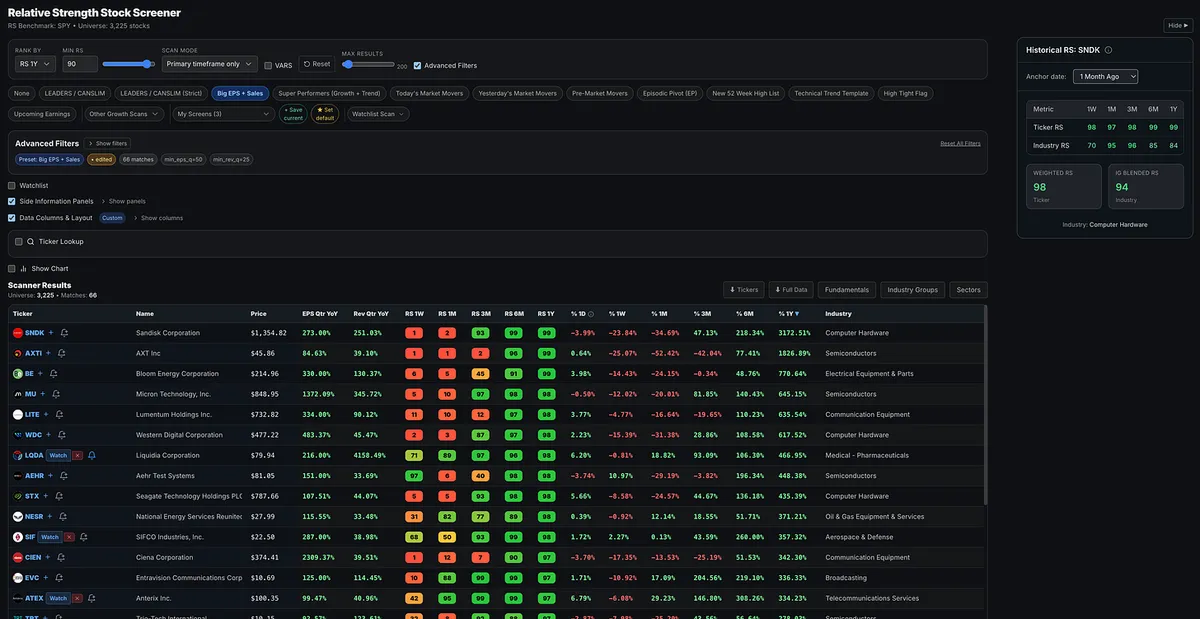
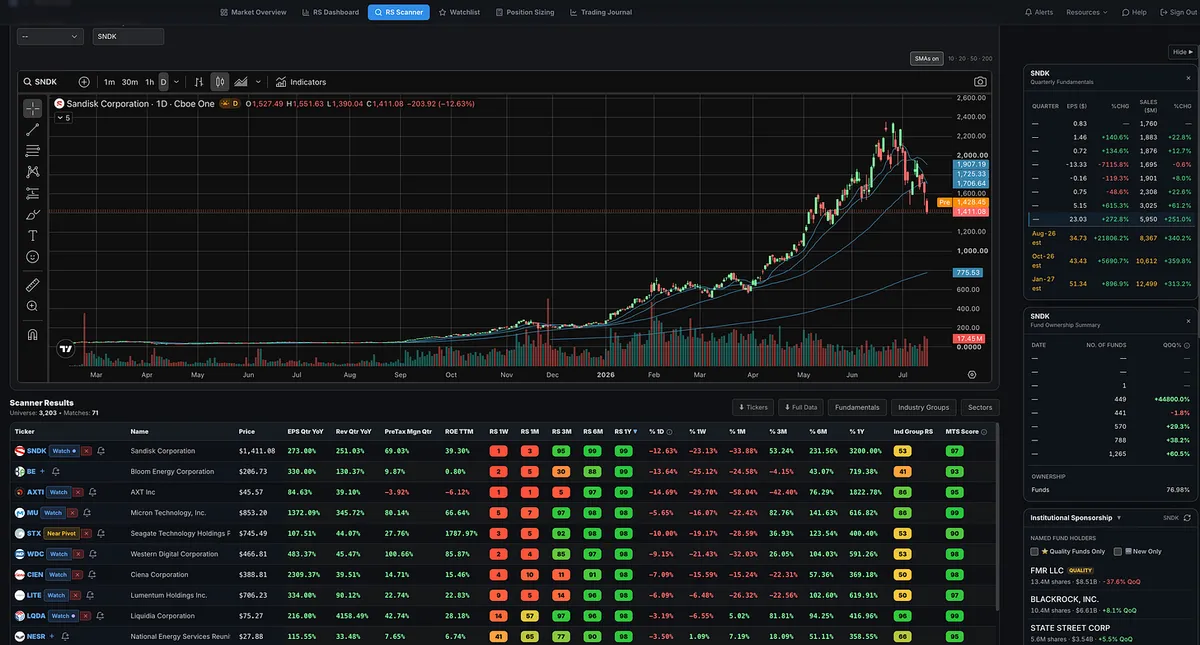
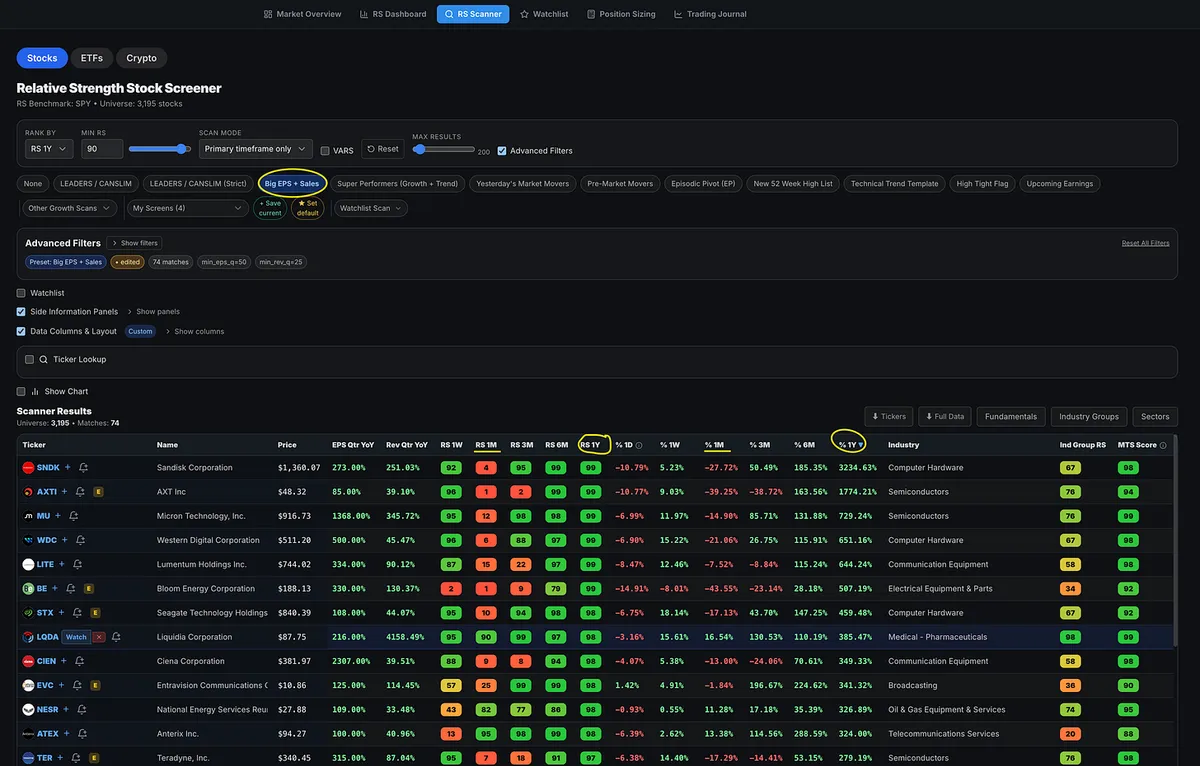
One of my favorite scans, and one I ran for years in MarketSurge, is the Big EPS and Sales screen. I now run the same scan inside the Momentum Trading Strategy software.

When you sort the results by one-year relative strength, the familiar leaders dominate: SNDK, MU, LITE, WDC, WTX, TER, etc.

The strongest groups are also the ones we have become accustomed to seeing: semiconductors, computer hardware, telecom, and communications equipment.

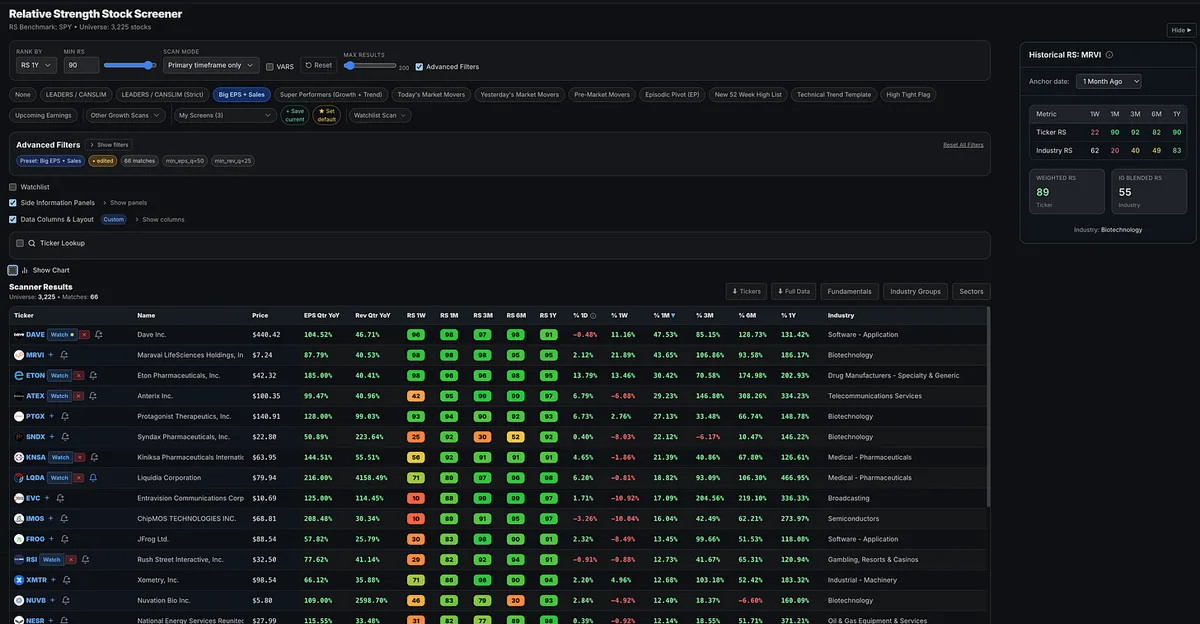
But sort the exact same screen by one-month relative strength, and the picture completely changes.

Now you see medical, biotechnology, pharmaceutical, oil and gas, and marine shipping names moving toward the top.

This shift was visible in the individual stock screens weeks ago.

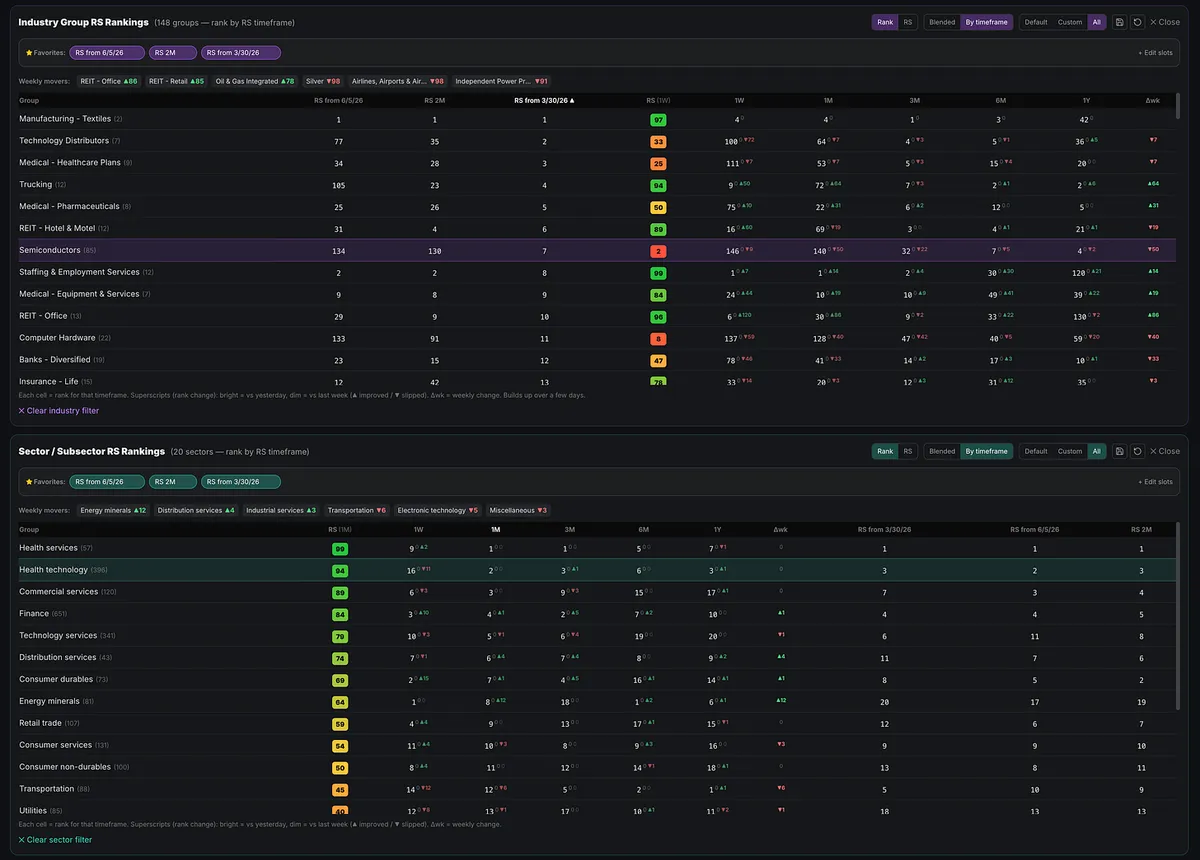
When the indexes, sectors, industry groups, and individual stock screens all begin telling the same story, you are no longer guessing whether leadership is changing.

You are watching it happen in real time.
View on Substack ↗

Leadership changes before most traders notice.

Run the Big Earnings and Big Sales screen, then compare one-year relative strength with one-month relative strength.

The shift is unmistakable.

Many of the stocks that dominated the last year still carry elite long-term RS ratings, but their short-term rankings have collapsed:

SNDK: 1yr RS = 99 / 1m RS = 2

AXTI: 99 to 1

MU: 98 to 10

WDC: 98 to 3

LITE: 98 to 10

CIEN: 97 to 12

At the same time, biotechnology, pharmaceuticals, software, and other emerging groups are moving toward the top of the screen.

That is what leadership rotation looks like in real time.

The market doesn’t send a memo. It leaves clues in relative strength, and industry-group rankings.

View on Substack ↗

What Leader Is Still Standing?

The market looks ugly, but the individual stock scans may look even worse.

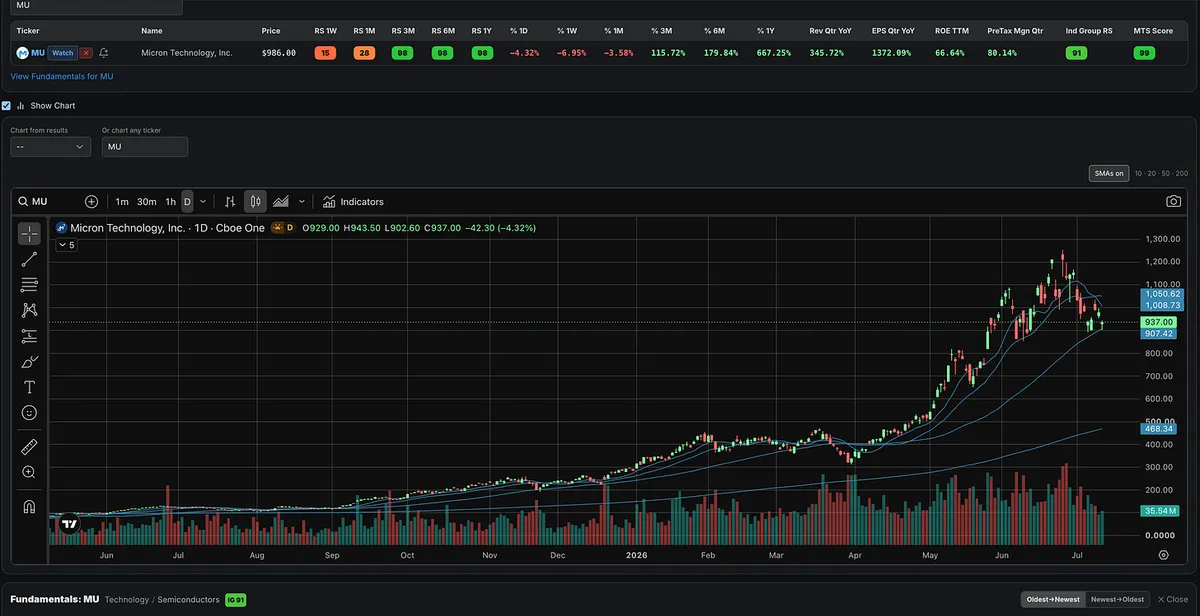
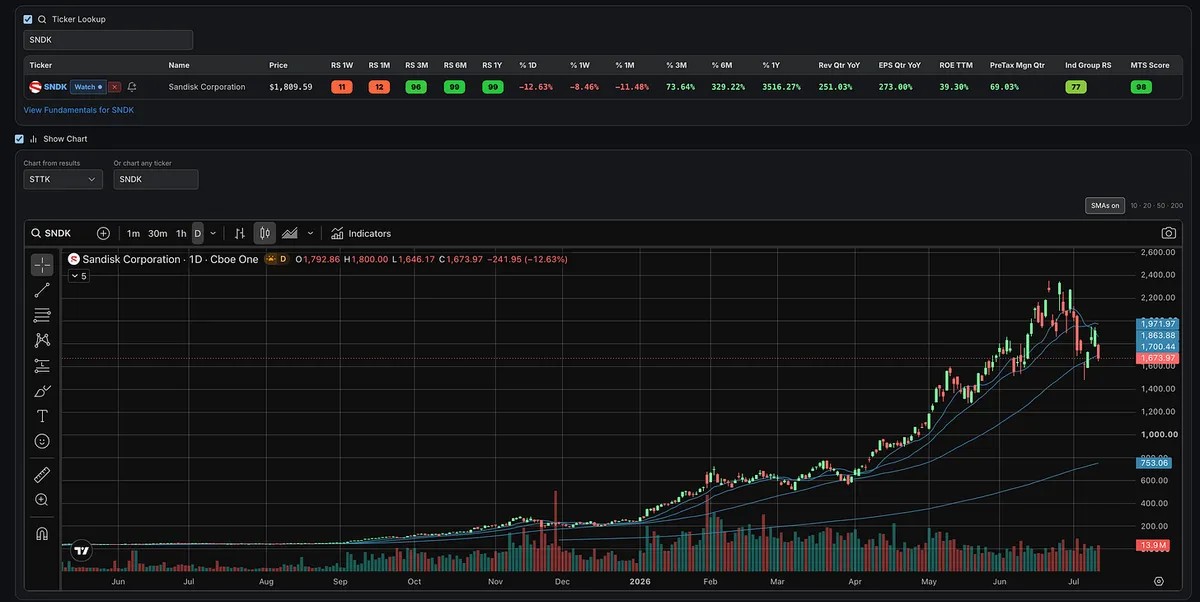
Many of the leading stocks from the past year have suffered meaningful technical breakdowns. With SNDK now confirming its breakdown below the 50-day moving average, it joins MU, STX, WDC, and a growing list of former leaders that have lost important support.

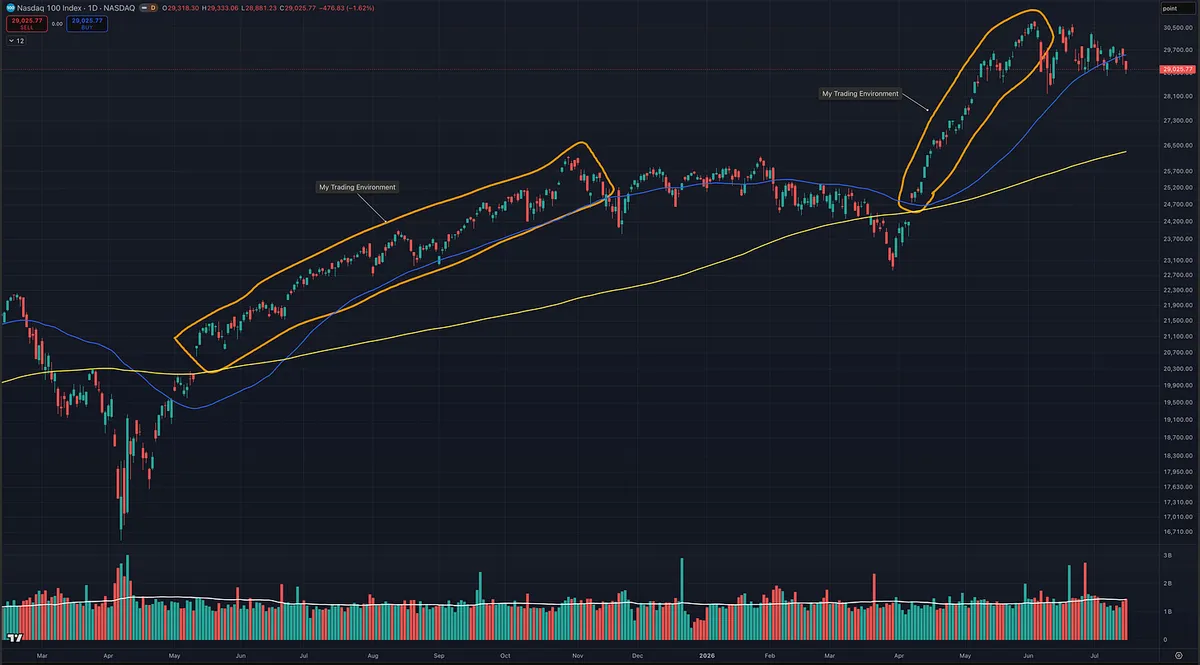
Since the market set its low on March 30 and began a new Stage 2 uptrend, which leaders are actually still standing?

Post a chart of a leading stock in a leading industry group that has not suffered a meaningful technical breakdown. Let’s see which former leaders are still holding up, if there are any.

View on Substack ↗

Nothing Lasts Forever. Don’t Fall in Love With Any Stock.

Some of the market’s biggest winners over the past year have now broken down. At least for the moment, their runs appear to be over.

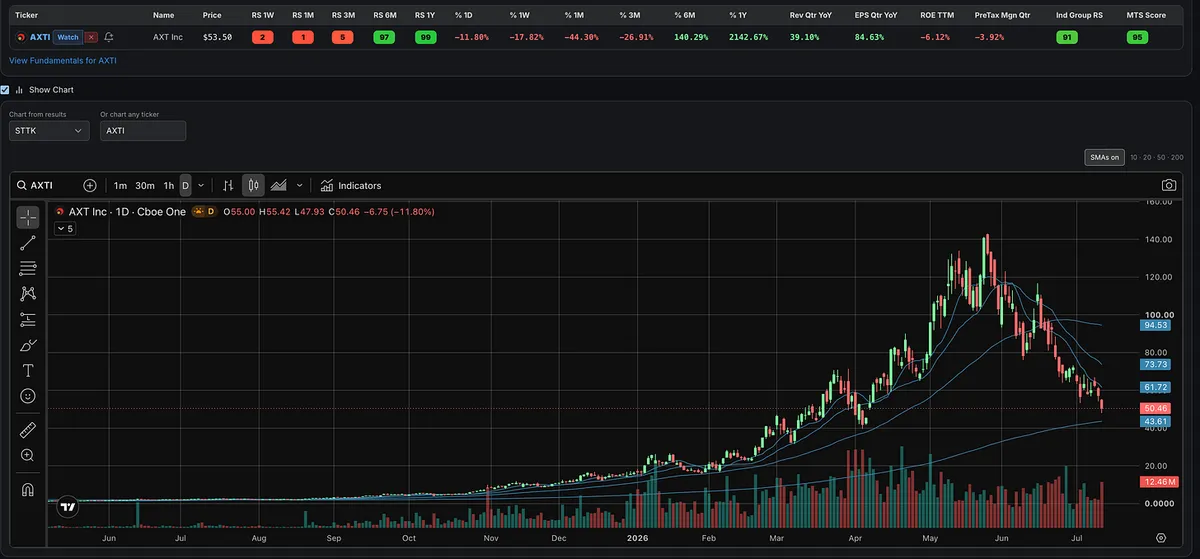
AXTI delivered enormous gains over the last year, but it has now fallen below its 50-day moving average and is heading toward the 200-day. Its 10-day and 20-day lines are declining, and the 50-day is beginning to roll over.

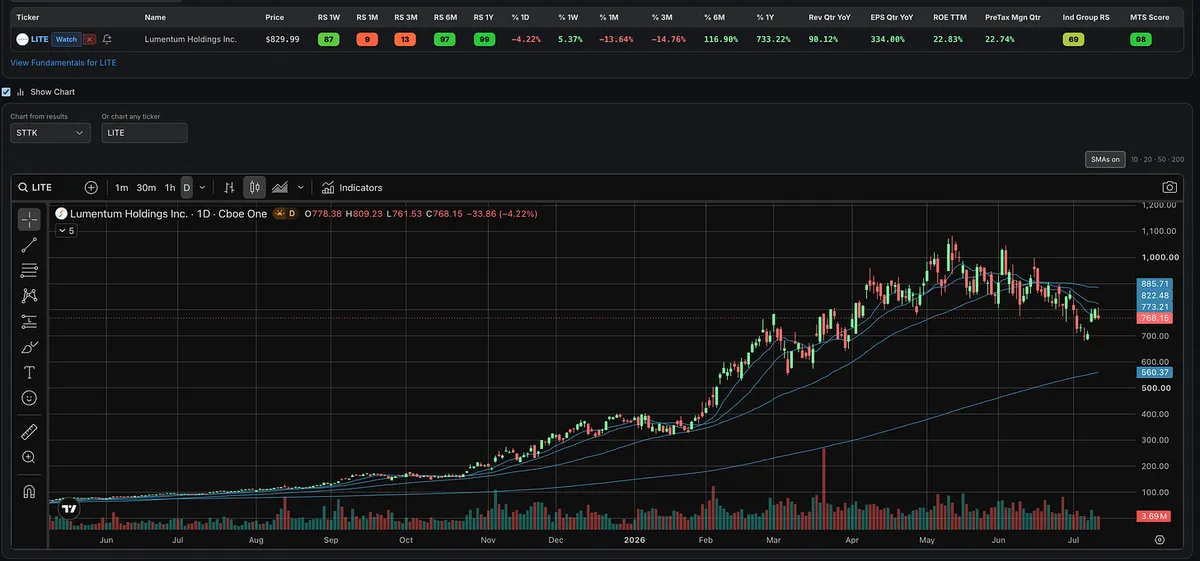
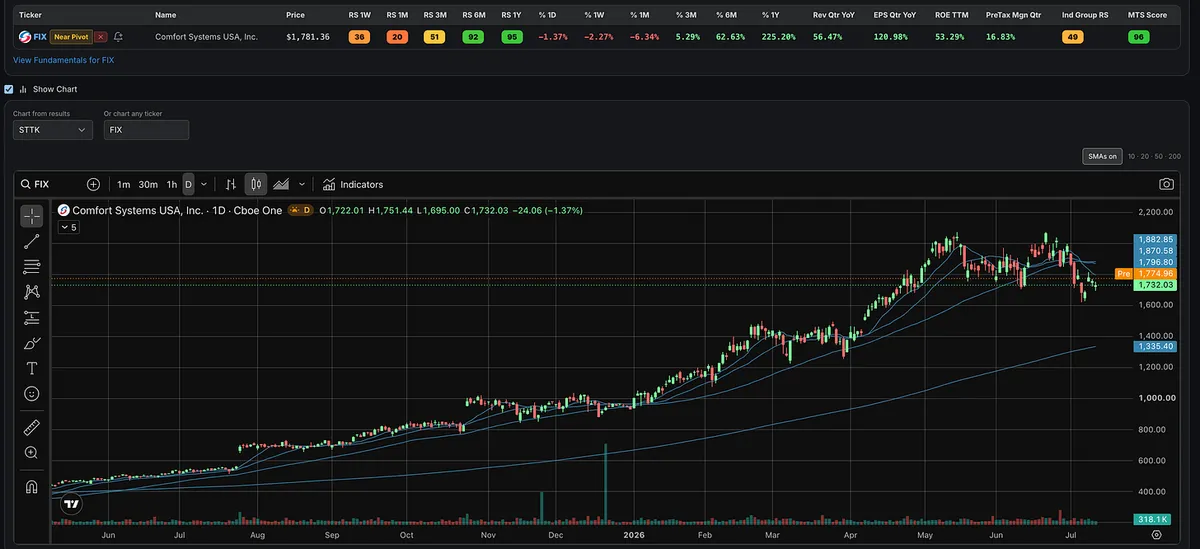
LITE, CIEN, VICR, AAOI, VIAV, TTMI, FIX, COHR, and several other former leaders have also broken down or suffered significant technical damage.

Many more are sitting in the danger zone near their 50-day moving averages. That includes the memory names SNDK, WDC, STX, and MU, along with other hot names from hot groups VPG, MBIS, MXL, LSCC, MRVL, TER, VSH, STM, ADI, INTC, TSM, LRCX, COHU, PDFS, and others.

The bottom line is that many of the stocks that have driven this market, particularly the memory, semiconductor, and telecom names, have either already broken down or are now testing a critical area around their 50-day lines.

I have not needed to share many new tickers from week to week because the same names I have discussed throughout the year continued to lead. There was no reason to constantly search for something new when the existing leaders were still working.

But nothing lasts forever.

Many of the stocks that worked all year are now either ending their runs or approaching a decisive point. Do not fall in love with any stock. Respect the price action and let the market tell you whether the trend is still intact.

View on Substack ↗

This Is Why You Track Leadership Before Everyone Else Sees It

On April 8, the market gave us the signal.

We had a follow-through day, the NASDAQ-100 reclaimed key moving averages, including the 50-day and 200-day, and the conversation shifted from defense back toward offense.

But the real edge was not just knowing the market was improving.

The edge was knowing where to look.

When the market gets stronger, I want to be focused on the strongest industry groups and the strongest stocks inside those groups.

That is exactly what we had been tracking for months.

  • Telecom.

  • Computer Data Storage.

  • Semiconductors.

Many of these names were not random new ideas. They had already been showing up in our work, some for months, and some even last year.

So when the market confirmed on April 8, there was no need to bounce around looking for the next hot ticker.

The leadership was already there.

From the April 8 signal to yesterday’s close:

AAOI up 40%

LITE up 12%

CIEN up 12%

VIAV up 30%

SNDK up 81%

WDC up 38%

STX up 53%

TER flat

AEIS down 4%

AEHR up 50%

LRCX up 12%

FIX up 30%

GLW flat

Not every stock works.

That is normal.

But when the market confirms, and multiple stocks from the same leading groups start moving together, that is usually not a coincidence.

That is institutional money flowing into a theme.

Strong market.

Strong industry groups.

Strong stocks.

That is the process.

The goal is not to chase every move.

The goal is to already know where the strength is clustering before the move becomes obvious.