Momentum Trading Strategy

Notes

Market Conditions

Reading the overall market and deciding how aggressive to be.

Showing 1–7 of 7 notes

$MU ×
View on Substack ↗

The Old Leaders Are Waking Back Up

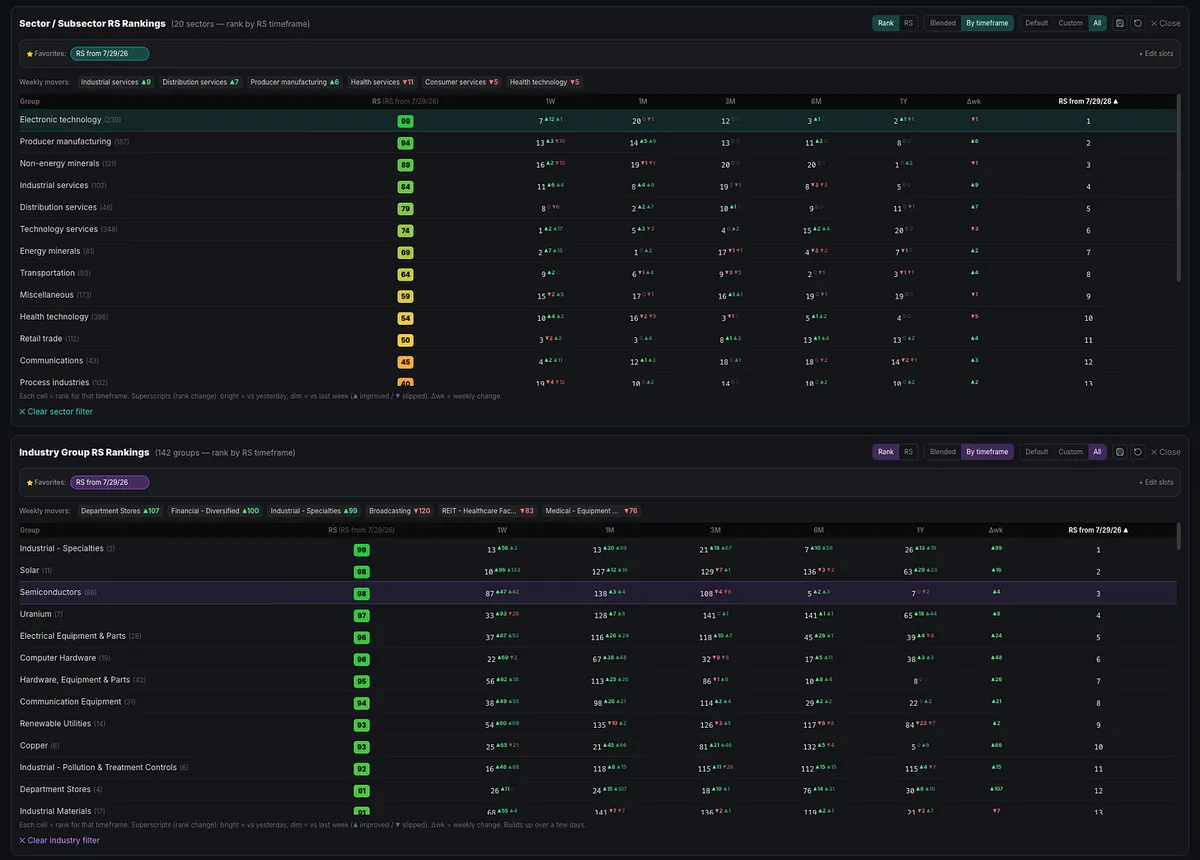
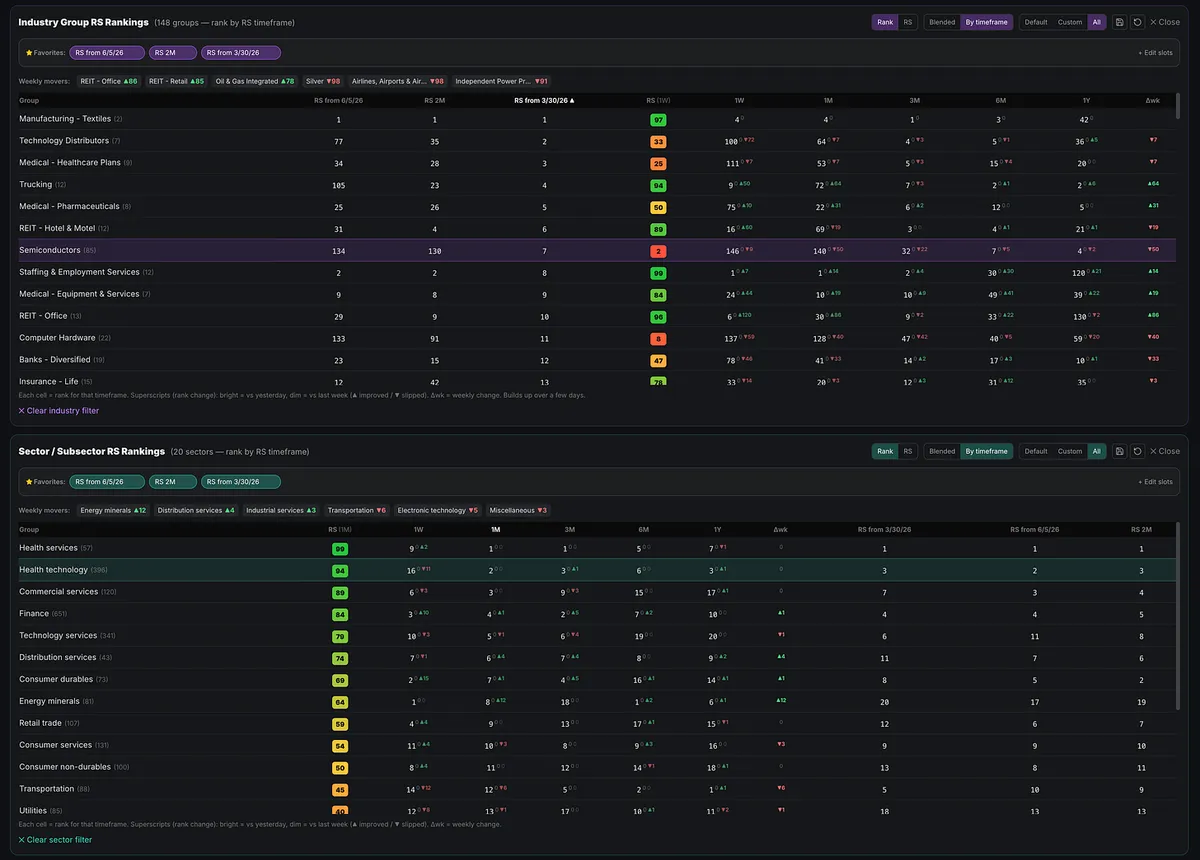
The strongest sectors and industry groups since the July 29 low are many of the same areas that led the market over the past year:

Technology

Semiconductors

Electrical Equipment and Parts

Computer Hardware

Electronic Equipment and Parts

Communication Equipment

These areas took a beating after major runs in many of their leading stocks.

We will see whether the market produces a follow-through day today or in the coming days, and whether these groups can reclaim their prior leadership.

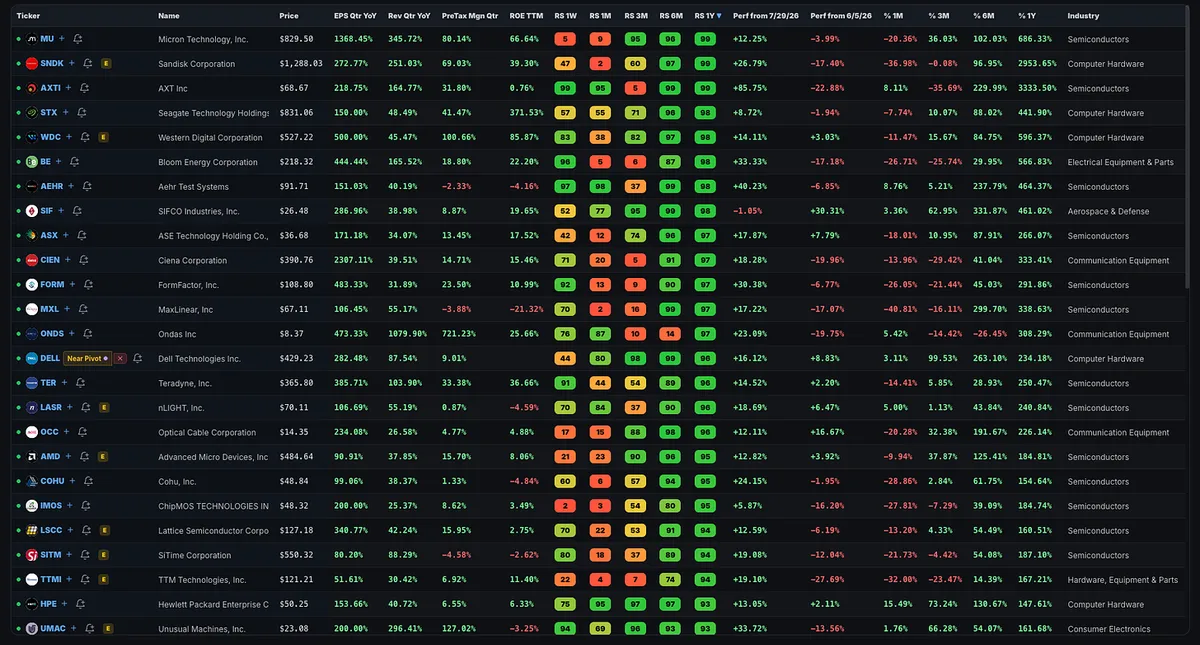
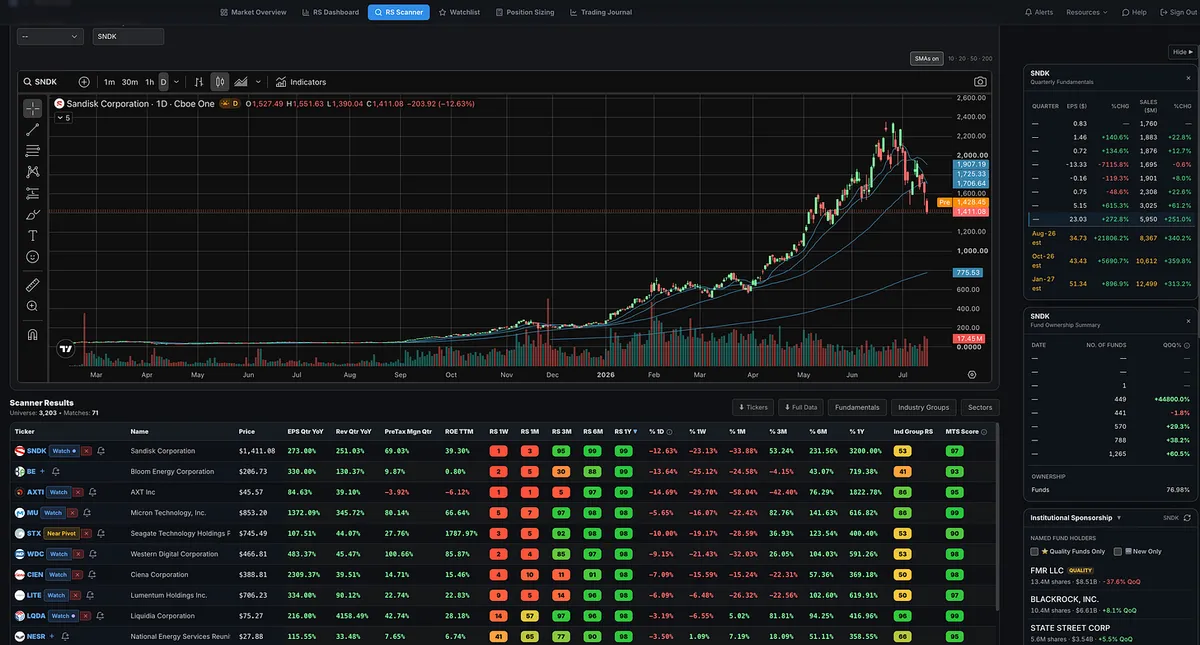
Many of the former leaders, including SNDK, MU, BE, CIEN, and PENG, were hit hard and still have significant ground to recover.

But the areas that led before the correction are once again showing some of the strongest relative performance off the lows.

View on Substack ↗

The Market Shift Was Hiding in the Screens

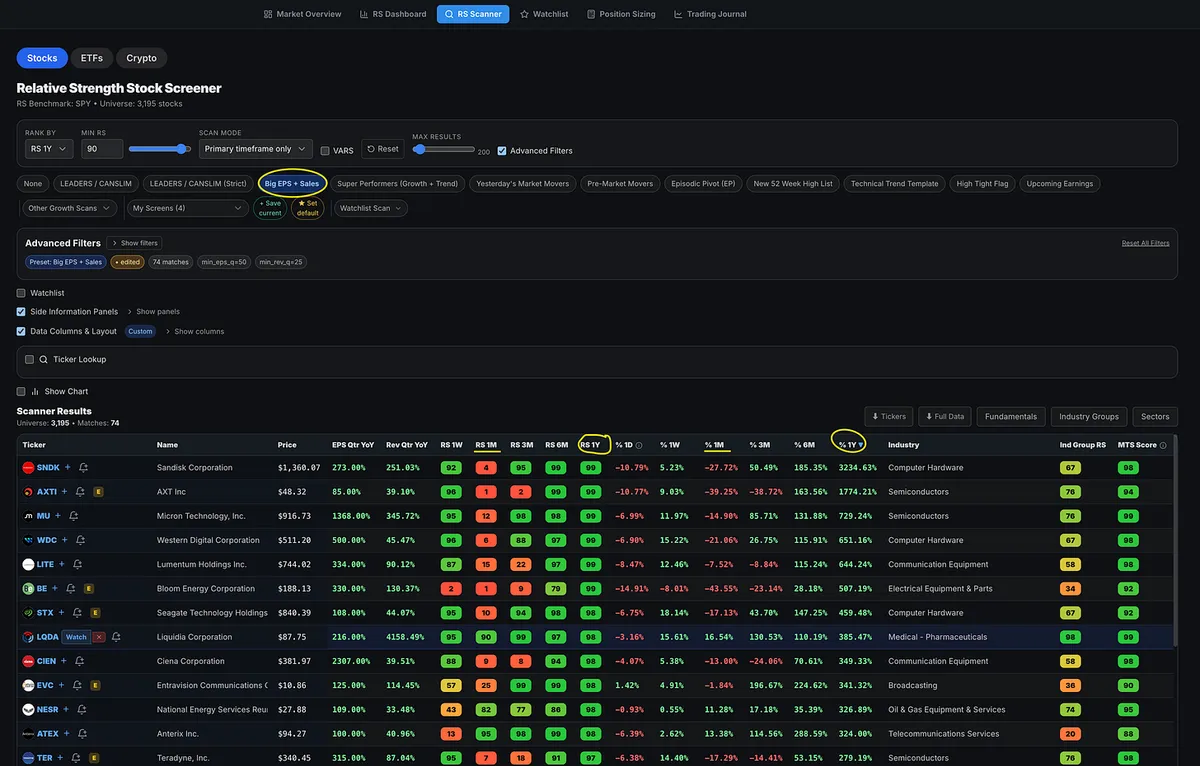
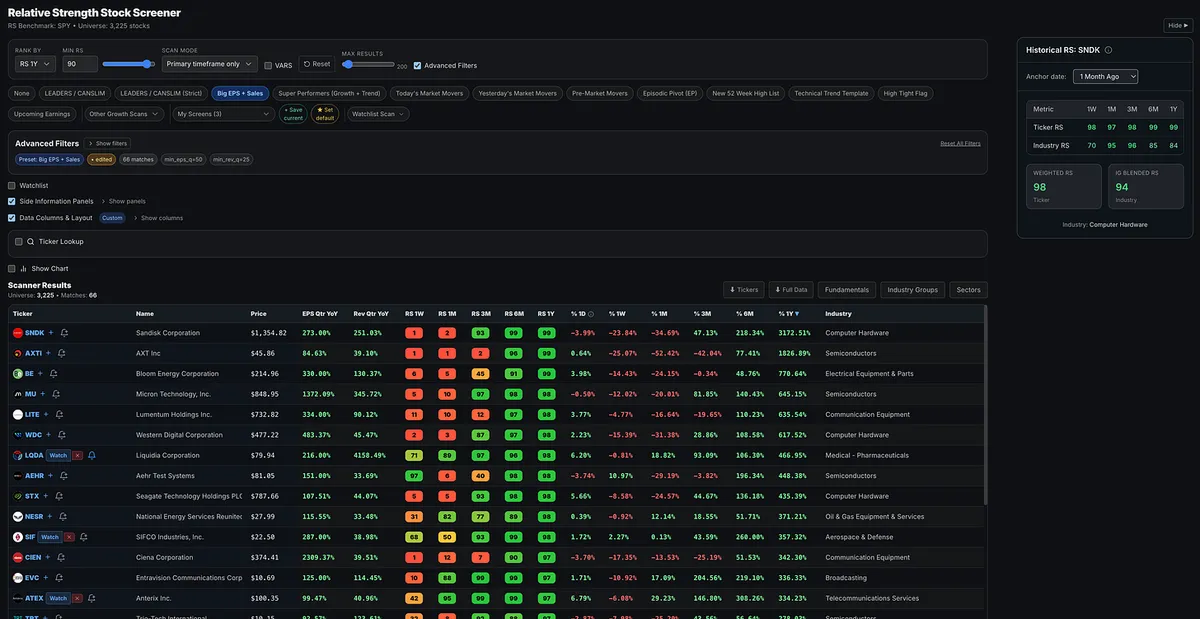
One of my favorite scans, and one I ran for years in MarketSurge, is the Big EPS and Sales screen. I now run the same scan inside the Momentum Trading Strategy software.

When you sort the results by one-year relative strength, the familiar leaders dominate: SNDK, MU, LITE, WDC, WTX, TER, etc.

The strongest groups are also the ones we have become accustomed to seeing: semiconductors, computer hardware, telecom, and communications equipment.

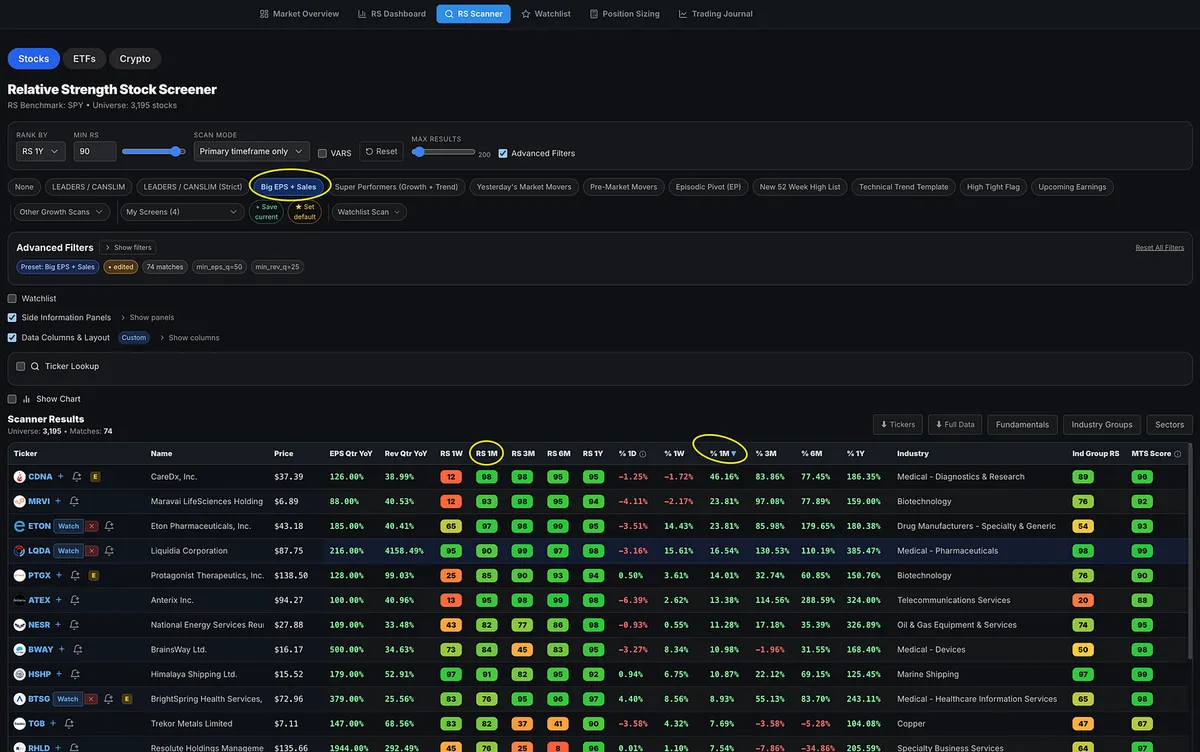
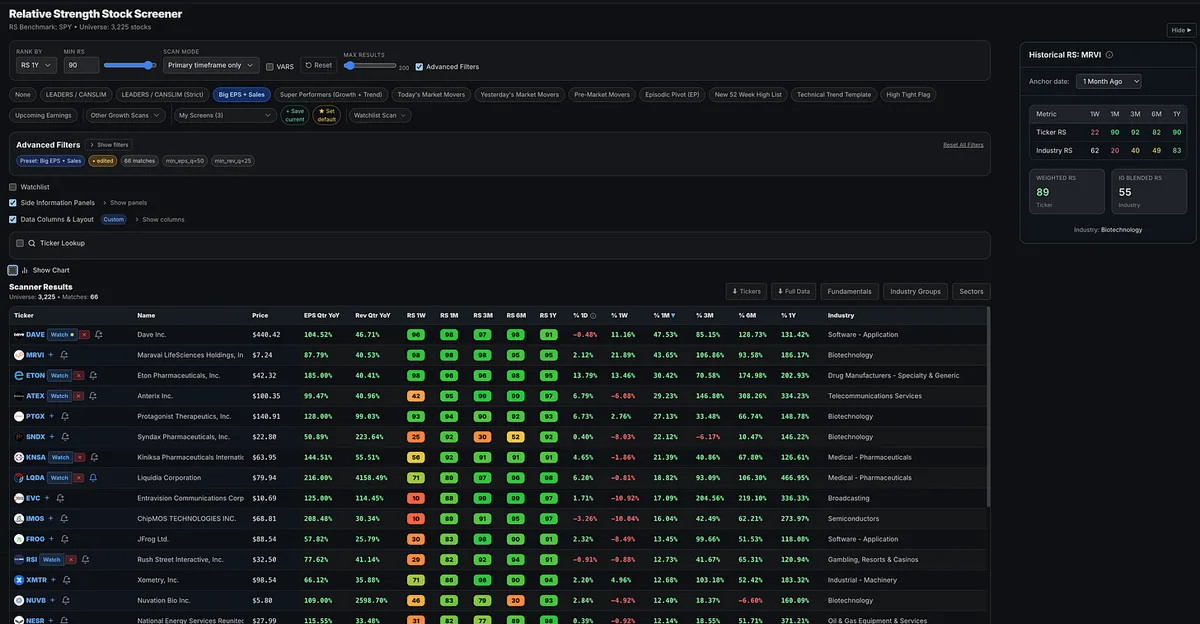
But sort the exact same screen by one-month relative strength, and the picture completely changes.

Now you see medical, biotechnology, pharmaceutical, oil and gas, and marine shipping names moving toward the top.

This shift was visible in the individual stock screens weeks ago.

When the indexes, sectors, industry groups, and individual stock screens all begin telling the same story, you are no longer guessing whether leadership is changing.

You are watching it happen in real time.

View on Substack ↗

Leadership changes before most traders notice.

Run the Big Earnings and Big Sales screen, then compare one-year relative strength with one-month relative strength.

The shift is unmistakable.

Many of the stocks that dominated the last year still carry elite long-term RS ratings, but their short-term rankings have collapsed:

SNDK: 1yr RS = 99 / 1m RS = 2

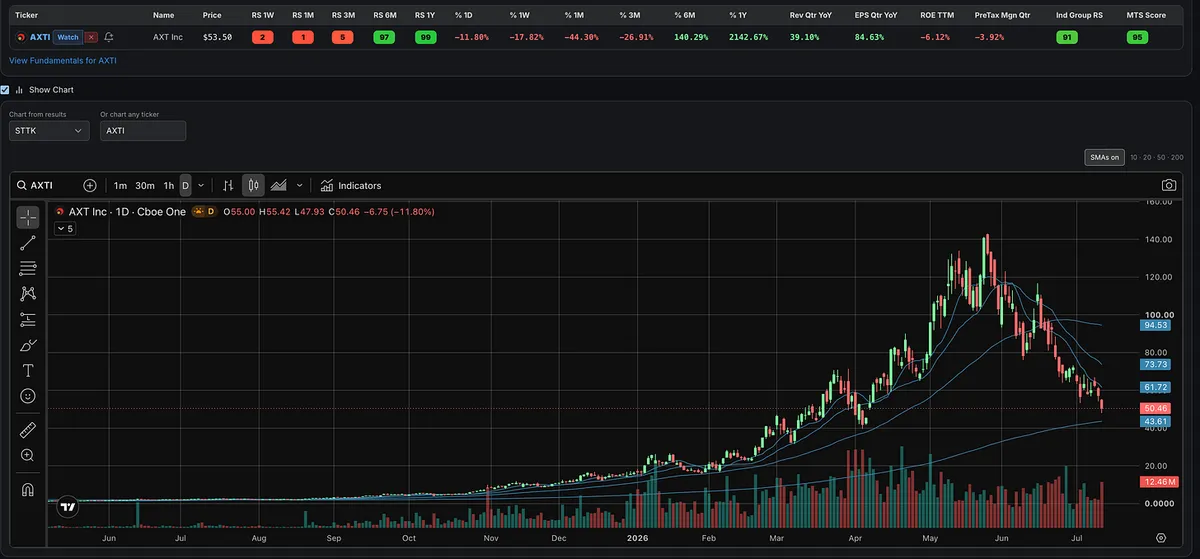
AXTI: 99 to 1

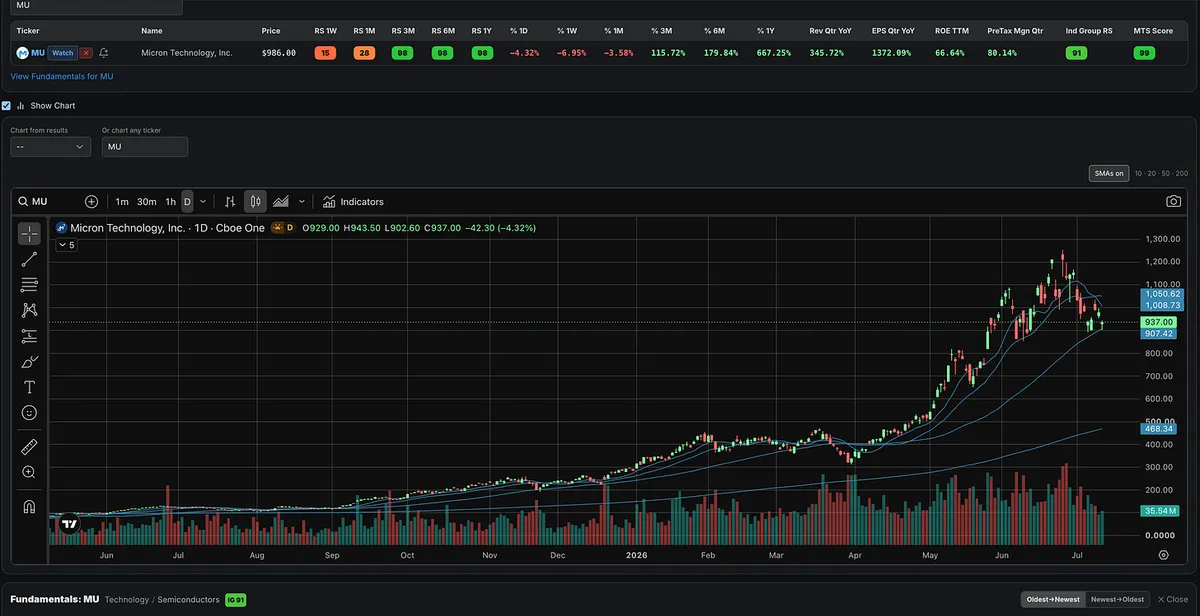
MU: 98 to 10

WDC: 98 to 3

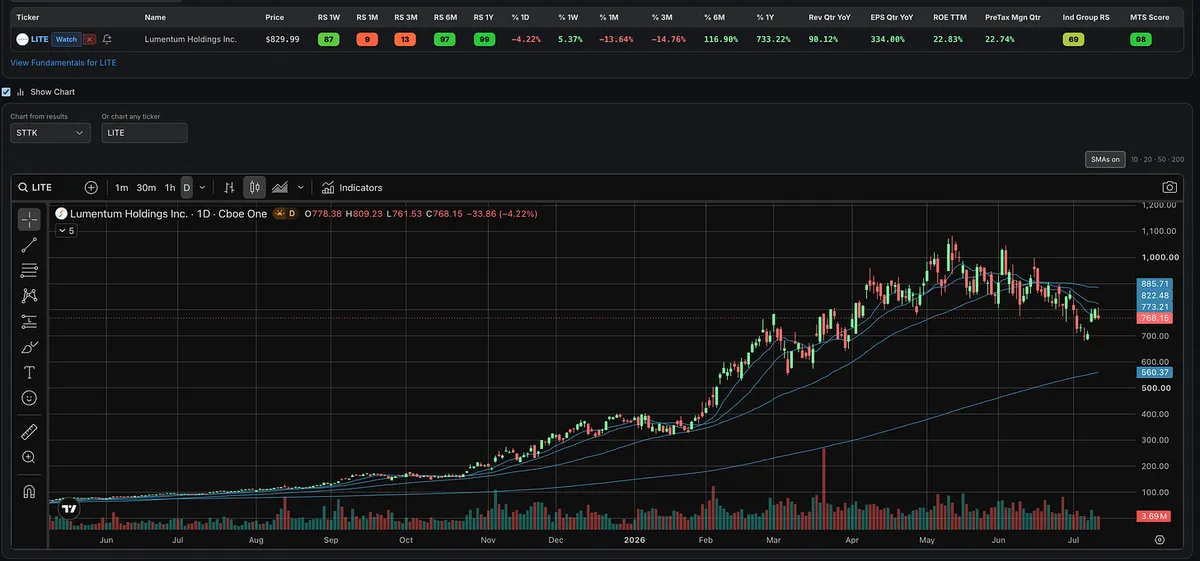
LITE: 98 to 10

CIEN: 97 to 12

At the same time, biotechnology, pharmaceuticals, software, and other emerging groups are moving toward the top of the screen.

That is what leadership rotation looks like in real time.

The market doesn’t send a memo. It leaves clues in relative strength, and industry-group rankings.

View on Substack ↗

What Leader Is Still Standing?

The market looks ugly, but the individual stock scans may look even worse.

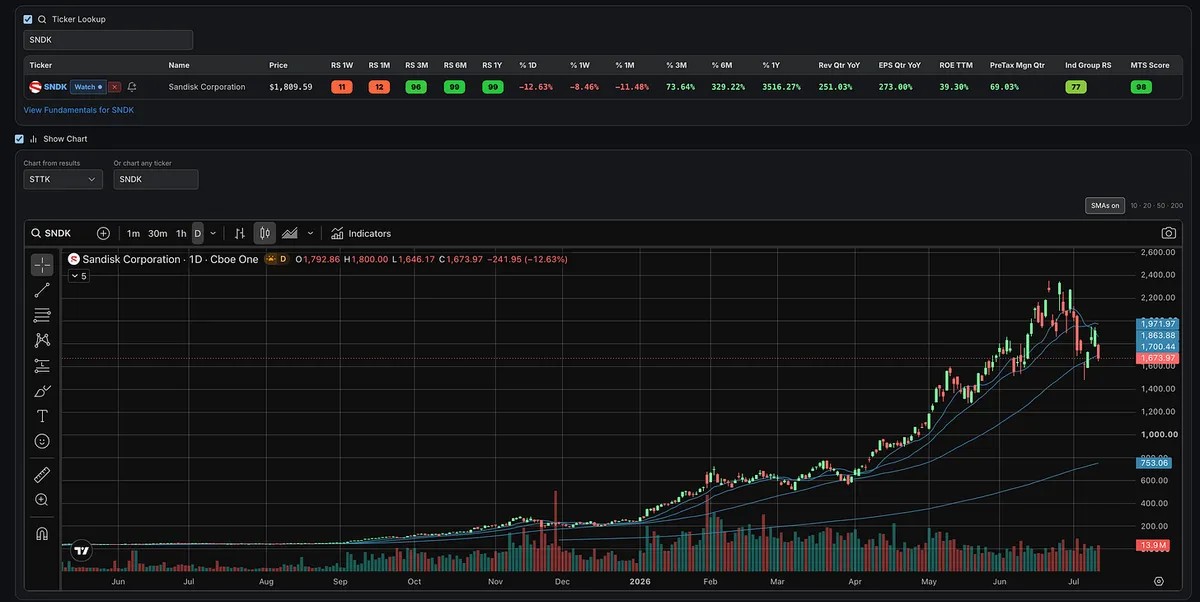
Many of the leading stocks from the past year have suffered meaningful technical breakdowns. With SNDK now confirming its breakdown below the 50-day moving average, it joins MU, STX, WDC, and a growing list of former leaders that have lost important support.

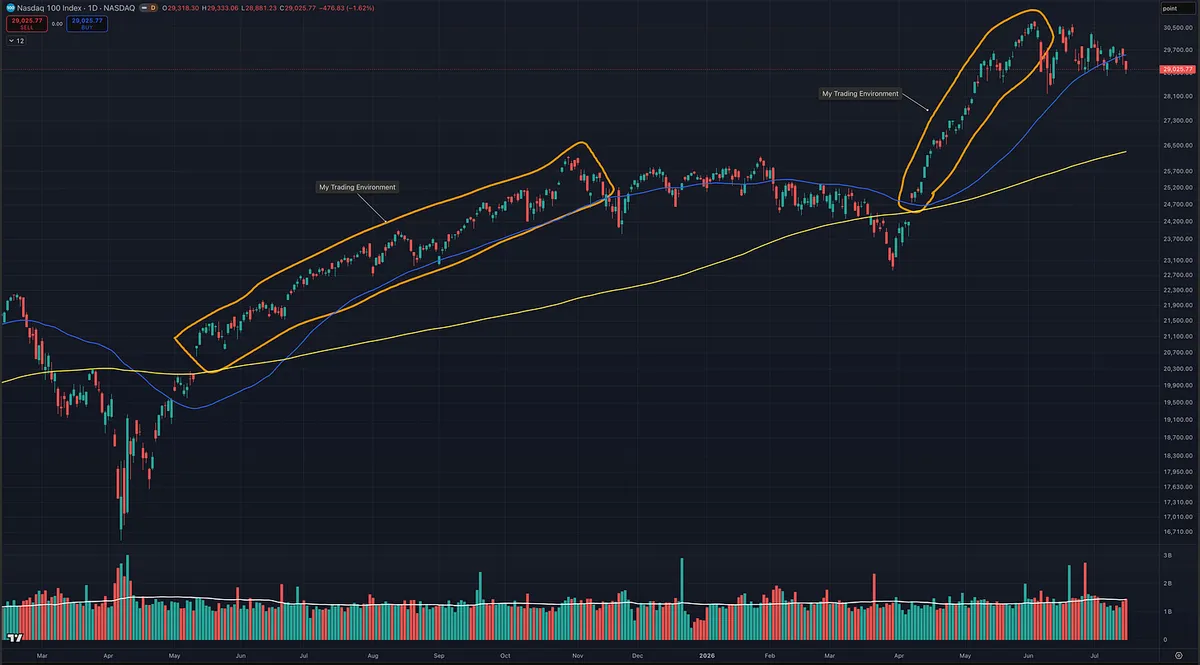
Since the market set its low on March 30 and began a new Stage 2 uptrend, which leaders are actually still standing?

Post a chart of a leading stock in a leading industry group that has not suffered a meaningful technical breakdown. Let’s see which former leaders are still holding up, if there are any.

View on Substack ↗

Nothing Lasts Forever. Don’t Fall in Love With Any Stock.

Some of the market’s biggest winners over the past year have now broken down. At least for the moment, their runs appear to be over.

AXTI delivered enormous gains over the last year, but it has now fallen below its 50-day moving average and is heading toward the 200-day. Its 10-day and 20-day lines are declining, and the 50-day is beginning to roll over.

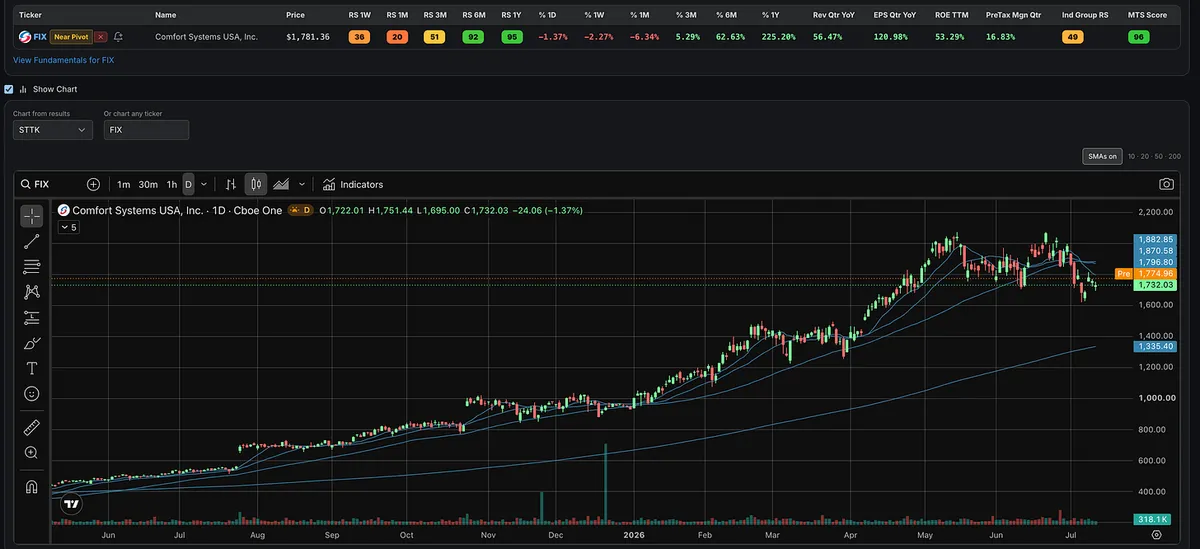
LITE, CIEN, VICR, AAOI, VIAV, TTMI, FIX, COHR, and several other former leaders have also broken down or suffered significant technical damage.

Many more are sitting in the danger zone near their 50-day moving averages. That includes the memory names SNDK, WDC, STX, and MU, along with other hot names from hot groups VPG, MBIS, MXL, LSCC, MRVL, TER, VSH, STM, ADI, INTC, TSM, LRCX, COHU, PDFS, and others.

The bottom line is that many of the stocks that have driven this market, particularly the memory, semiconductor, and telecom names, have either already broken down or are now testing a critical area around their 50-day lines.

I have not needed to share many new tickers from week to week because the same names I have discussed throughout the year continued to lead. There was no reason to constantly search for something new when the existing leaders were still working.

But nothing lasts forever.

Many of the stocks that worked all year are now either ending their runs or approaching a decisive point. Do not fall in love with any stock. Respect the price action and let the market tell you whether the trend is still intact.

View on Substack ↗

Risk/Reward Changes With Every Candle. Most Traders Realize It Too Late.

As a growth stock trader and momentum trader, I am not trying to guess the bottom.

I am also not trying to pick the top.

I wait for the market to confirm.

Then I do the same thing with individual stocks.

This is something I talk about in Module 6 of the Momentum Trading Strategy Course in the risk management section.

Risk-reward is not static.

It changes as a stock moves.

After a long consolidation, correction, or deep pullback, the first few days off the lows are always hard to trust.

You do not know if it is real yet.

It could just be another failed rally.

It could just be another bounce before the next leg lower.

But once the market gives a real green light, that is where your focus should shift.

  • A follow-through day.

  • Price reclaiming key moving averages.

  • Leading stocks setting up.

  • Stocks breaking out to new highs.

William O’Neil talked about this idea repeatedly. The goal is not to predict the market. The goal is to understand what the market has actually done and what it is doing now.

He also wrote that investors should buy stocks as they emerge from properly formed bases and begin making new highs in price.

Mark Minervini described a similar moment in Trade Like a Stock Market Wizard.

When a leading stock moved into new high ground as the general market rallied off its lows, he wrote:

“This was the green light to buy.”

You are not trying to be a hero at the bottom.

You are trying to recognize when the evidence has changed.

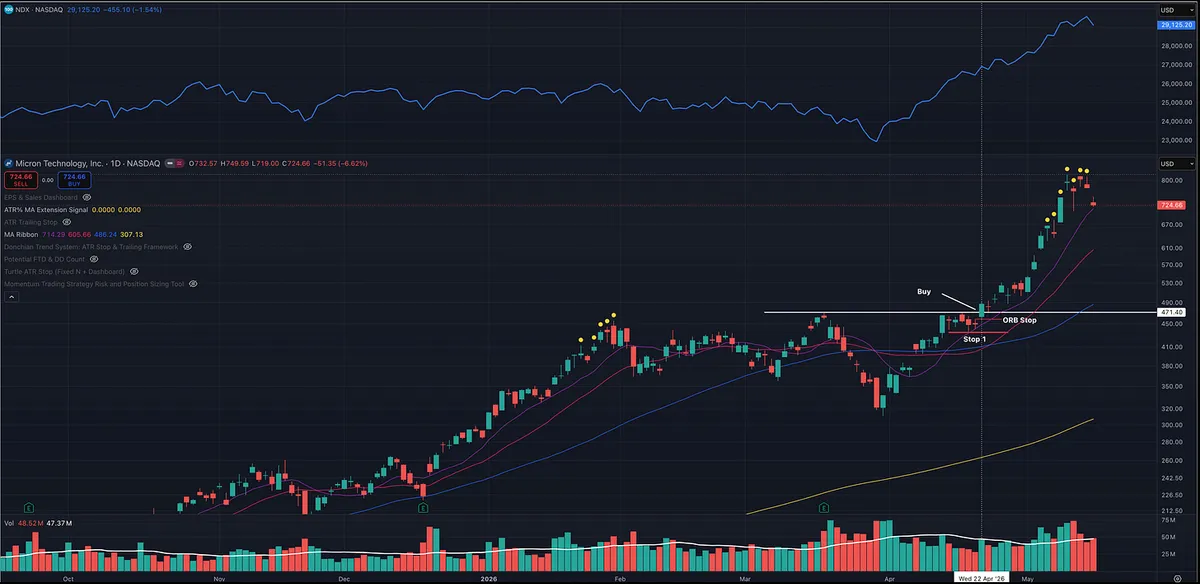
Now look at MU.

This was not some random stock waking up.

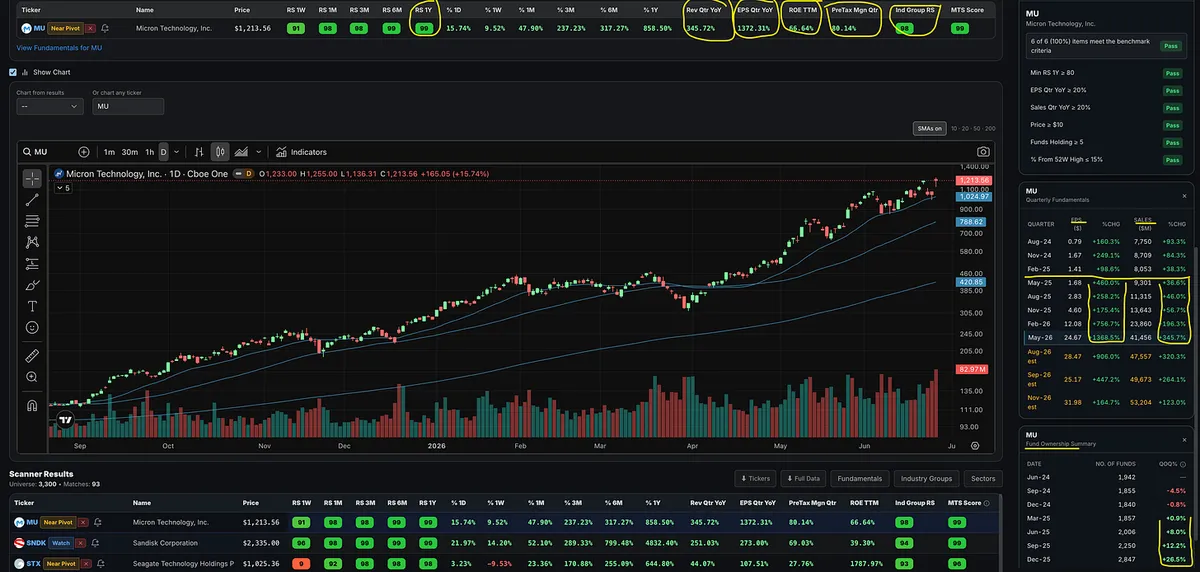
This name has been showing the characteristics of a leader for months.

  • Strong relative strength.

  • A hot industry group.

  • Explosive earnings.

  • Explosive sales.

  • Strong margins.

  • Strong institutional sponsorship.

  • Price above key moving averages.

  • A cup-with-handle type setup.

  • A breakout to new highs on strong volume.

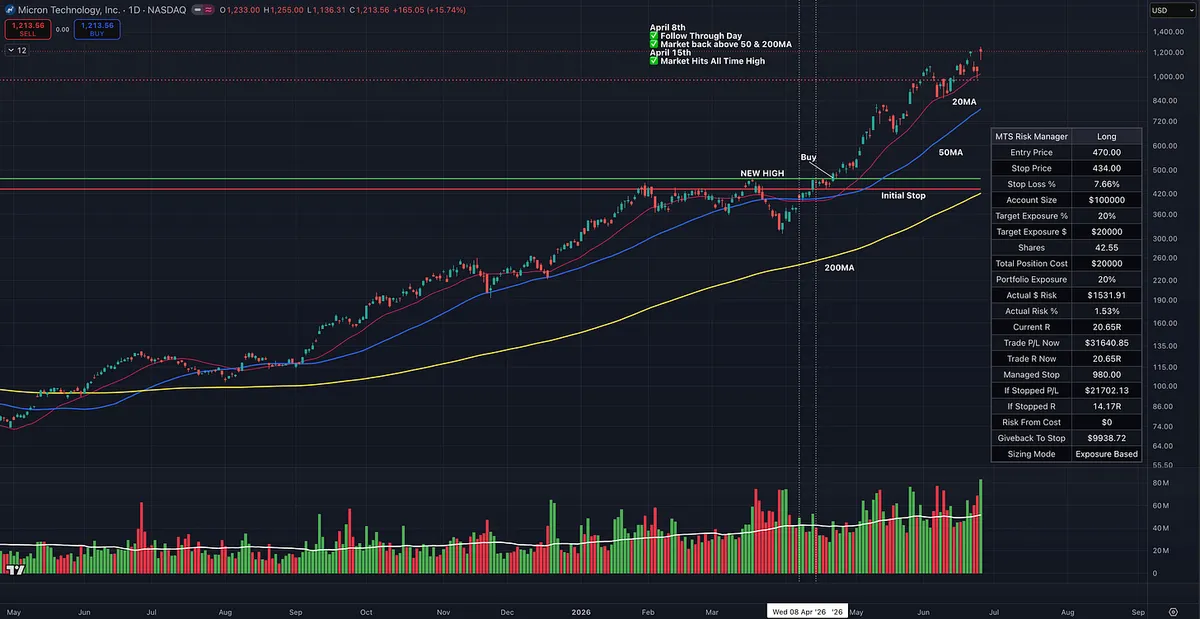
Back in April, during this breakout, the risk-reward was much better.

The multi-month consolidation gave the market and MU the time it needed to reset, shake out weak holders, and build the structure for its next leg higher.

Then, after briefly breaking below the 200-day moving average and washing out many traders, the stock reclaimed key levels, tightened up, and broke out to new highs.

That kind of action can fuel a move that goes much higher and lasts much longer than most people expect.

Now the stock is up roughly 20R from the initial risk.

Could you have made money buying it later?

Sure.

But that is not the point.

The point is that the risk-reward relationship changed.

The market can still go much higher from here.

Or it may not.

Nobody has a crystal ball.

But what we can know is when the market gives us a green light, when leading stocks are setting up, and when the risk can be defined before the move becomes obvious to everyone else.

This is why experienced traders get excited after long consolidations and deep corrections.

Not because the damage is fun.

Because corrections reset the playing field.

When conditions improve and leaders begin breaking out, the risk-reward is usually far better than it is months later after everyone finally feels comfortable.

By the time the trade looks obvious, the best risk-reward is usually already behind you.

View on Substack ↗

The Market Gave the Green Light

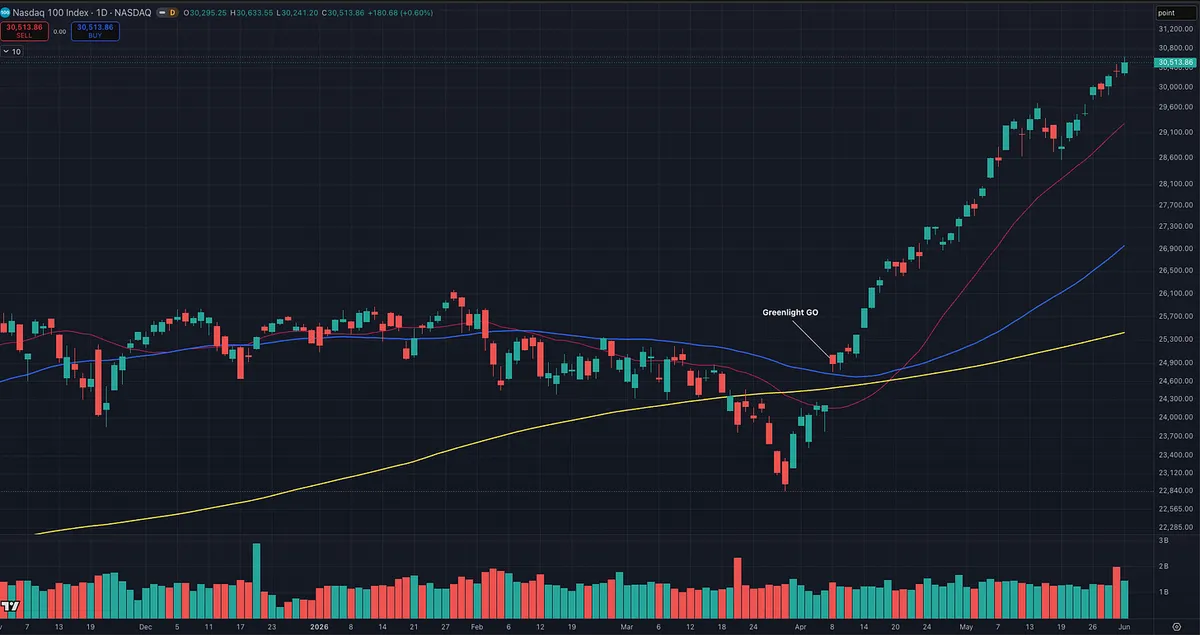
On April 8, the market gapped up above the 50-day and 200-day moving averages on a follow-through day.

That was the green light to start participating again.

Many traders ignored the signal.

Then they complained that there was “nothing to buy.”

Then, after the strongest names started moving, many said the move had already happened and the stocks had already left without them.

But that was not true.

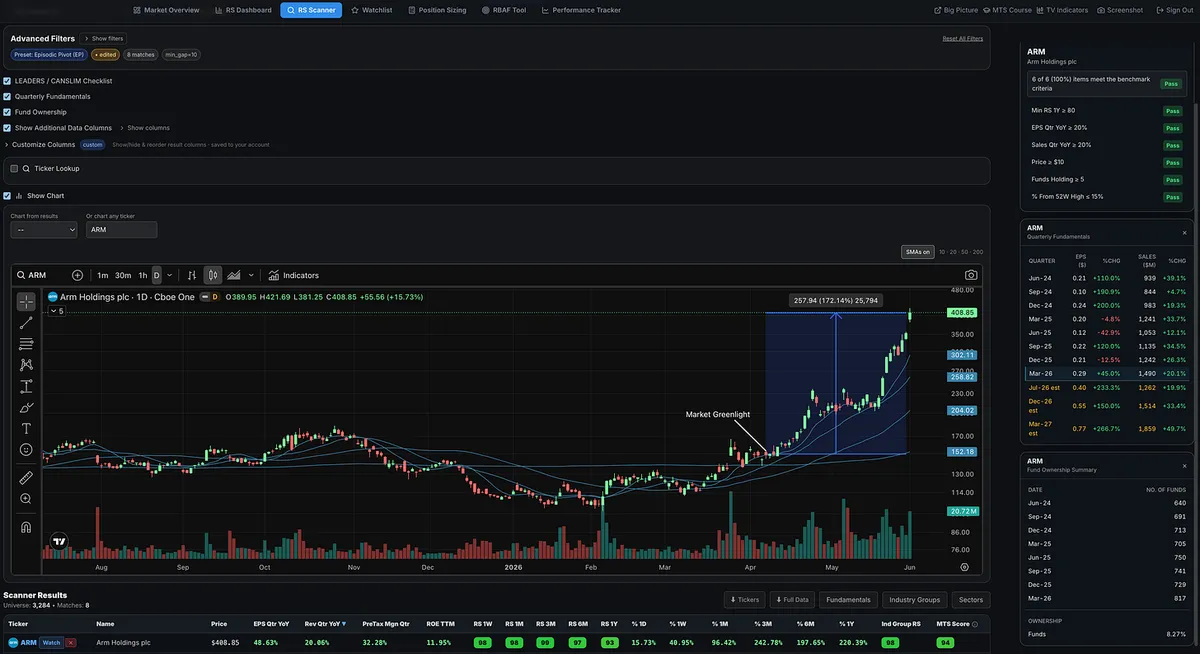
MU was one example I gave that was still setting up on April 22.

ARM is another example of a later mover that gave traders plenty of time to participate.

After the market confirmed strength, ARM began building momentum, tightened up, held key moving averages, and eventually made a powerful move higher.

This is why following a proven process matters.

The market gave the signal.

Leading stocks showed up before, during and after the market moved.

There were plenty of opportunities for traders who were prepared and knew what they were doing.

This is why we built the Momentum Trading Strategy Course and MTS Software.

The course gives you the foundation.

The software helps you find the leaders.

Stop wasting time guessing.