Momentum Trading Strategy

Notes

Market Conditions

Reading the overall market and deciding how aggressive to be.

Showing 1–3 of 3 notes

$AXTI ×
View on Substack ↗

A Different Kind of Strength Since Last Wednesday’s Low

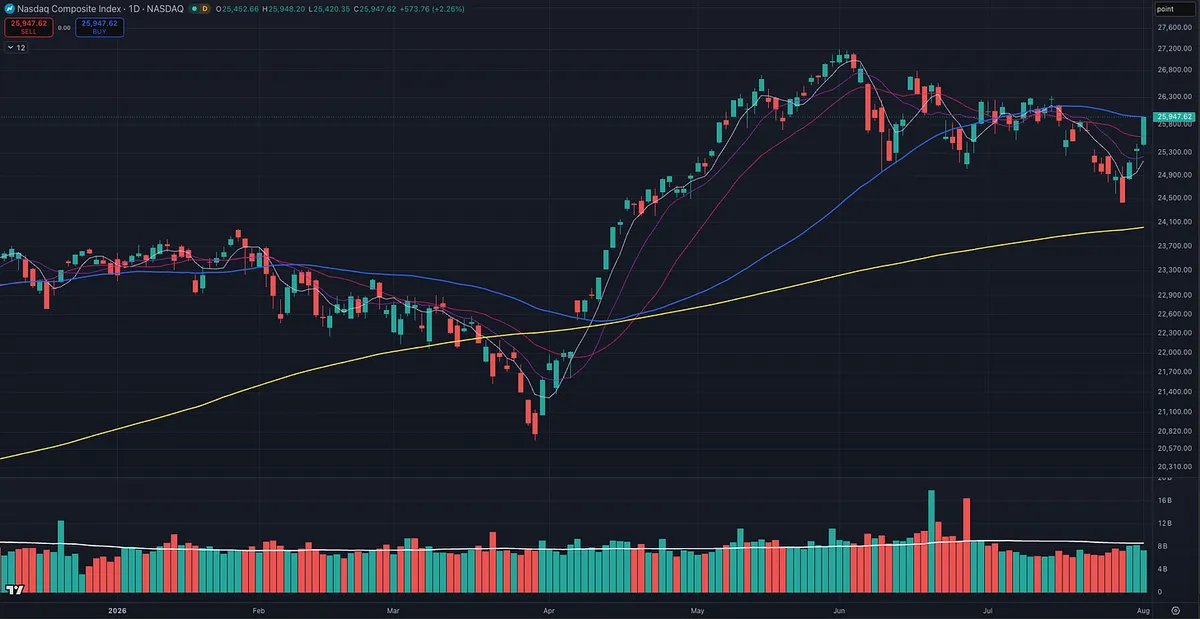
Now we will see if the rally attempt earns confirmation with a follow-through day in the coming days.

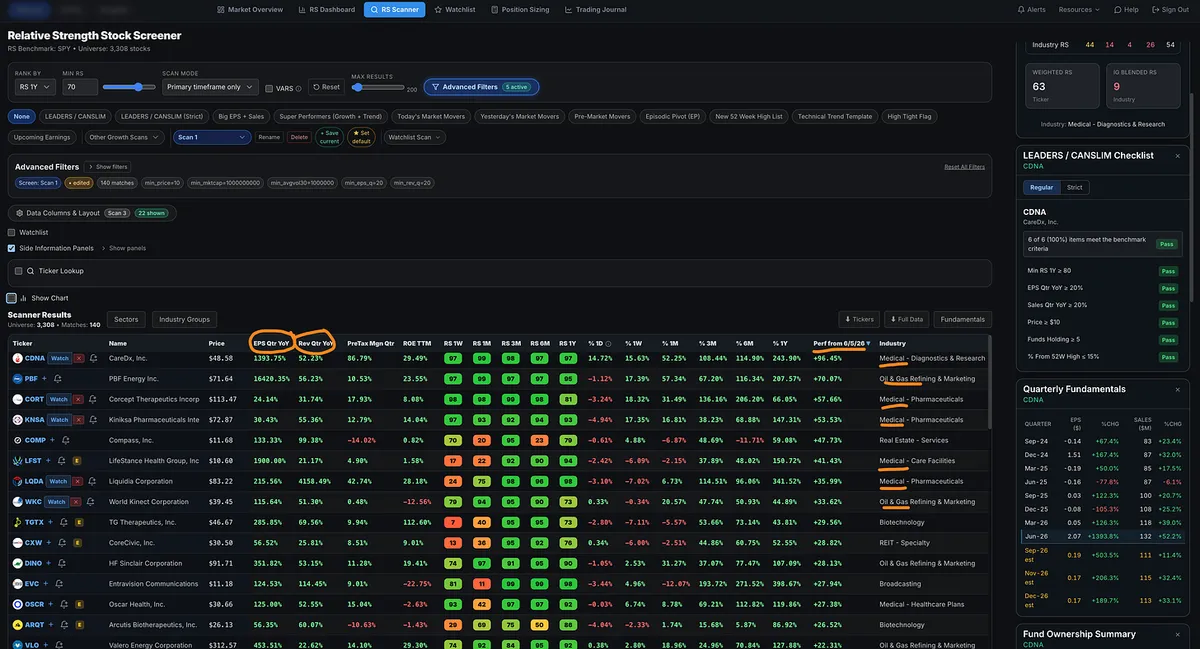
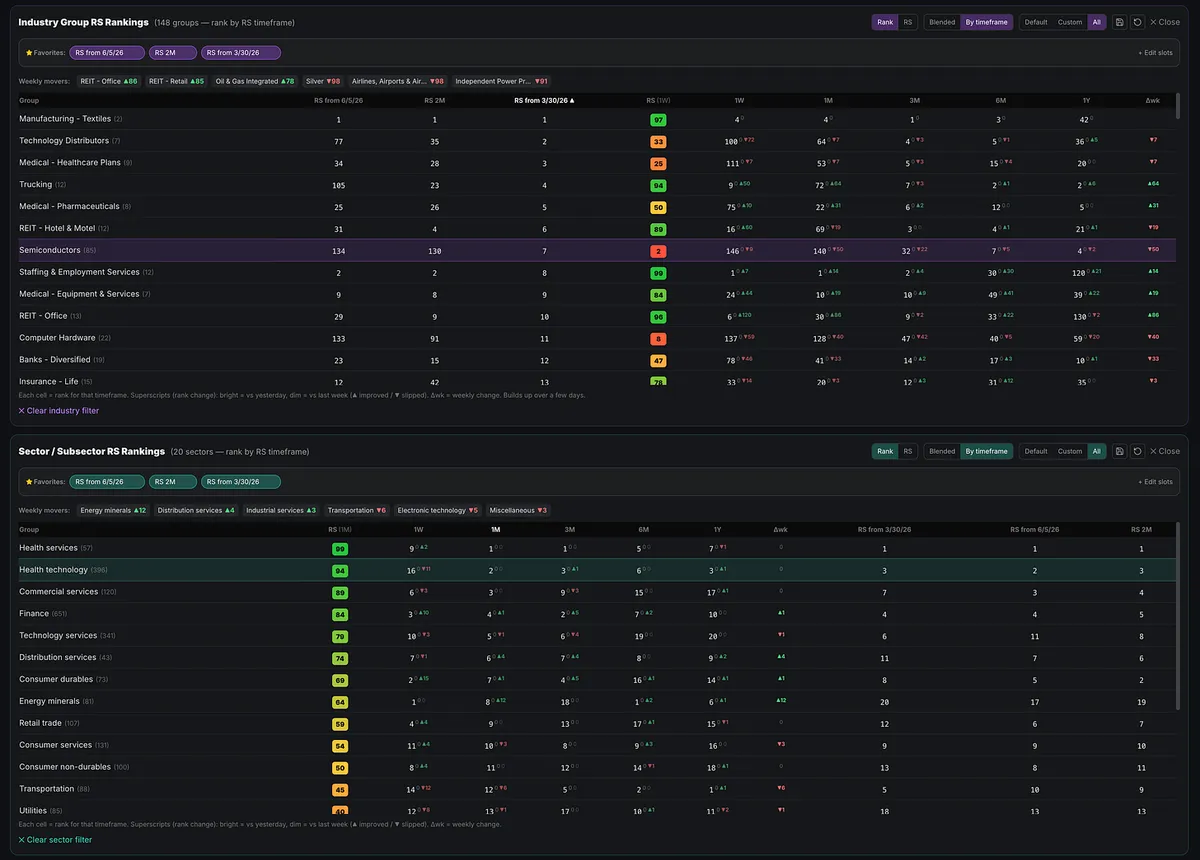
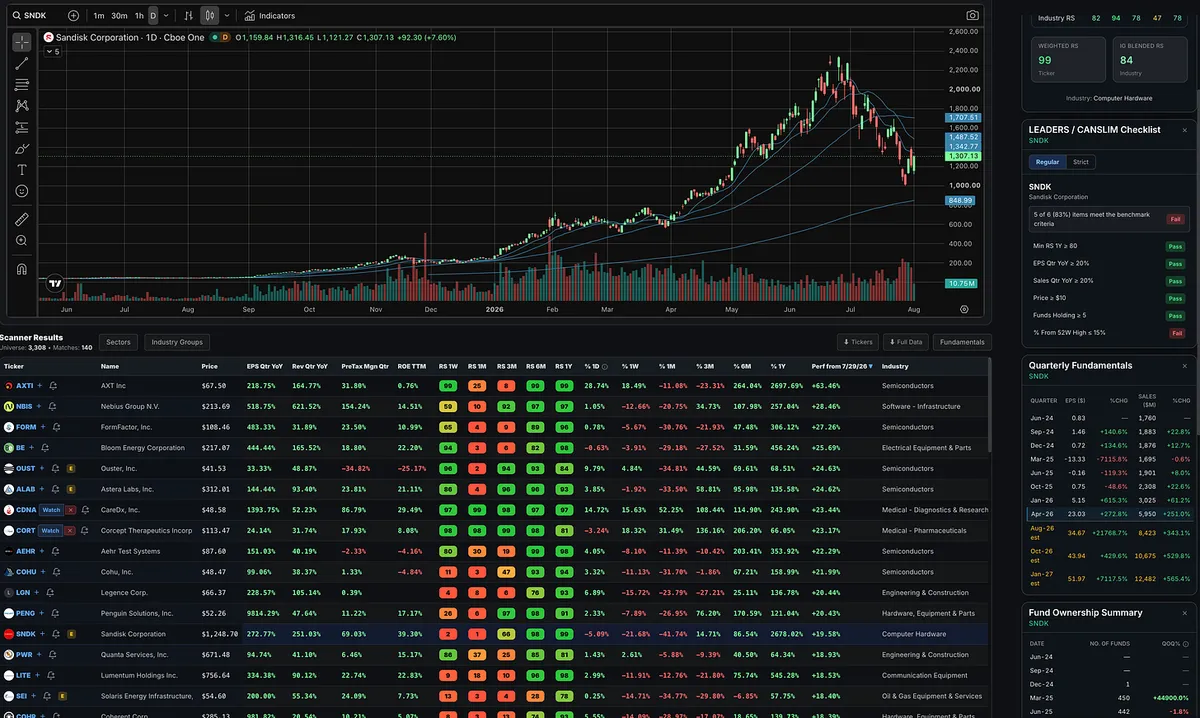
Using the same scan of liquid stocks with big earnings and sales growth, the leaderboard looks completely different depending on the starting point.

From the June 5 character change through today, the strongest performers have largely come from healthcare, energy, and other less traditional growth areas.

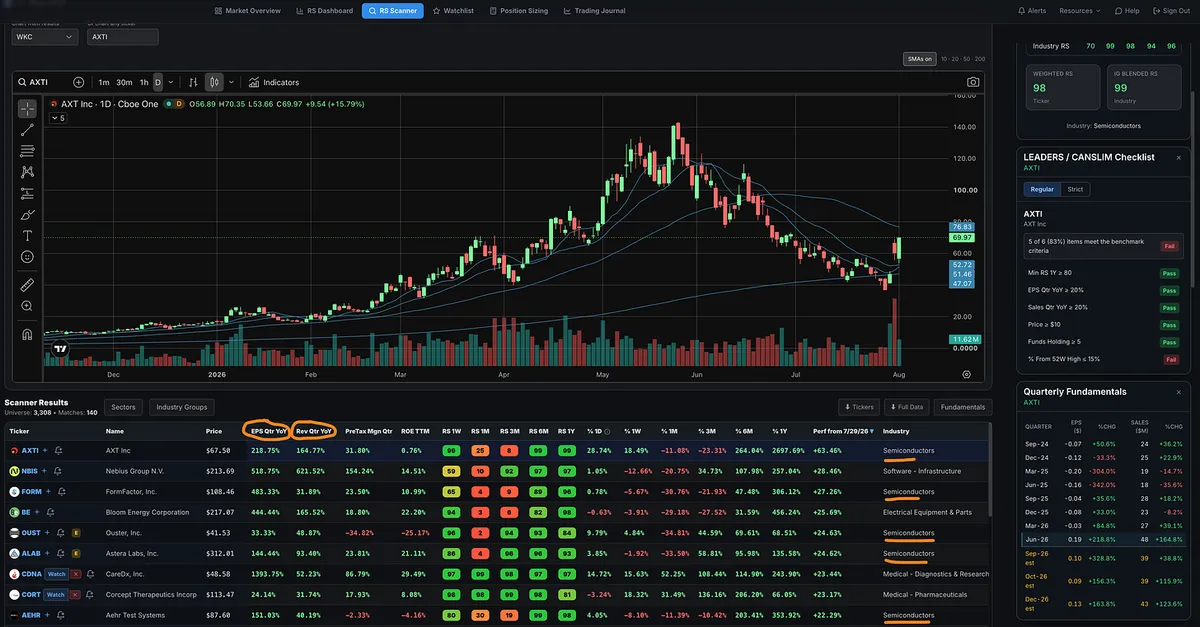
When performance is measured from last Wednesday’s low, however, the list shifts sharply toward semiconductors and beaten down former leaders.

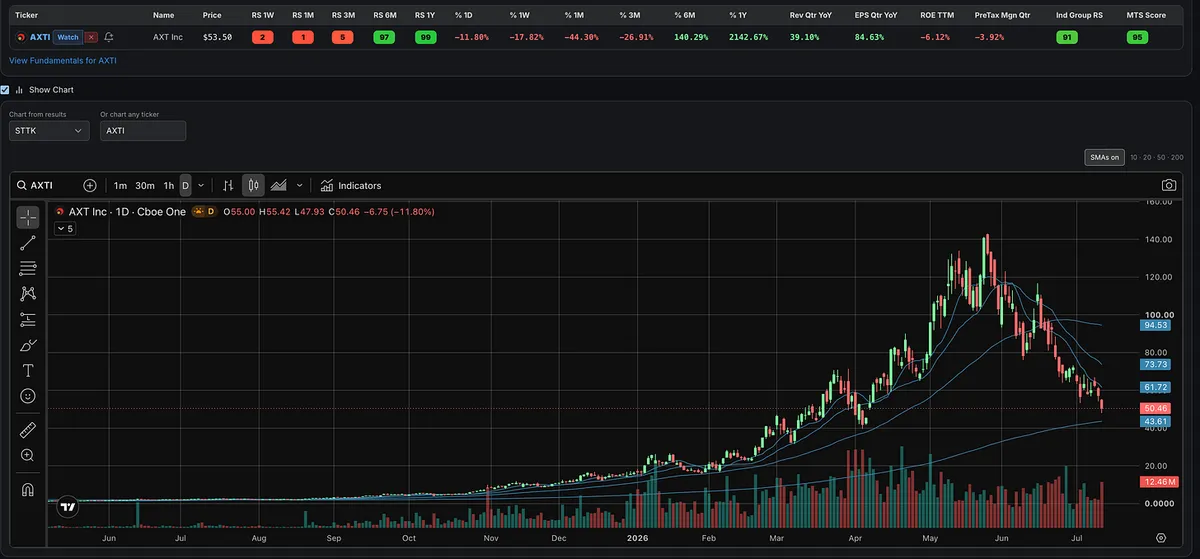
That change is notable, but it is not yet proof that these stocks are back or that a new leadership cycle has begun. Many remain well below their highs. AXTI, for example, had declined nearly 75%. During corrections and bear markets, deeply damaged stocks can produce powerful short term rallies without repairing their longer term trends.

The question now is whether this develops into sustained relative strength, institutional accumulation, or fades as another rebound from oversold levels.

The market still has to provide the evidence. A rally attempt can fail or develop into a legitimate follow through, while genuine leaders must continue separating themselves through superior relative strength and price and volume action.

Same fundamental scan. Different measurement window. Completely different type of stock showing strength. It is a character change worth watching, not a conclusion.
View on Substack ↗

Leadership changes before most traders notice.

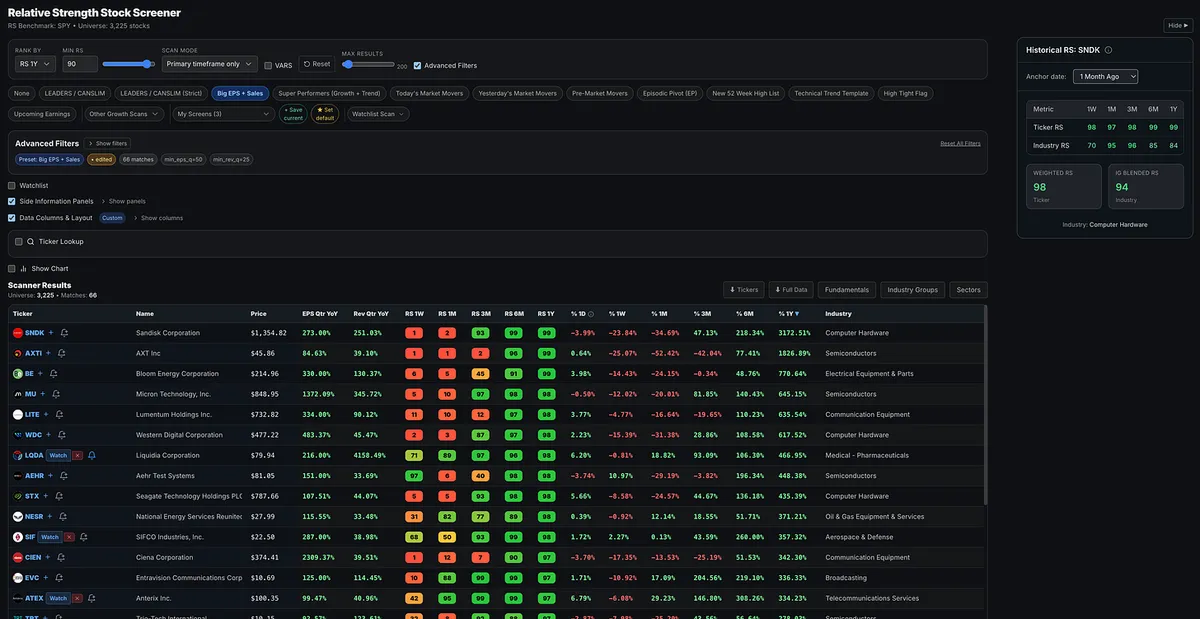
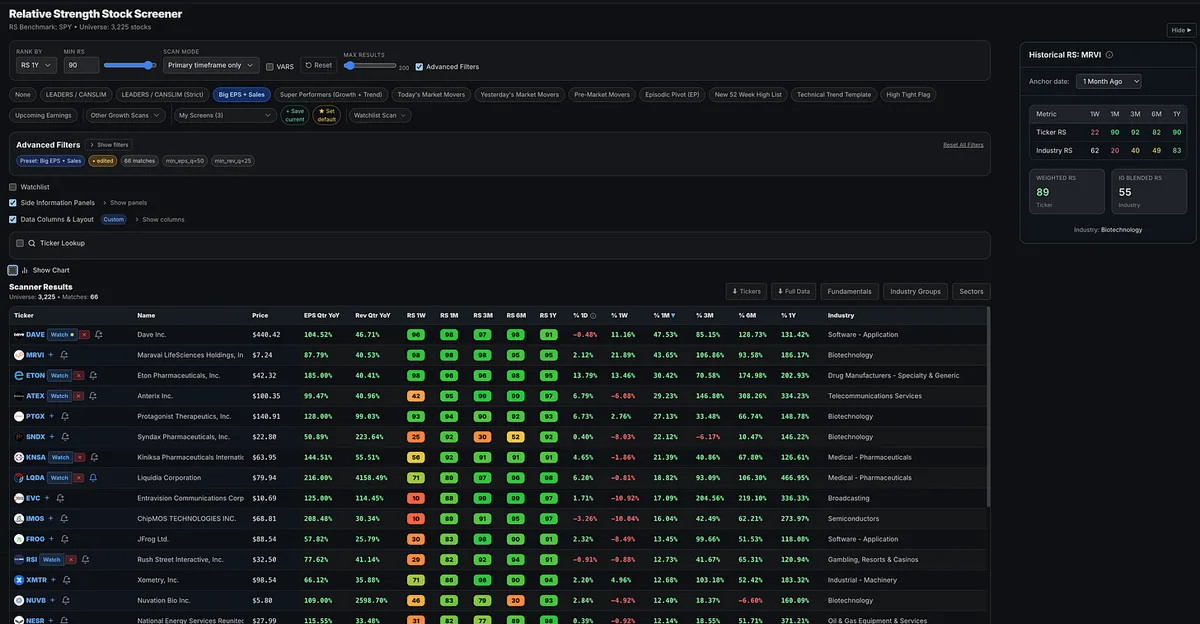
Run the Big Earnings and Big Sales screen, then compare one-year relative strength with one-month relative strength.

The shift is unmistakable.

Many of the stocks that dominated the last year still carry elite long-term RS ratings, but their short-term rankings have collapsed:

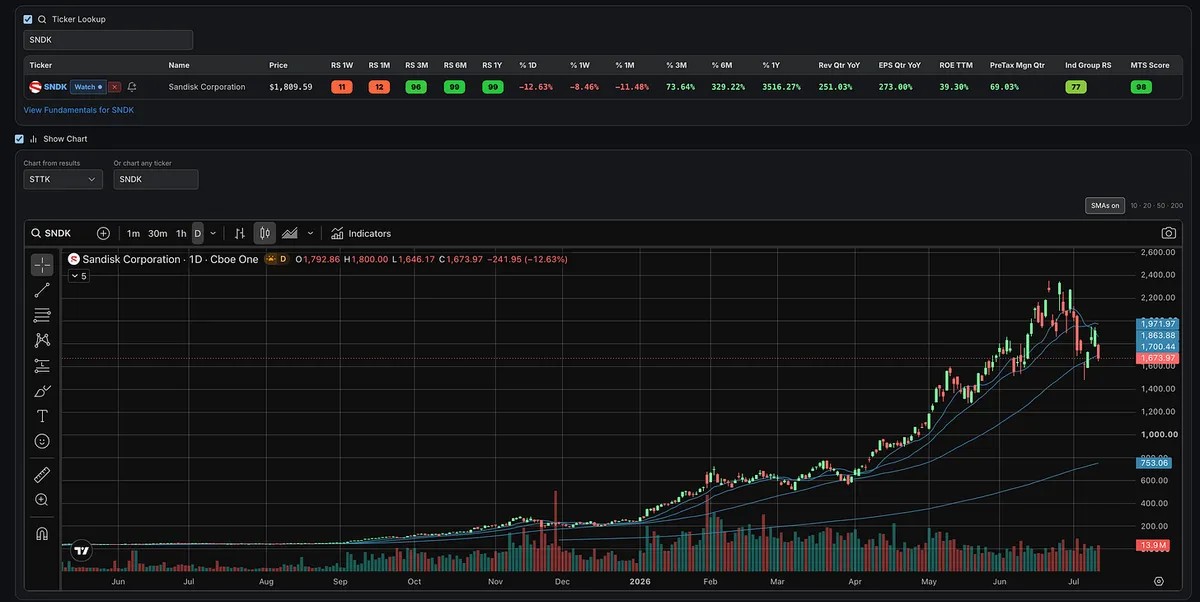
SNDK: 1yr RS = 99 / 1m RS = 2

AXTI: 99 to 1

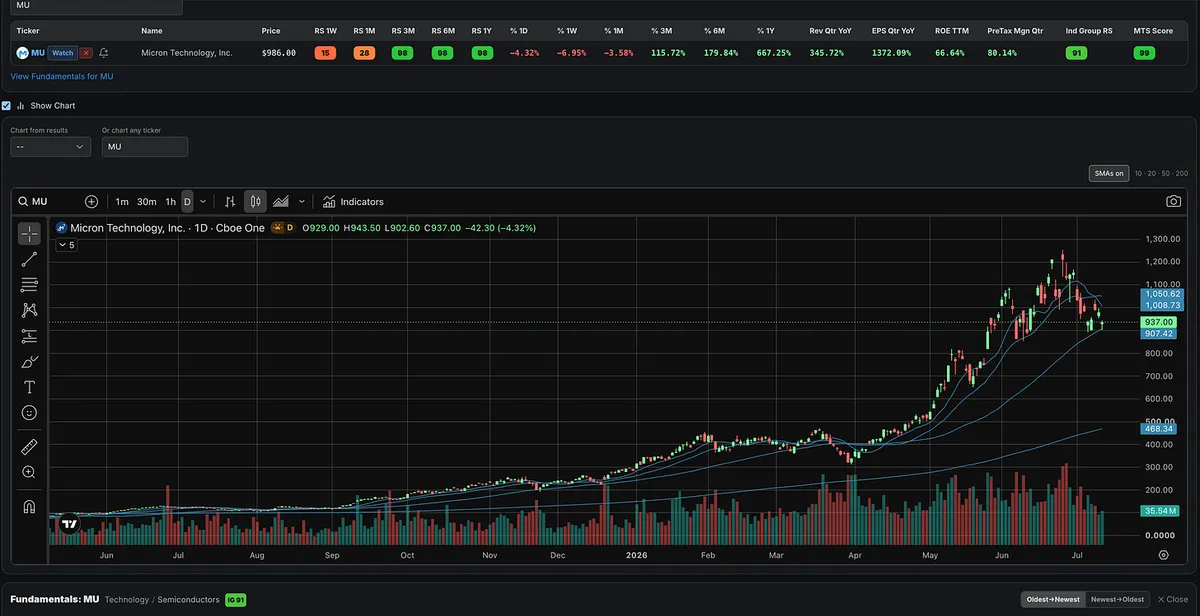
MU: 98 to 10

WDC: 98 to 3

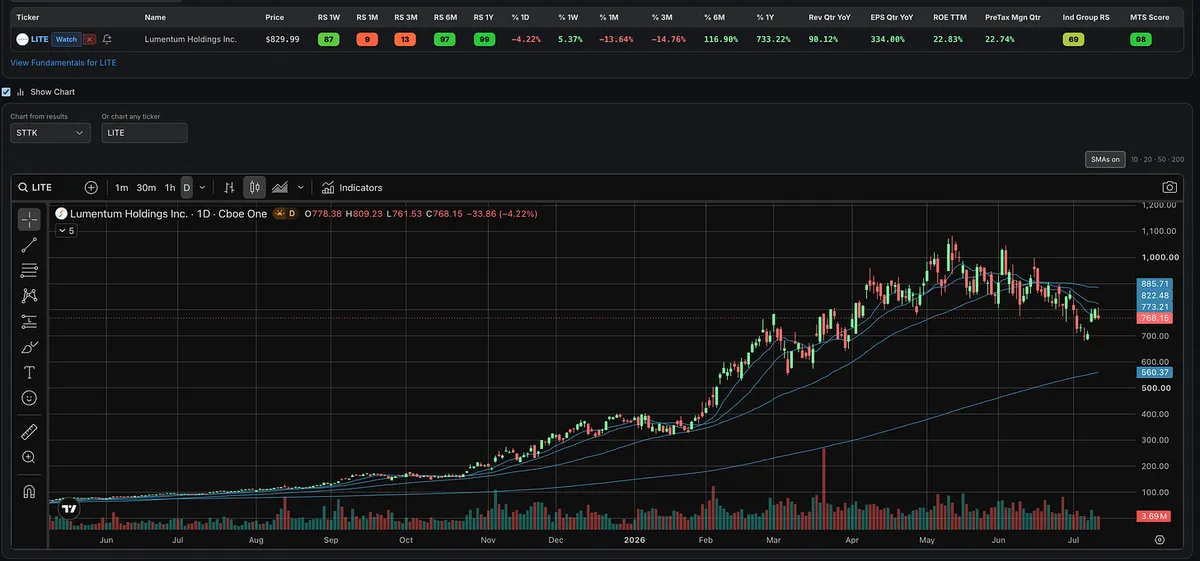
LITE: 98 to 10

CIEN: 97 to 12

At the same time, biotechnology, pharmaceuticals, software, and other emerging groups are moving toward the top of the screen.

That is what leadership rotation looks like in real time.

The market doesn’t send a memo. It leaves clues in relative strength, and industry-group rankings.

View on Substack ↗

Nothing Lasts Forever. Don’t Fall in Love With Any Stock.

Some of the market’s biggest winners over the past year have now broken down. At least for the moment, their runs appear to be over.

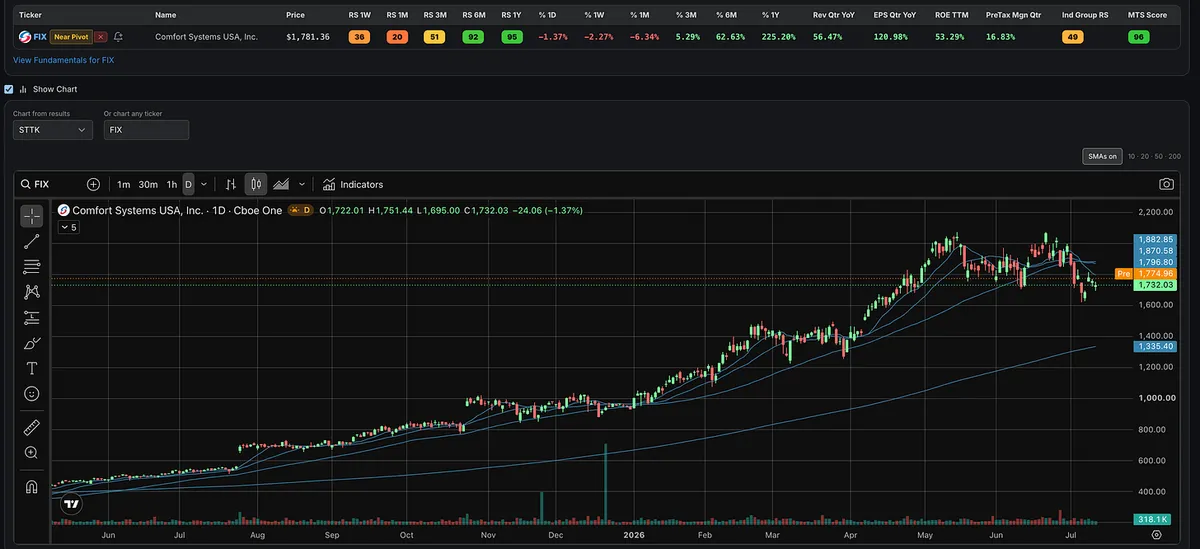
AXTI delivered enormous gains over the last year, but it has now fallen below its 50-day moving average and is heading toward the 200-day. Its 10-day and 20-day lines are declining, and the 50-day is beginning to roll over.

LITE, CIEN, VICR, AAOI, VIAV, TTMI, FIX, COHR, and several other former leaders have also broken down or suffered significant technical damage.

Many more are sitting in the danger zone near their 50-day moving averages. That includes the memory names SNDK, WDC, STX, and MU, along with other hot names from hot groups VPG, MBIS, MXL, LSCC, MRVL, TER, VSH, STM, ADI, INTC, TSM, LRCX, COHU, PDFS, and others.

The bottom line is that many of the stocks that have driven this market, particularly the memory, semiconductor, and telecom names, have either already broken down or are now testing a critical area around their 50-day lines.

I have not needed to share many new tickers from week to week because the same names I have discussed throughout the year continued to lead. There was no reason to constantly search for something new when the existing leaders were still working.

But nothing lasts forever.

Many of the stocks that worked all year are now either ending their runs or approaching a decisive point. Do not fall in love with any stock. Respect the price action and let the market tell you whether the trend is still intact.