
01 / Market
Know your environment
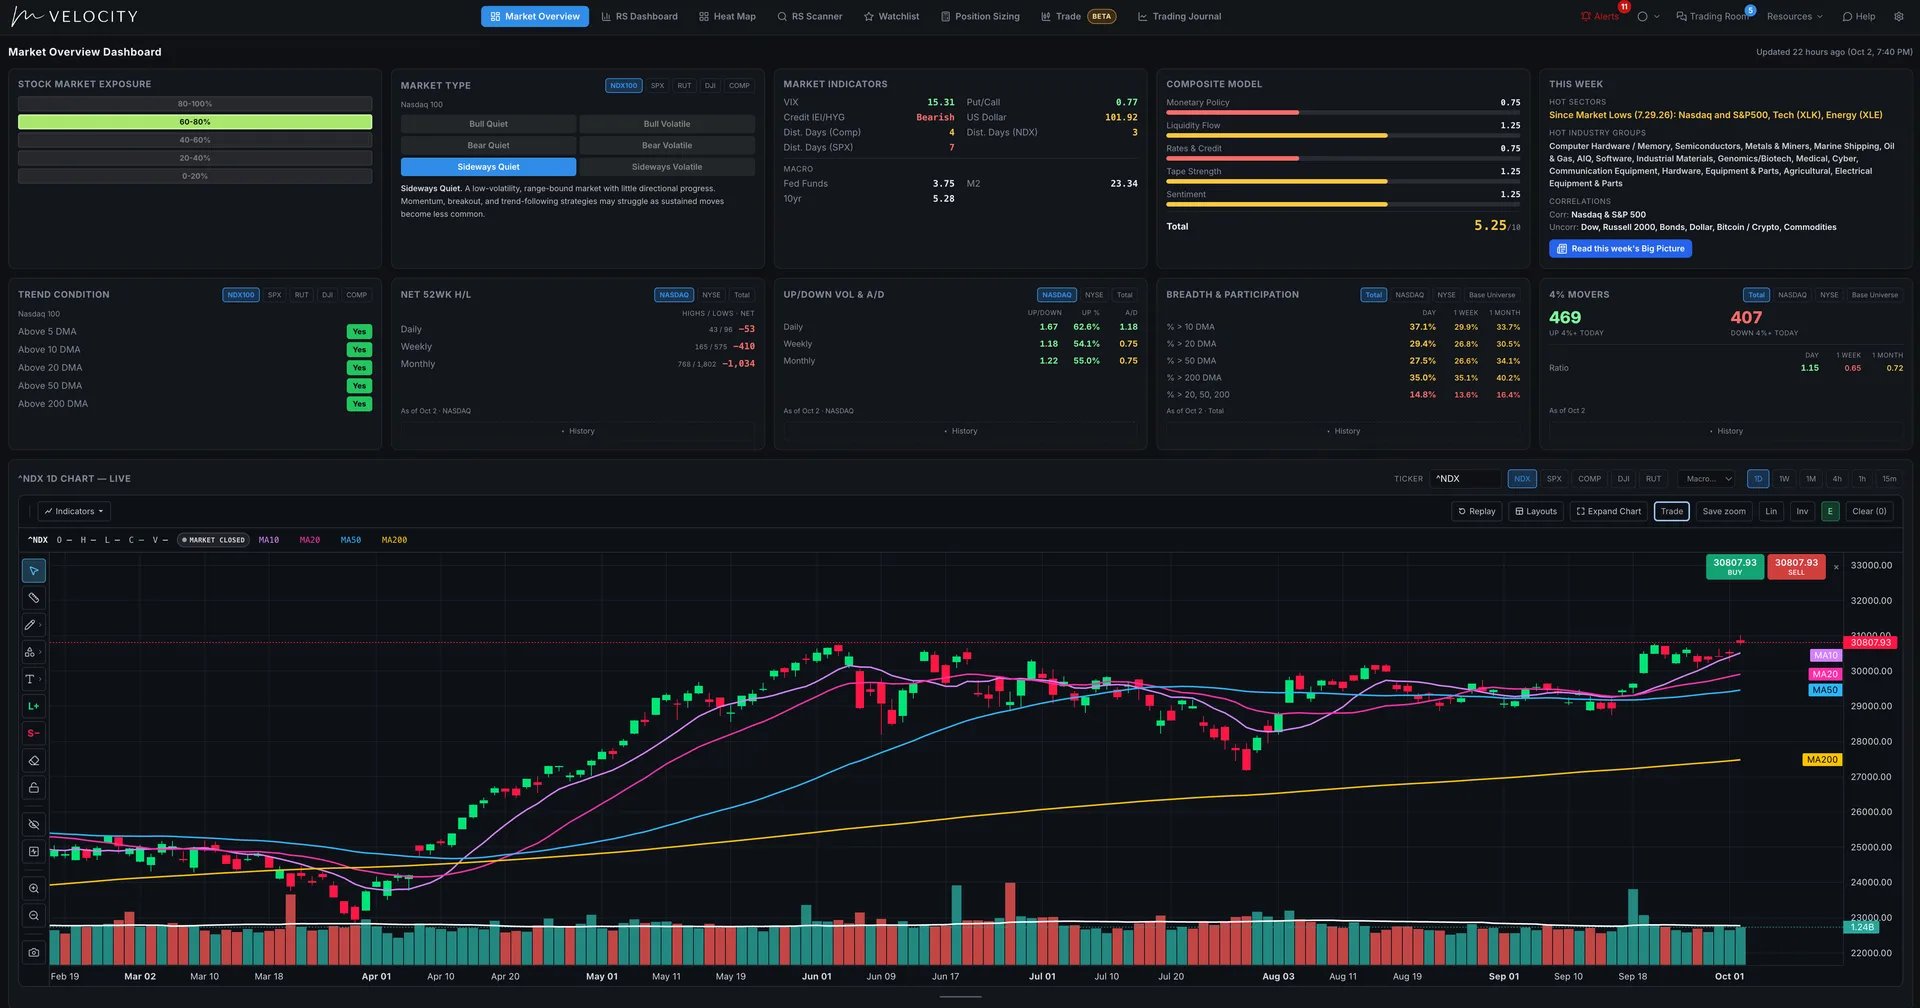
Market Overview dashboards show market type, exposure guidance, breadth, distribution days, sentiment and credit in one view, so you know when to press and when to sit out.
MTS Velocity
Screen for the strongest growth stocks, read the market, and manage every trade from plan to review, in one platform built around relative strength, growth fundamentals, price action and proven momentum trading principles.
One platform, the entire process
01 / Market
Market Overview dashboards show market type, exposure guidance, breadth, distribution days, sentiment and credit in one view, so you know when to press and when to sit out.
02 / Leaders
RS Scanners rank thousands of NYSE and Nasdaq stocks across multiple timeframes, with sector and industry group leadership, growth fundamentals and a CANSLIM checklist on every name.
03 / Execution
Position sizing and risk tools, trade planning, alerts, trade management, and a trading journal with analytics that show you what is actually working.
Everything inside
Dashboards, scanners, charts, watchlists, risk tools, journal, chat, and the education hub share one login and one set of ratings.
Market type, exposure guidance, breadth, distribution days, sentiment, and credit in one view, so you know when to press and when to sit out.
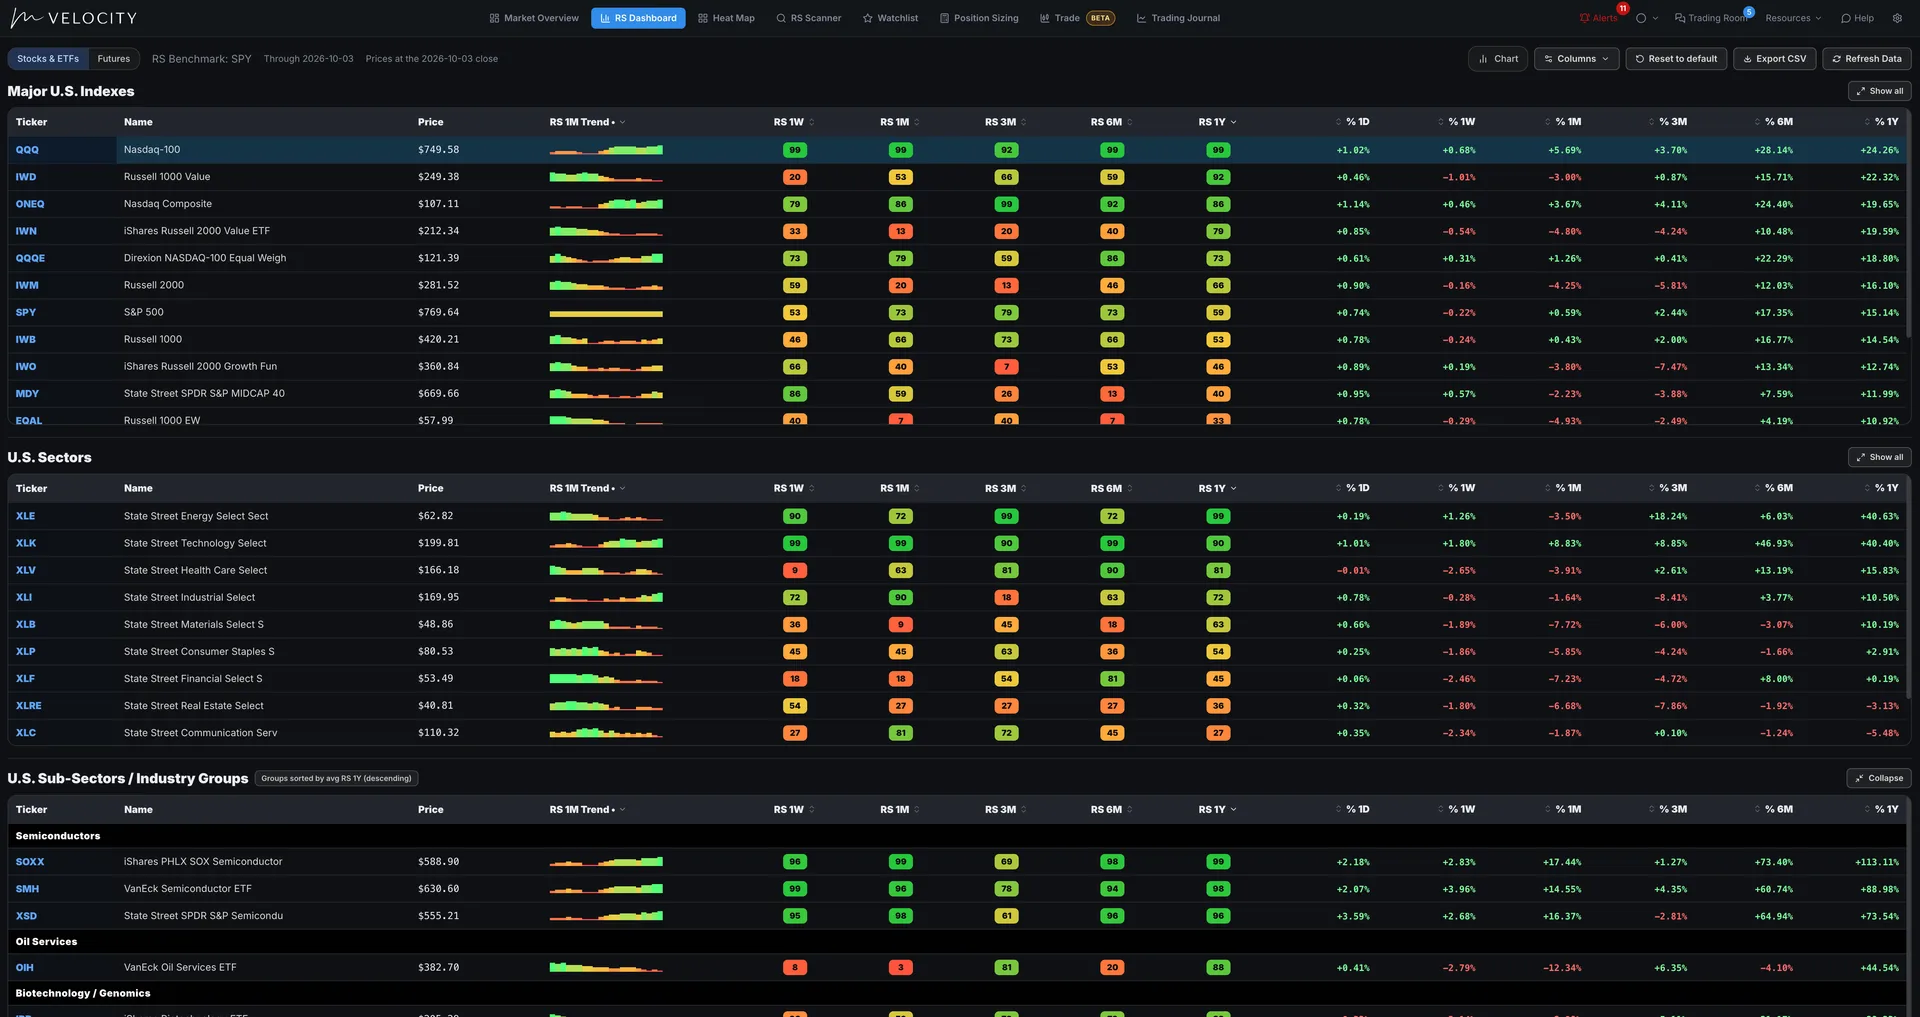
See where strength sits across indexes, sectors, industry groups, and leading names before you pick a stock.
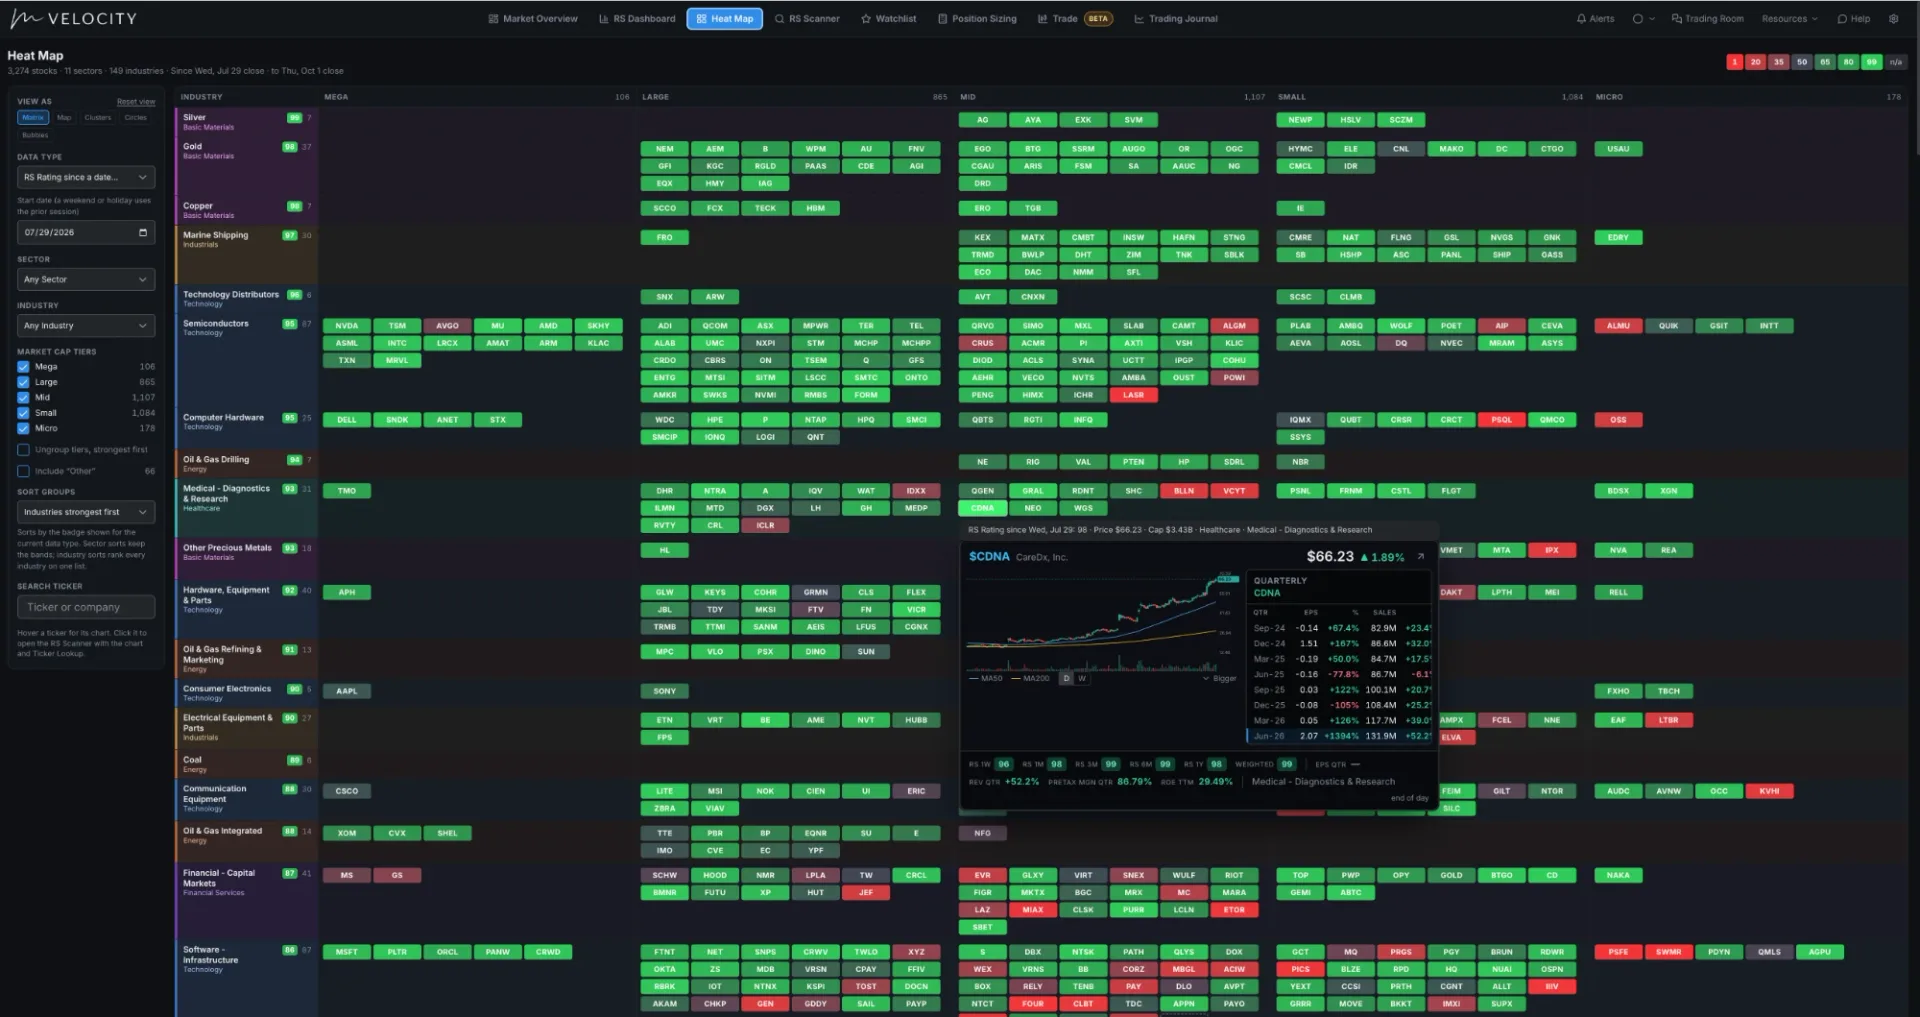
Every stock grouped by industry and market-cap tier and colored by relative strength, so the strongest groups and their leaders stand out at a glance.
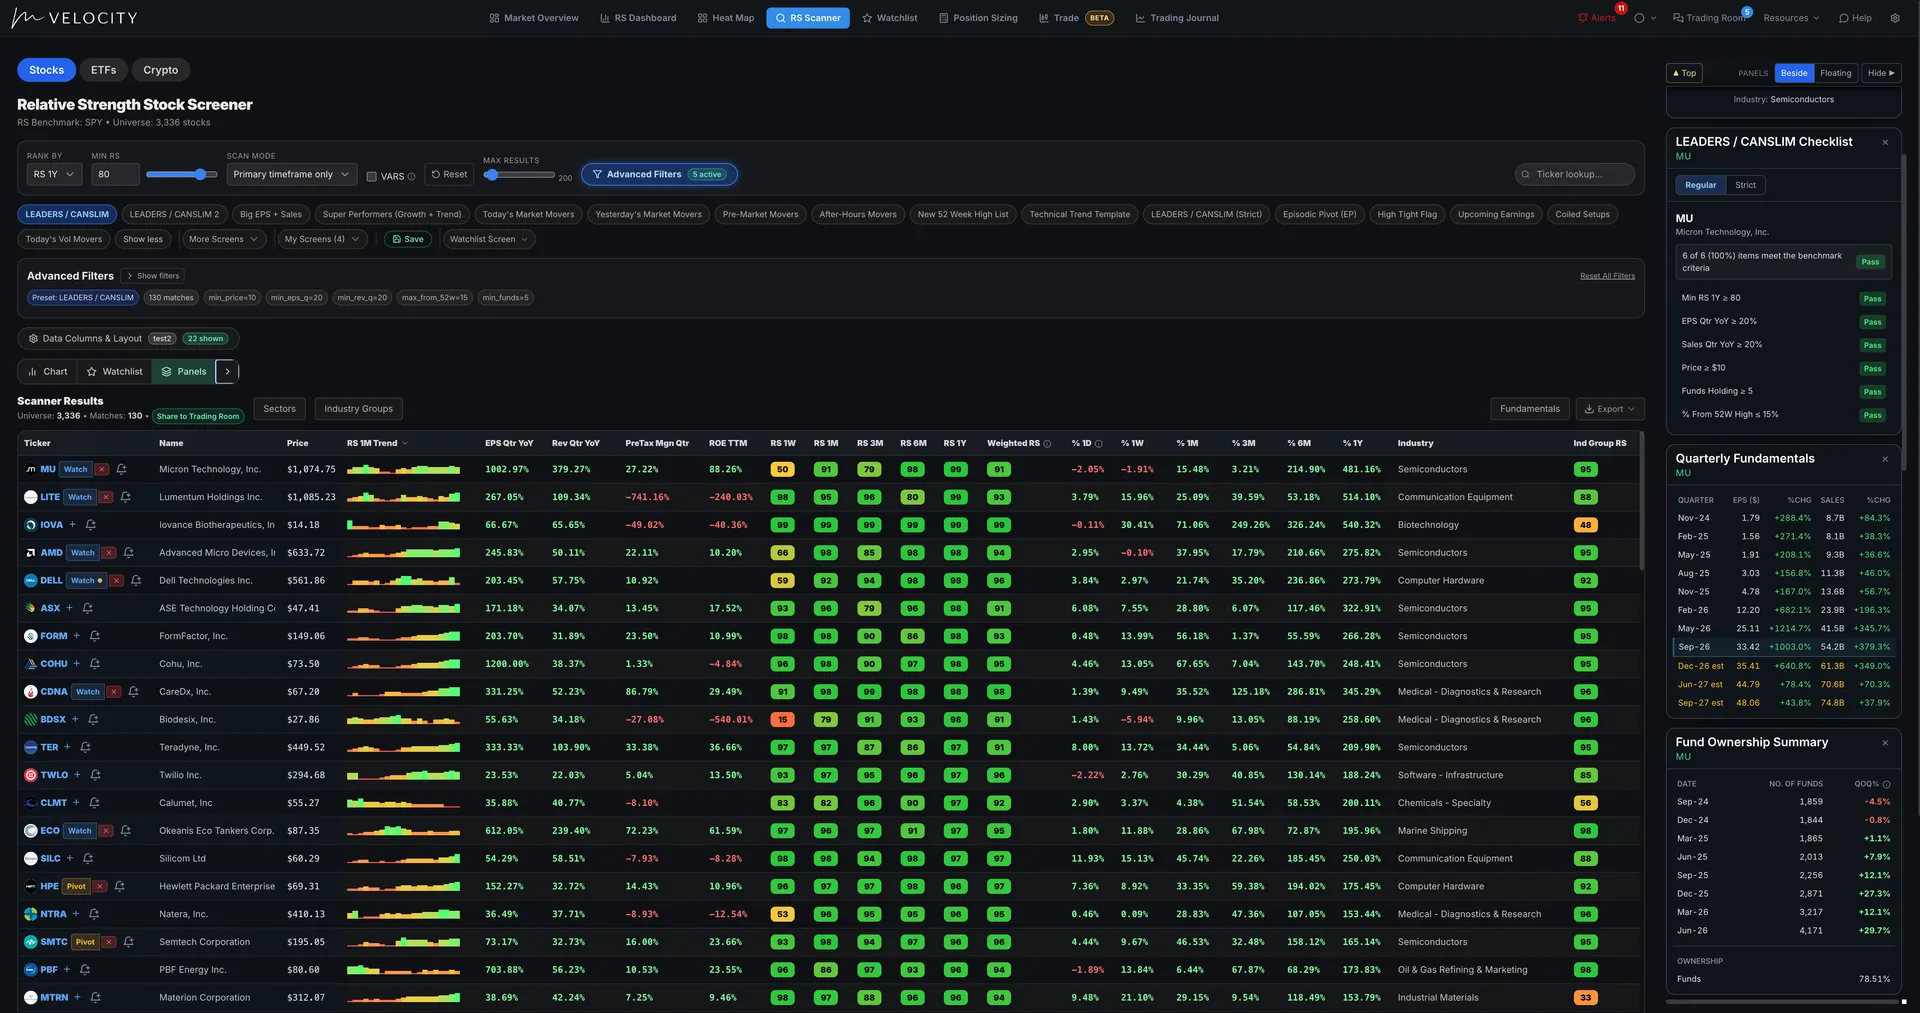
Primary, multi-timeframe, accelerating, weighted, and custom relative strength across thousands of NYSE and Nasdaq stocks, plus earnings, sales, liquidity, and MTS ratings.
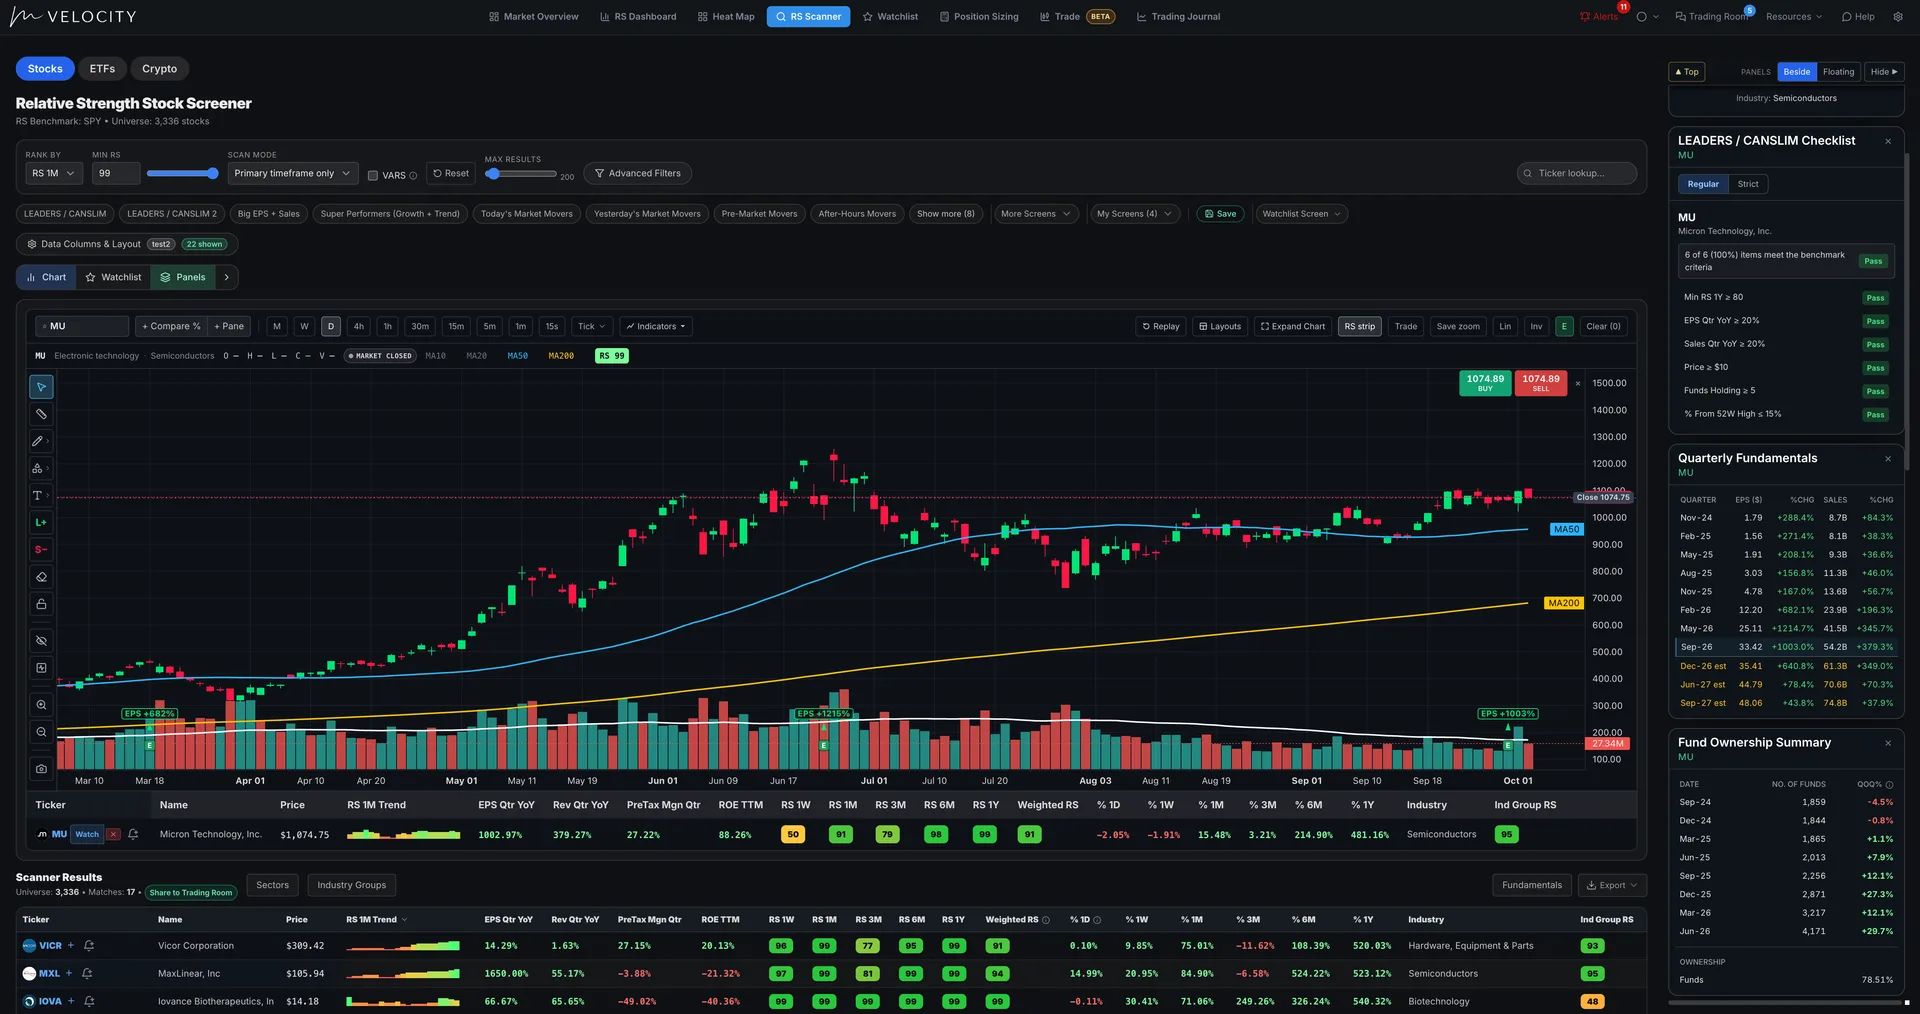
Price action next to the CANSLIM checklist, quarterly fundamentals, and fund ownership, so the setup and the story agree.
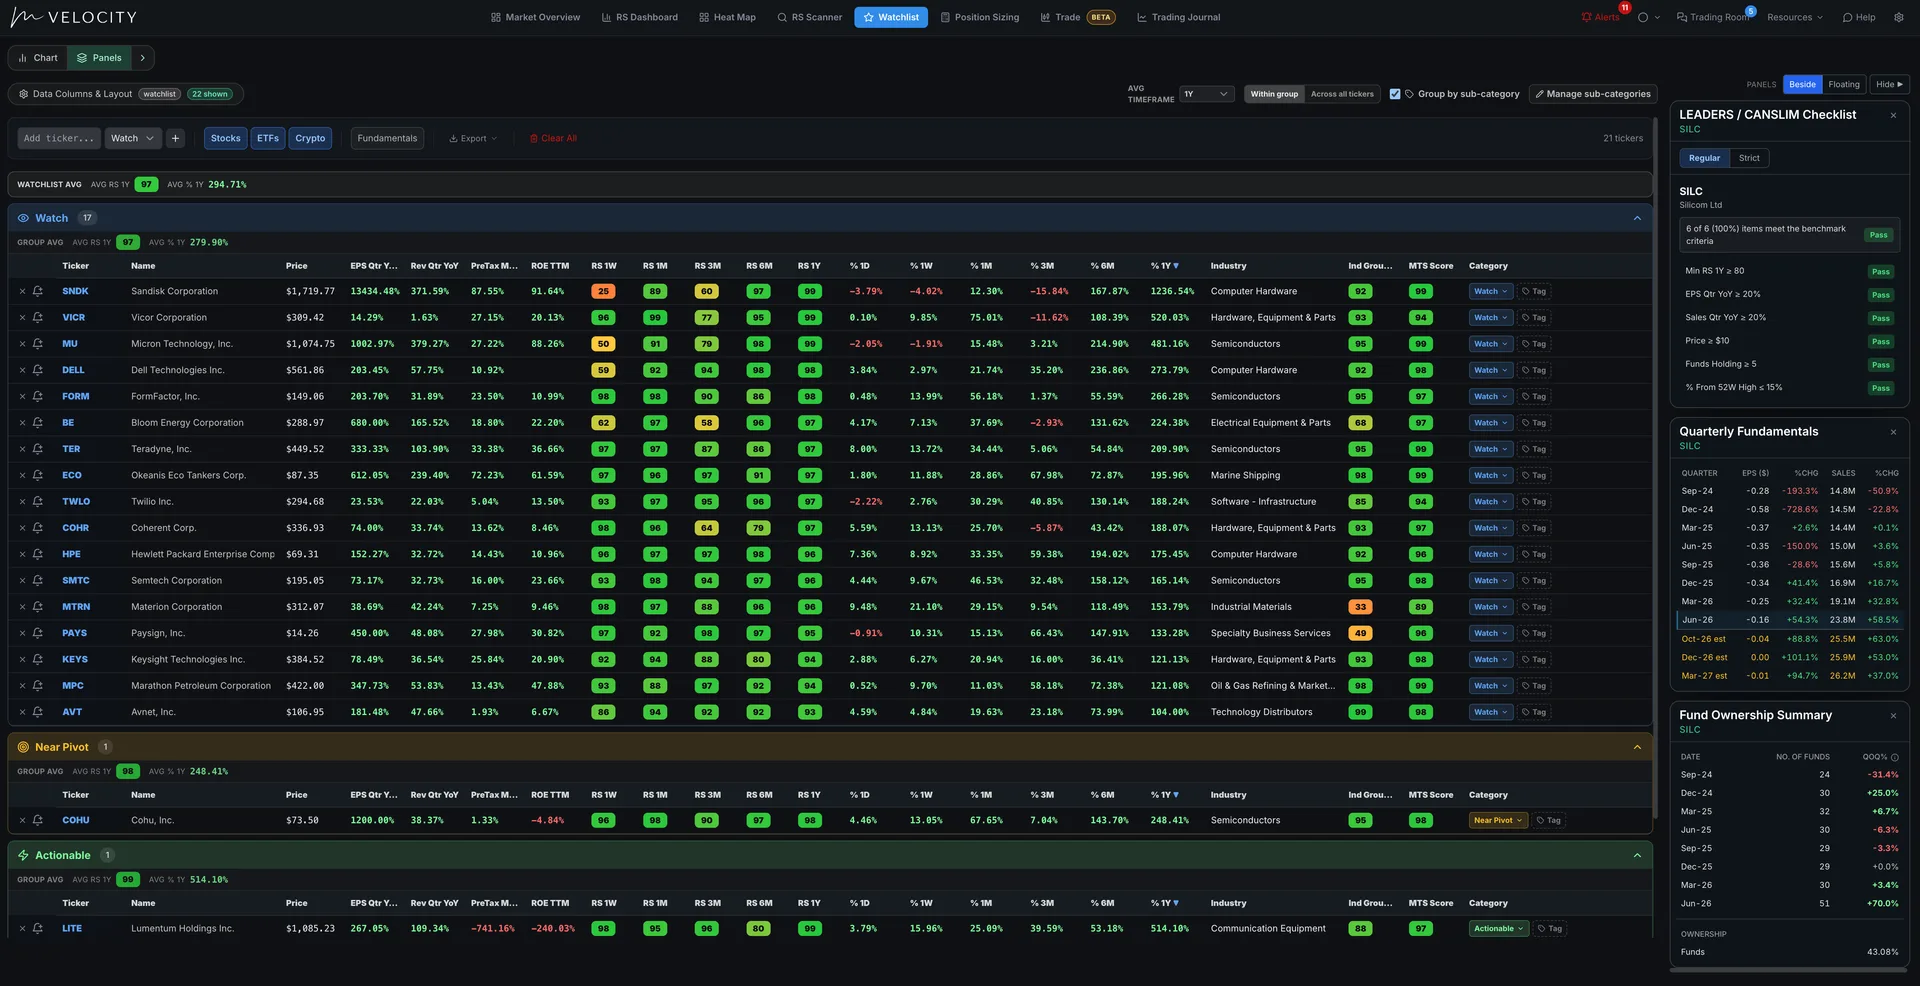
Move names from scan to watch to near pivot to actionable without losing the thread.
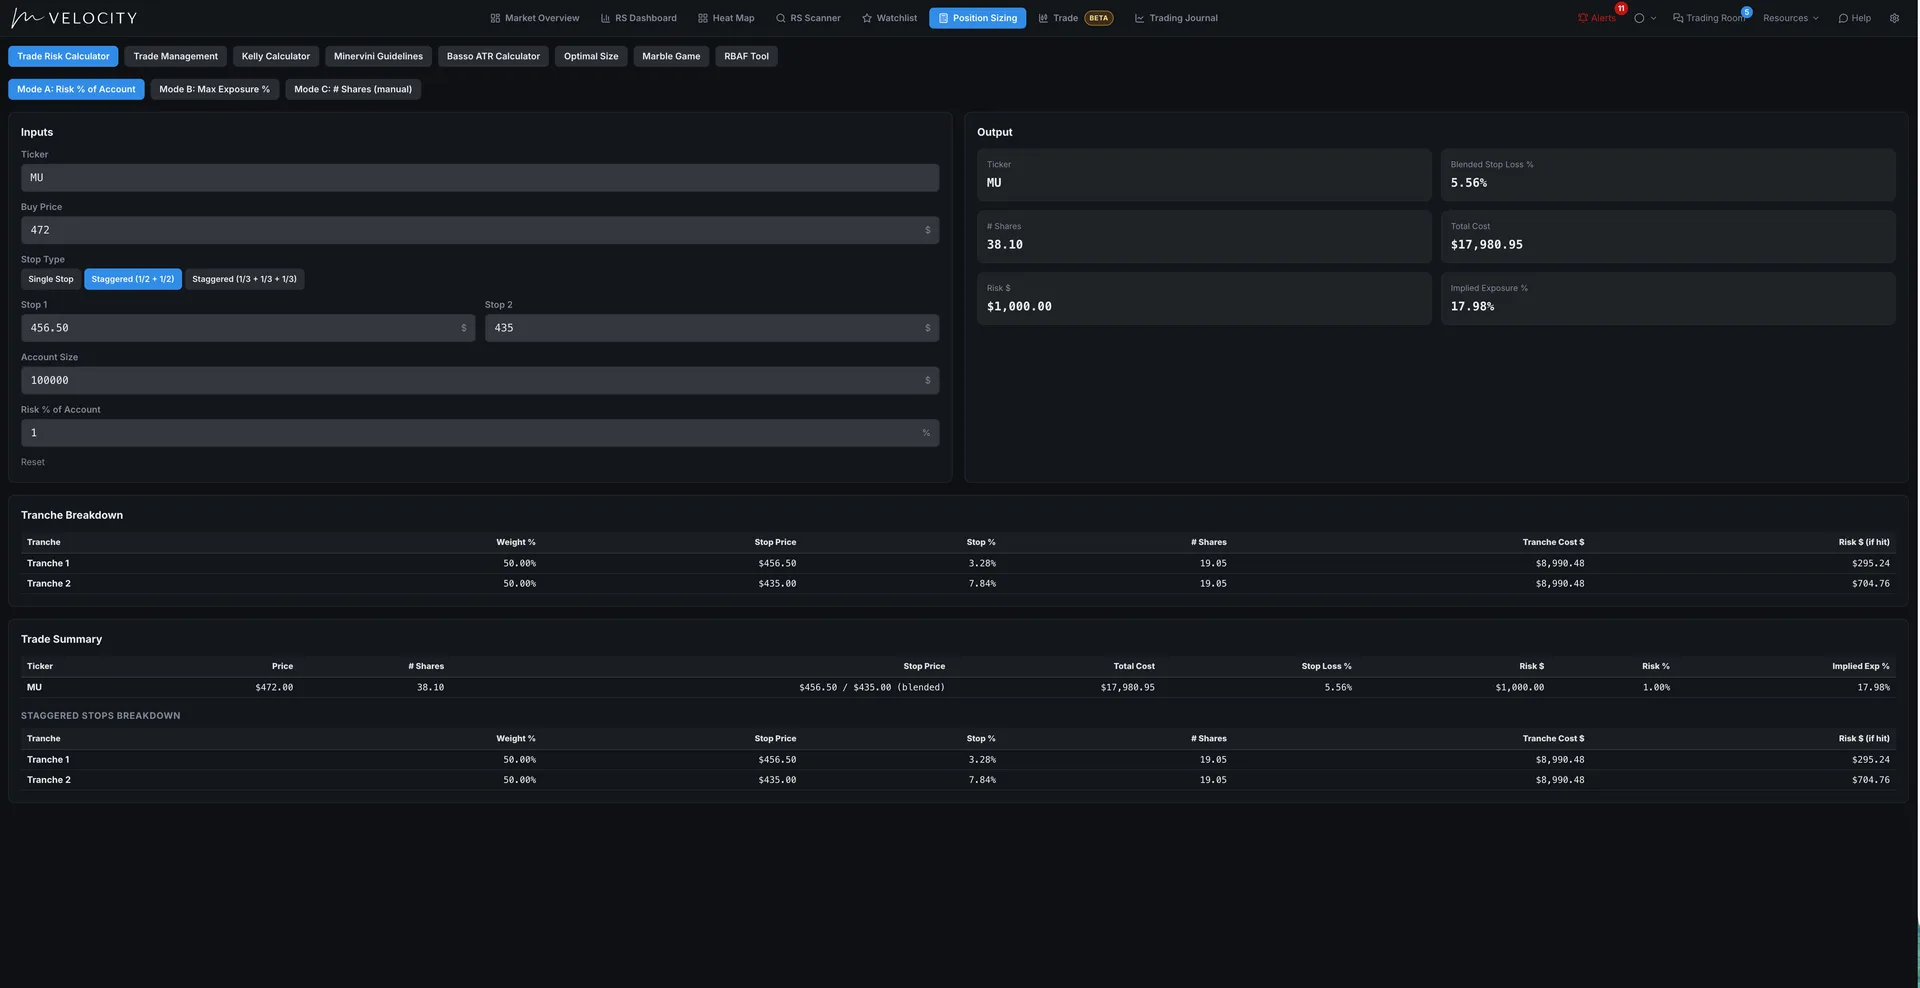
Size from account risk, entry, and stop, including staggered stops. Control portfolio exposure before you click buy.
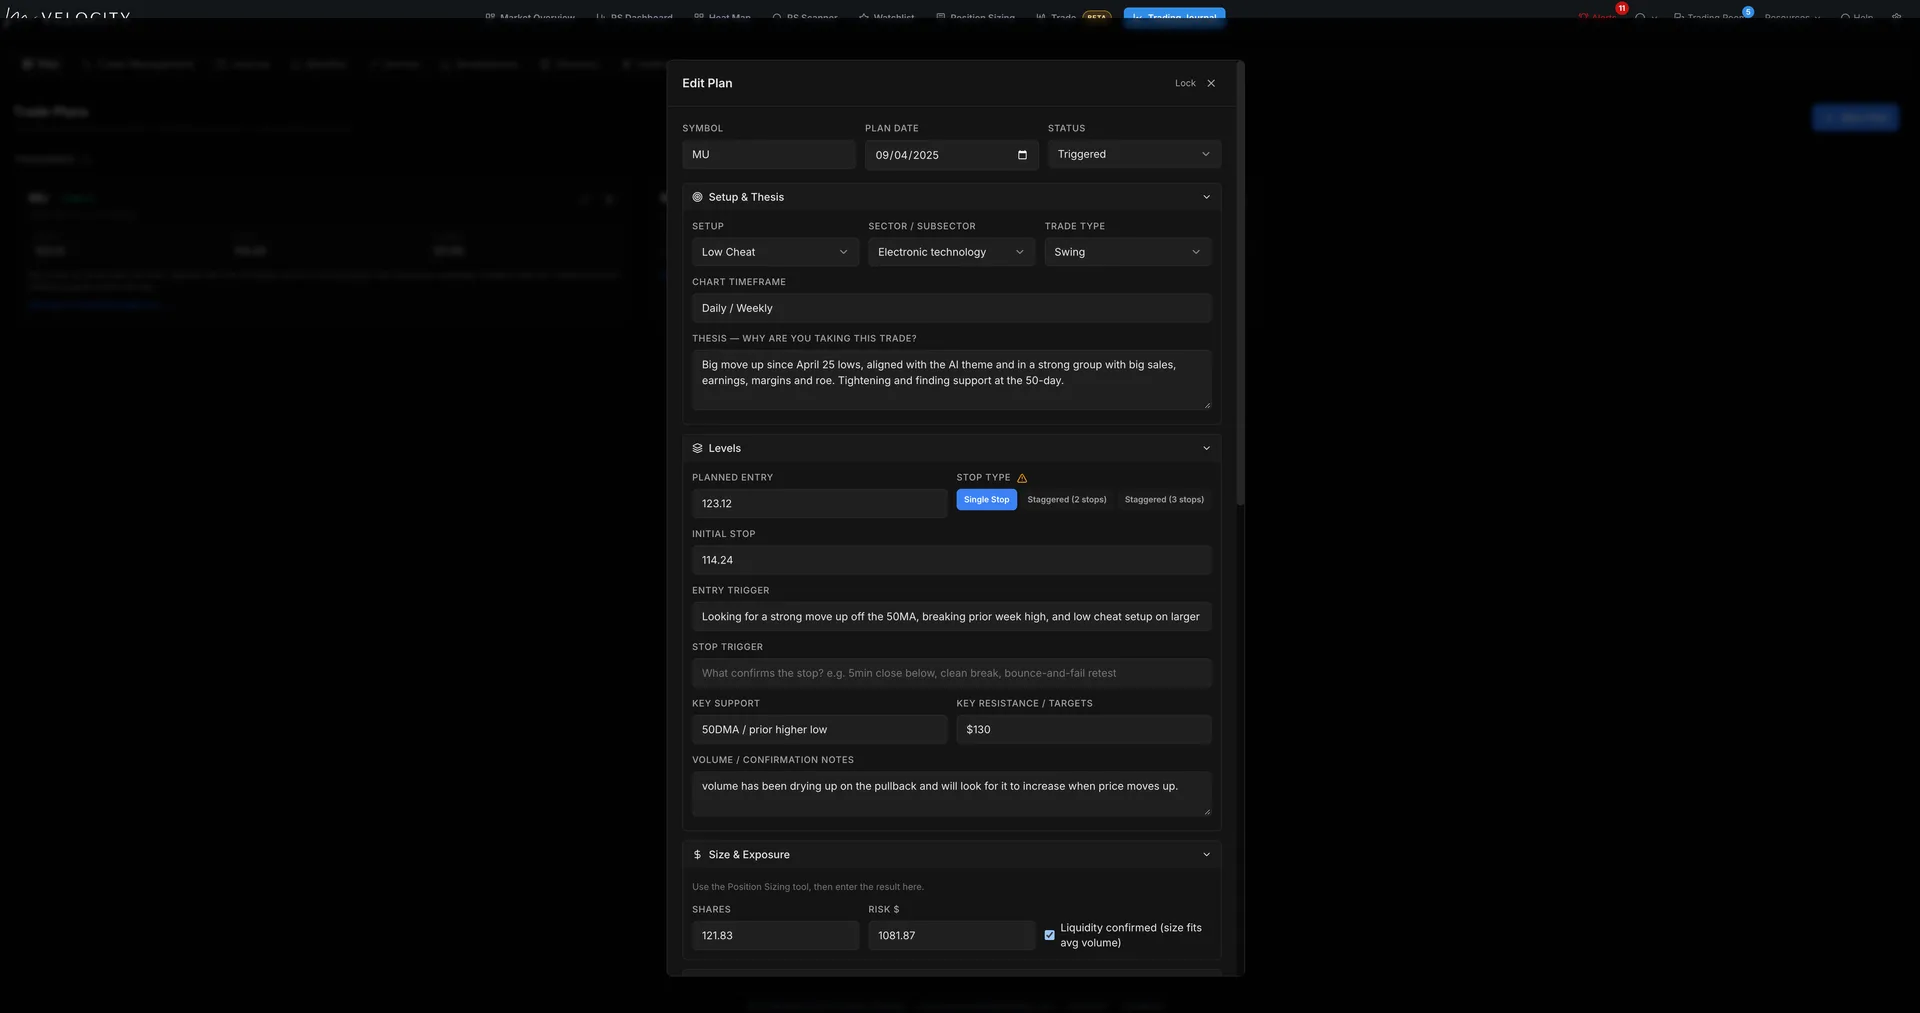
Write the plan (setup, thesis, entry, stop, size), then track the live trade against it with alerts.
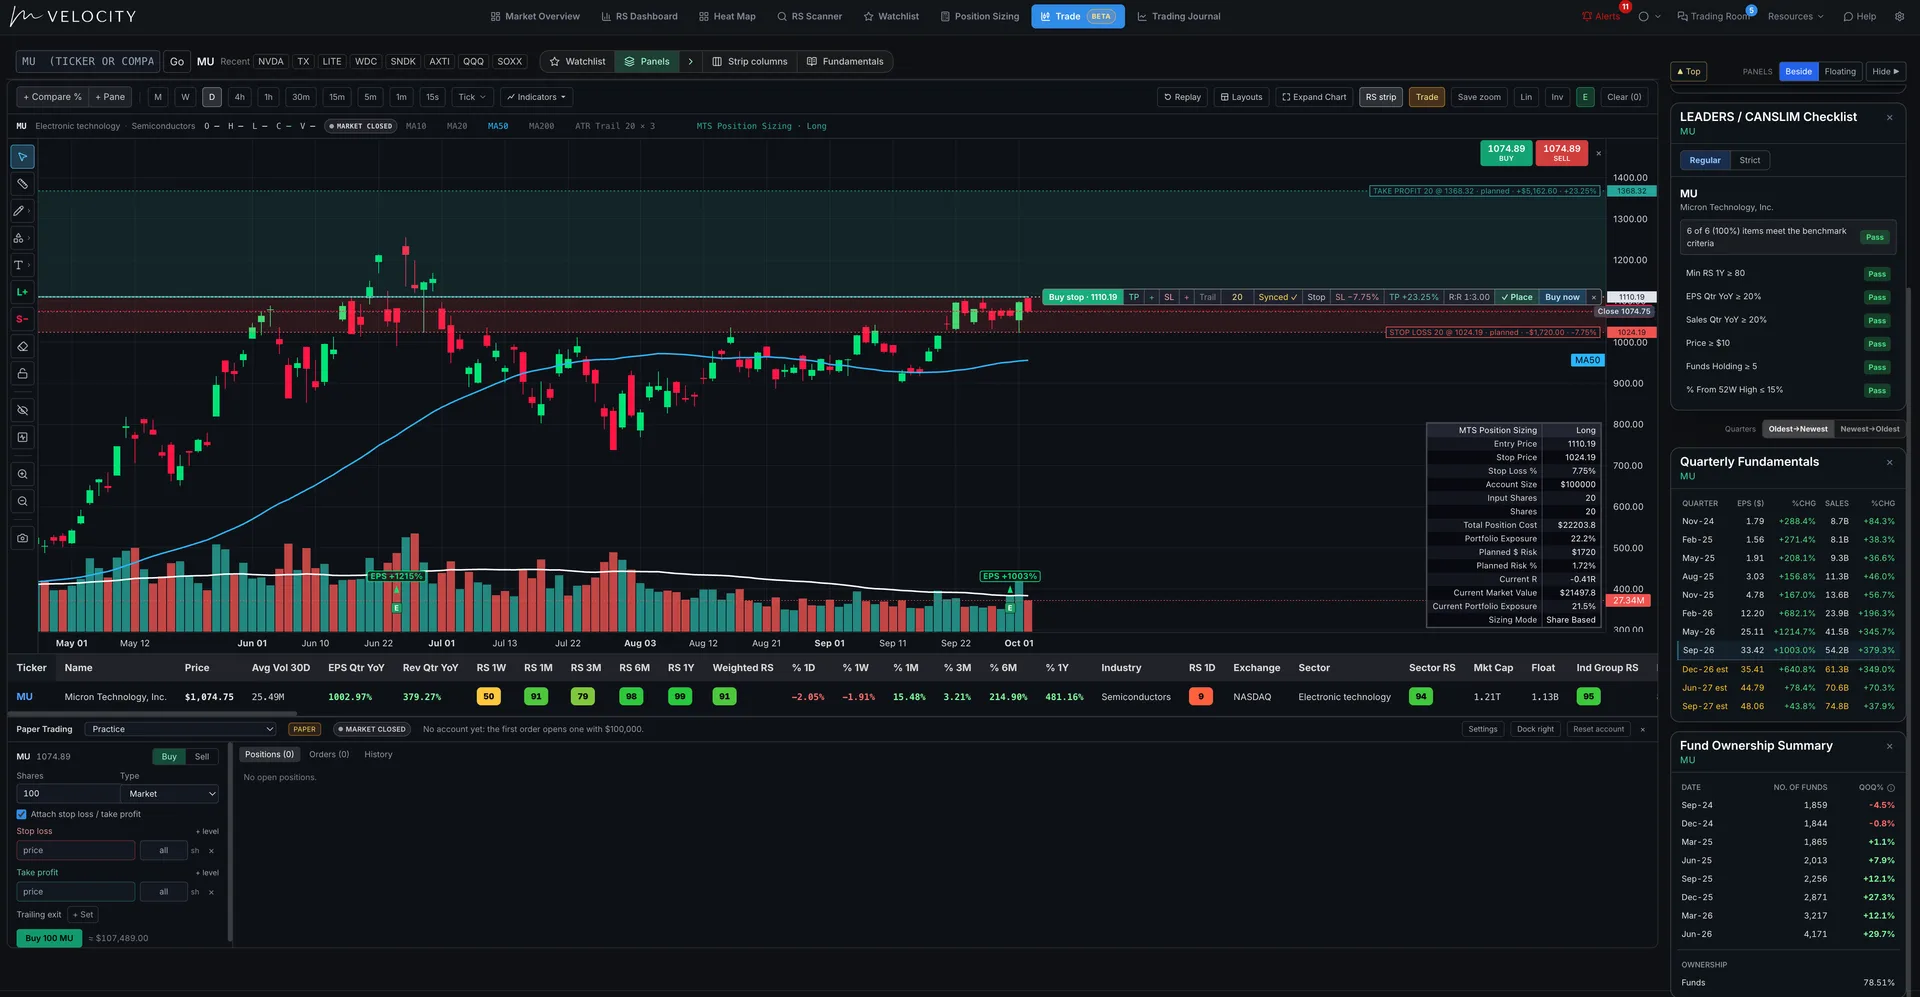
Set your buy stop, stop loss, and profit target right on the chart and see shares, dollar risk, and exposure as you go. Practice the same way with a paper trading account.
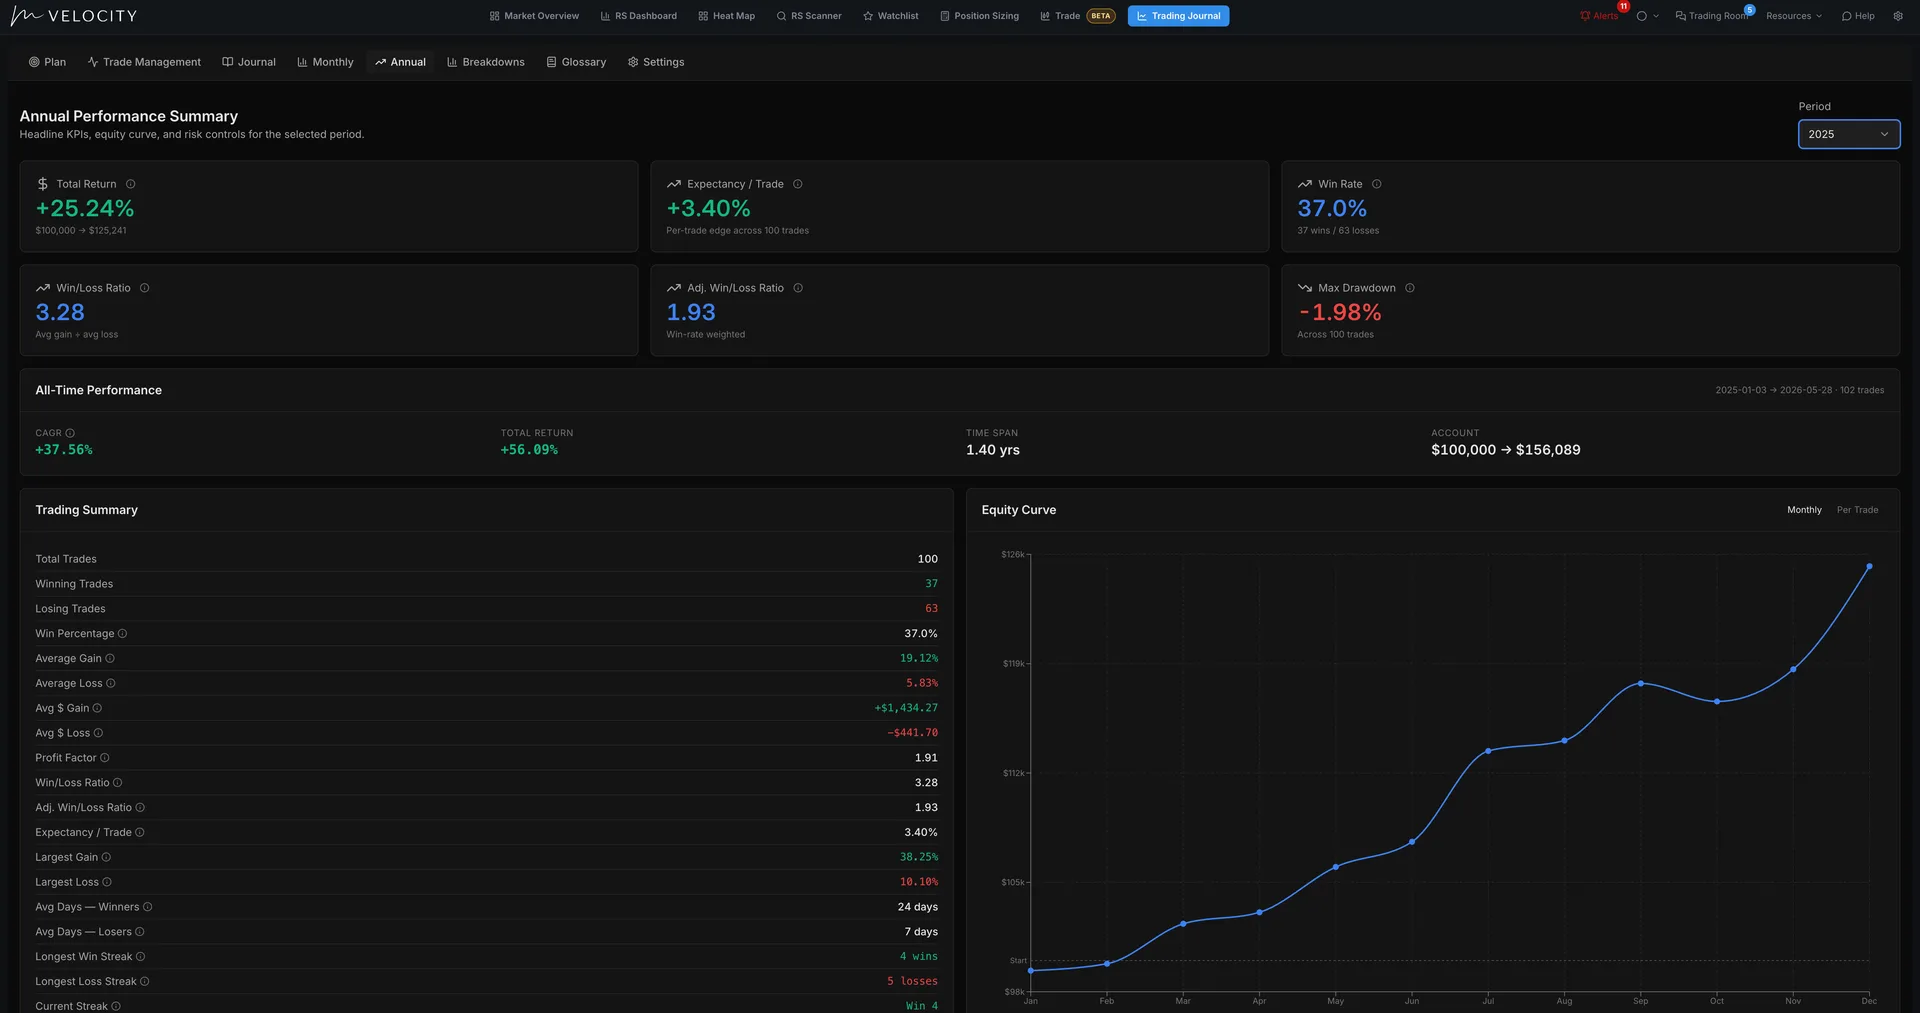 Sample data
Win rate, R-multiples, drawdowns, expectancy, and setup stats, so you stop guessing what your edge is.
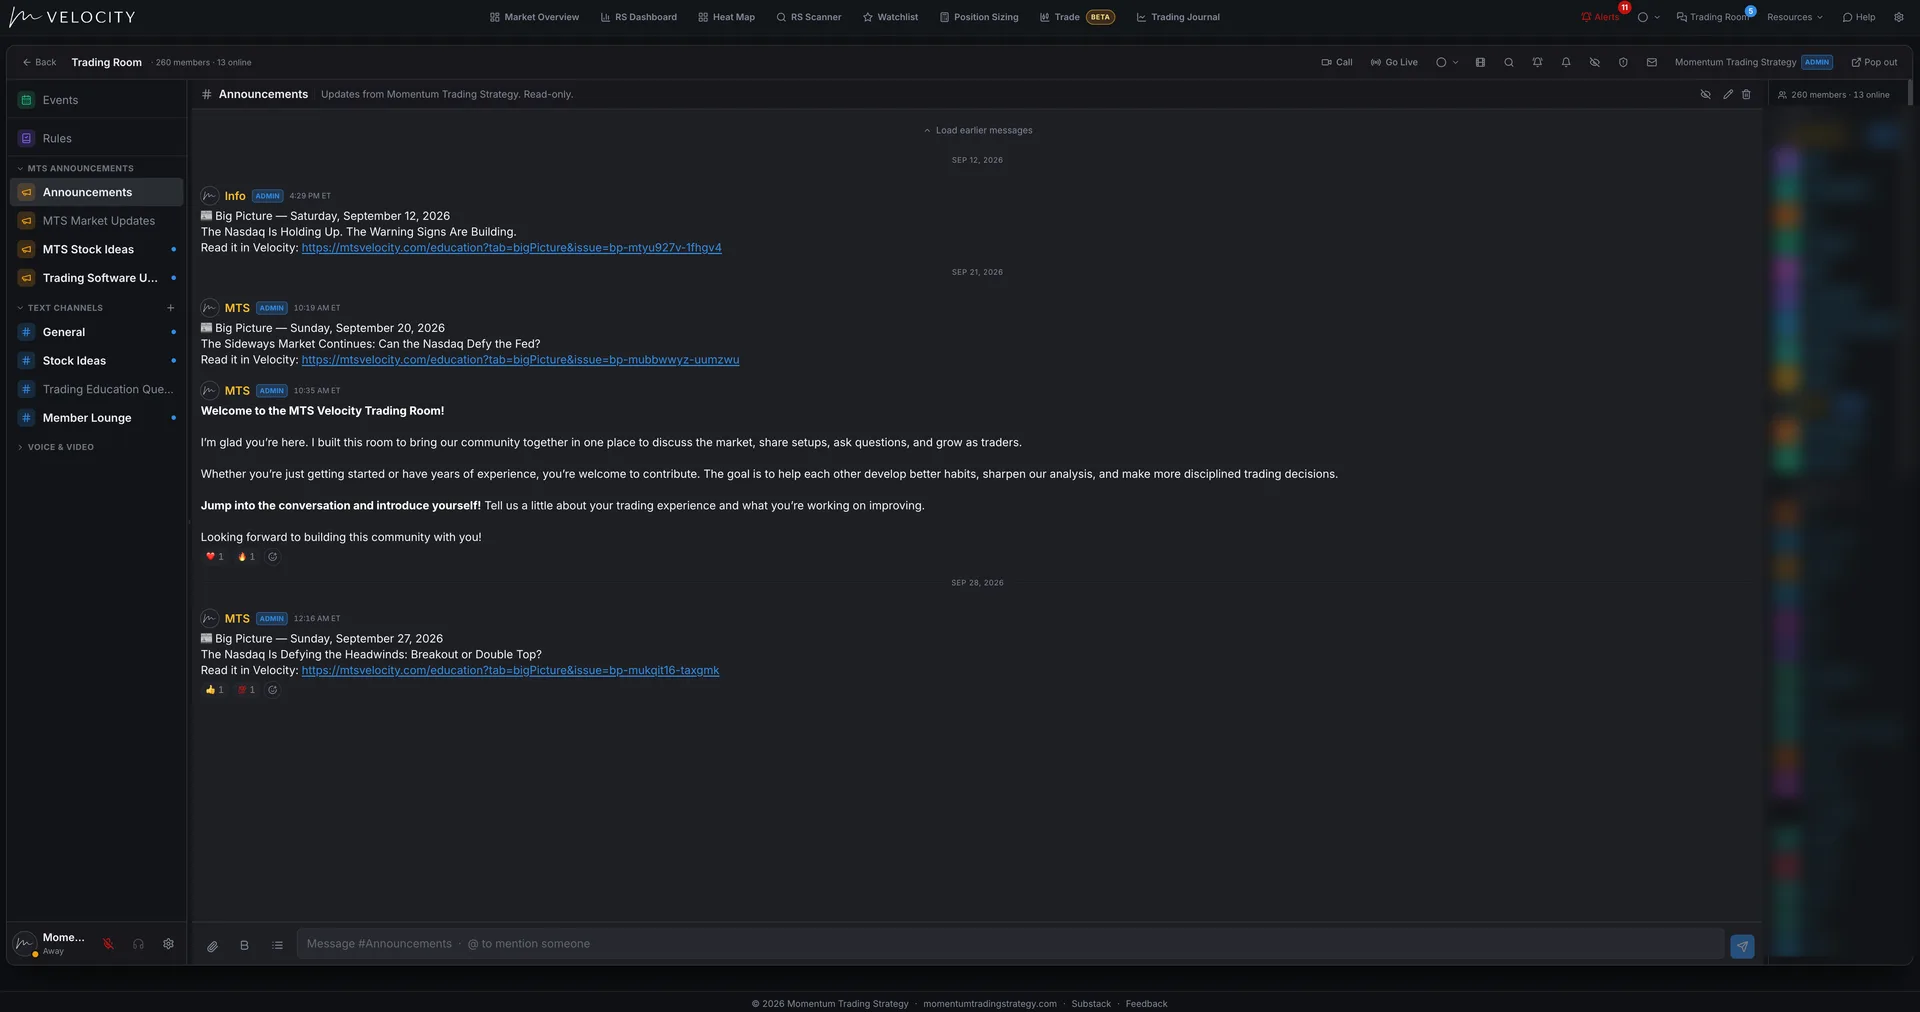
Market observations, tickers, and potential setups through the week, plus software and process discussion with other members.
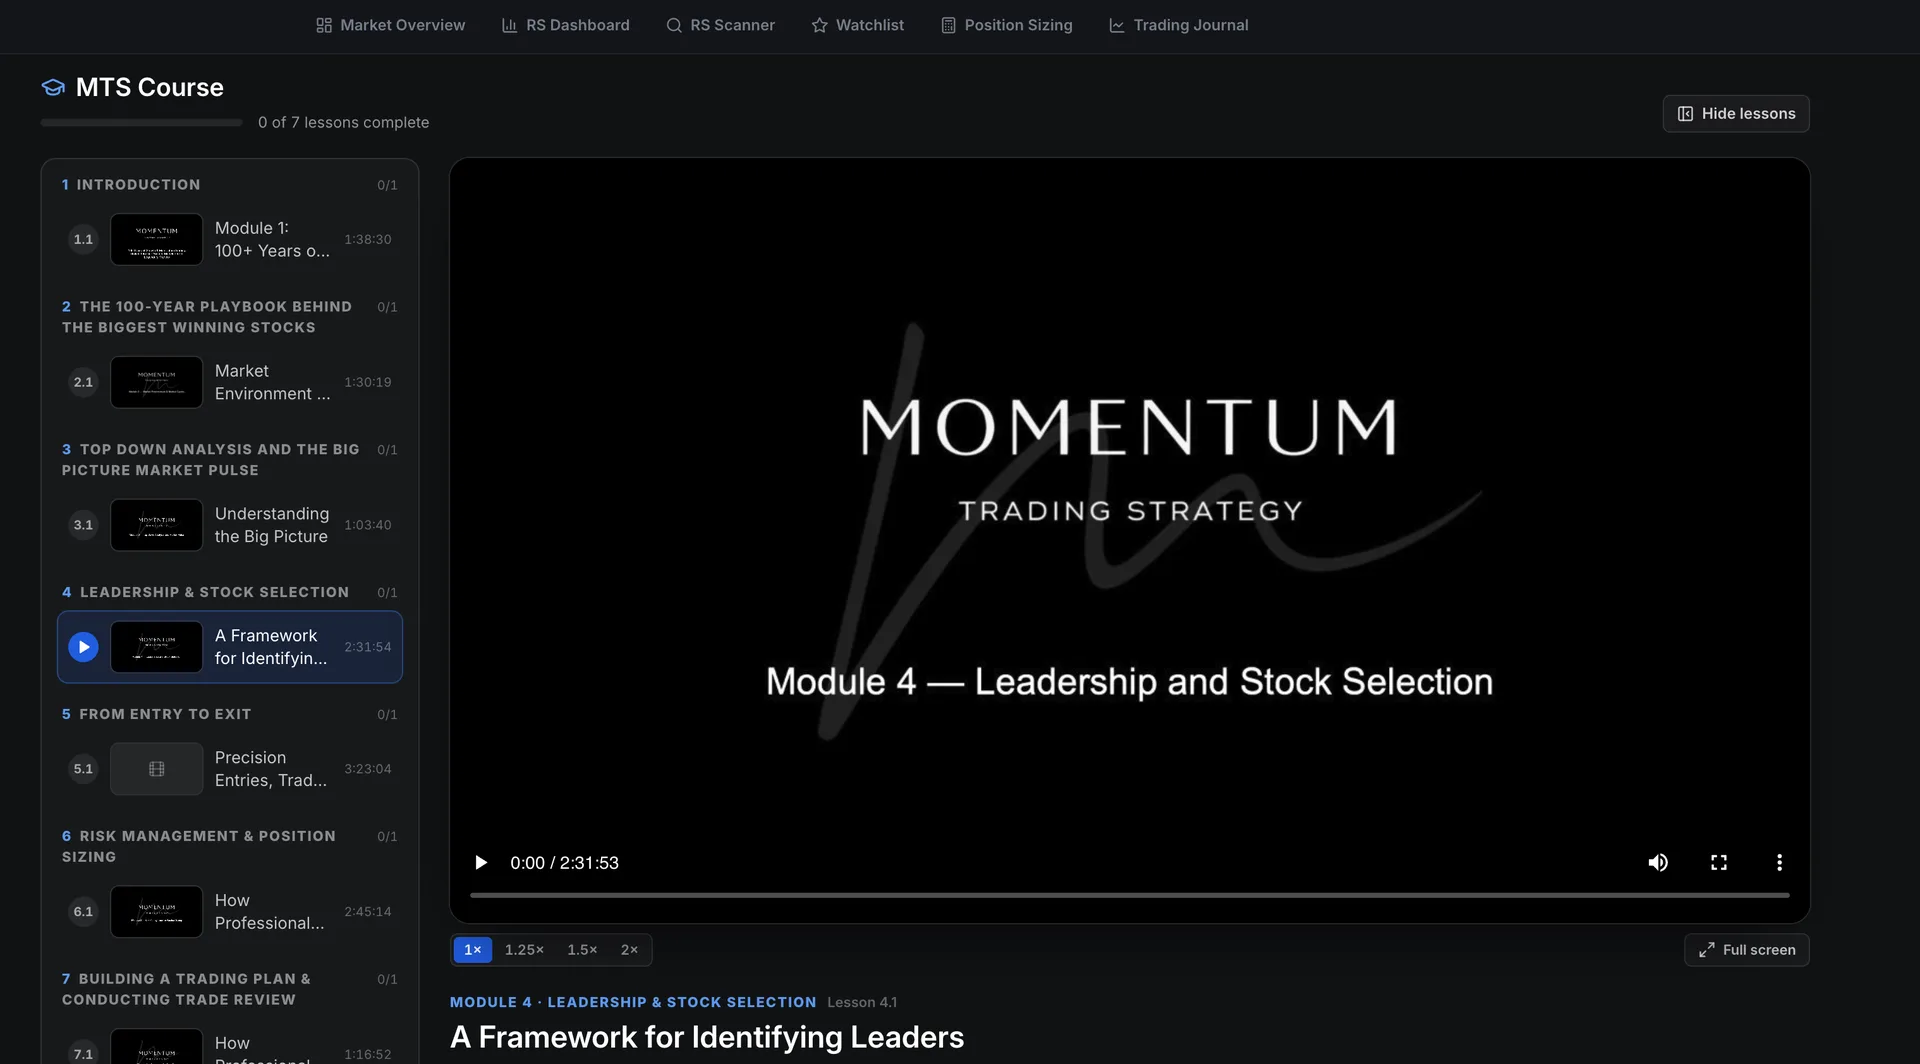
The full Momentum Trading Strategy Course and the Big Picture Market Pulse newsletter, inside the same app.
Ratings you won’t find anywhere else
Every rating is computed inside MTS Velocity and shown on the screener, the watchlists, and your charts, so the leaders surface the moment you open the app.
Relative strength across multiple timeframes, accumulation and distribution, earnings and sales growth, industry group strength, and the MTS Score that ties them together.
Simple by design
Step 1
Use the Market Overview to set your exposure before you look at a single stock.
Step 2
Use the RS Dashboard and RS Scanners to surface the strongest stocks and groups.
Step 3
Plan the trade, calculate position size and set alerts before you enter.
Step 4
Manage the open trade, journal it, and let the analytics sharpen the next one.
Who it’s for
Rank the market by relative strength across multiple timeframes and ride the names leading it.
Growth fundamentals, EPS and Sales ratings, and a CANSLIM checklist on every stock.
Quarterly fundamentals, fund ownership and industry group strength side by side with the chart.
Daily RS scans, alerts and position sizing built for holds of days to weeks.
Weekly and monthly relative strength, market exposure guidance and a journal that tracks the whole campaign.
Price action and ratings in one screen, so the setup and the story line up before you buy.
All-Access
All-Access is $300 $120/year, or $100 $50/month month to month. Includes MTS Velocity (with the MTS indicators built into its charts), the full course, the weekly Big Picture Market Pulse, and the members' Trading Room.
Buy here, then create your login and sign in at MTS Velocity.
All-Access includes the MTS Velocity software, the full course, the weekly Big Picture Market Pulse, and the members' Trading Room. Cancel anytime.
Already a member? Member login.