Momentum Trading Strategy

Notes

Market Conditions

Reading the overall market and deciding how aggressive to be.

Showing 1–4 of 4 notes

$XLK ×
View on Substack ↗

Big Shift in Relative Strength

Big change in relative strength over the last few weeks.

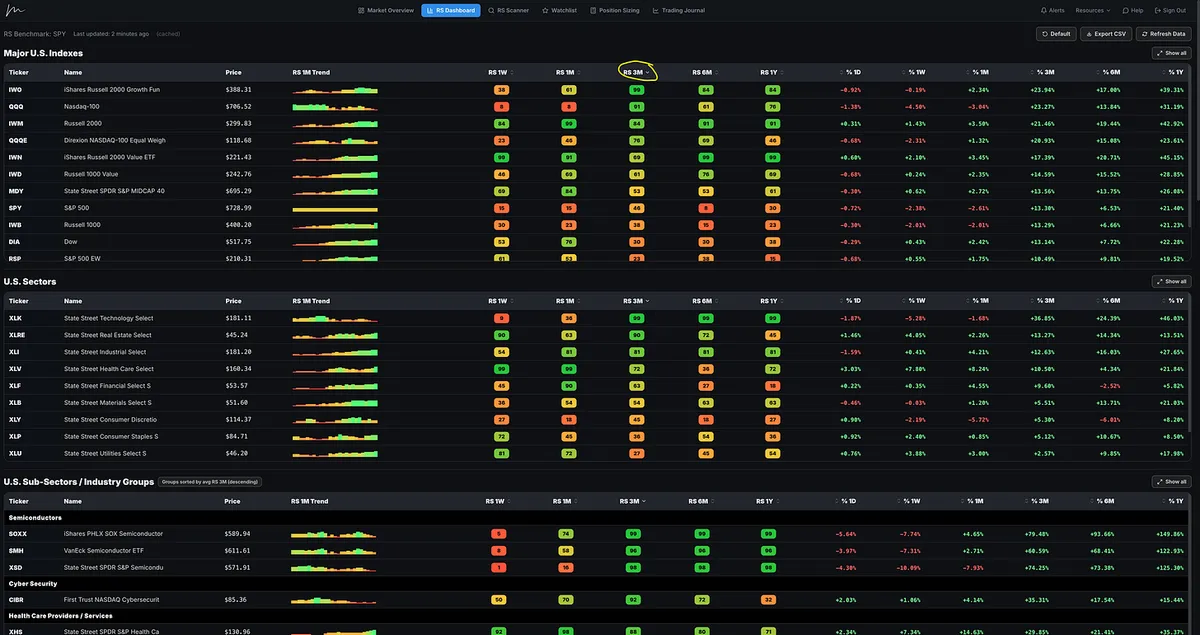
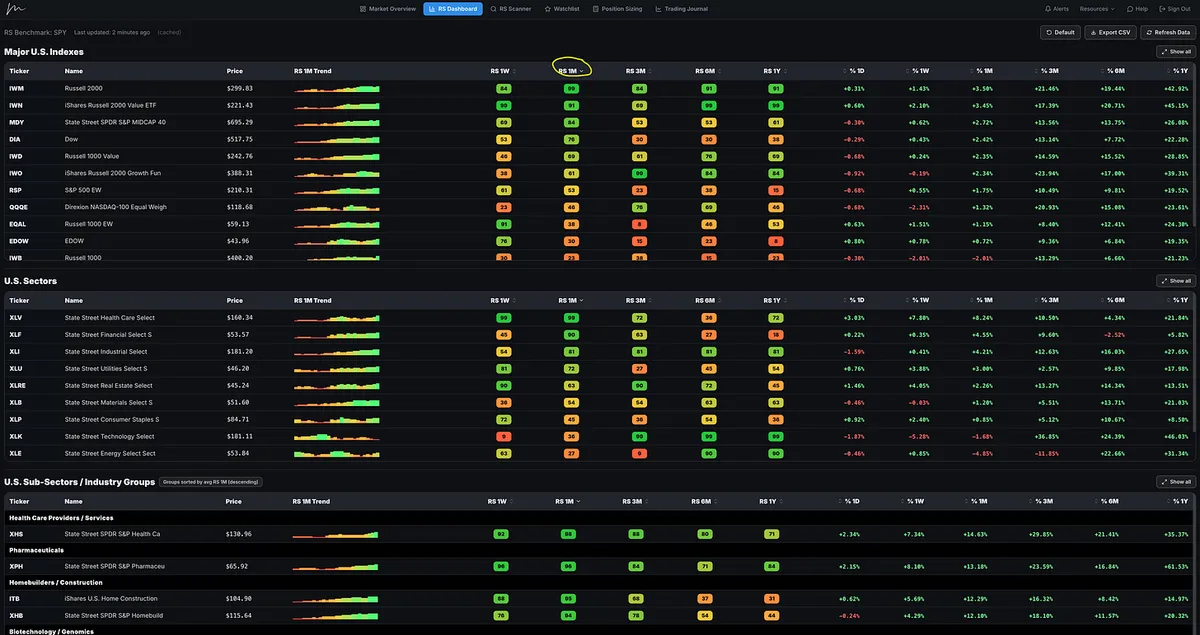
For weeks/months, the clear leadership across the major indexes has been the Nasdaq 100, Nasdaq 100 equal weight, Russell 2000 growth, and IWM.

Sector leadership has also been obvious: XLK technology has dominated, with semiconductors leading this Stage 2 uptrend since the March 30th lows. That strength has been followed by other tech-related groups like computer hardware, electrical equipment, software, and other growth areas.

But this week, the shift is much clearer.

Now the leadership is coming from:

• IWM, Russell 2000

• IWN, Russell 2000 Value

• MDY, S&P 400 Mid Caps

• DIA, Dow Jones

On the sector side, XLV healthcare is leading, followed by financials, industrials, and utilities.

Under the surface, the strength is showing up in healthcare providers, pharmaceuticals, homebuilders, biotech, insurance, and banks.

This has been building for a few weeks, but this week is the clearest rotation we’ve seen.

Make sure to dive into the next Big Picture Market Pulse before the market opens Monday.

It should be out soon.
View on Substack ↗

Think You Can Ignore the Market? Look at These Screenshots.

One of the questions I get asked most is:

"Why do you put so much emphasis on the general market?"

Because the market sets the environment that almost every stock trades in.

Since the April follow-through day, the market has been led by the Nasdaq, growth stocks, technology (XLK), and AI-related industry groups.

  • Semiconductors.

  • Computer Hardware.

  • Electronic Components.

  • Communication Equipment.

  • Computer Data Storage

  • Telecom

These weren't weak groups trying to catch up.

These were the leaders driving the advance.

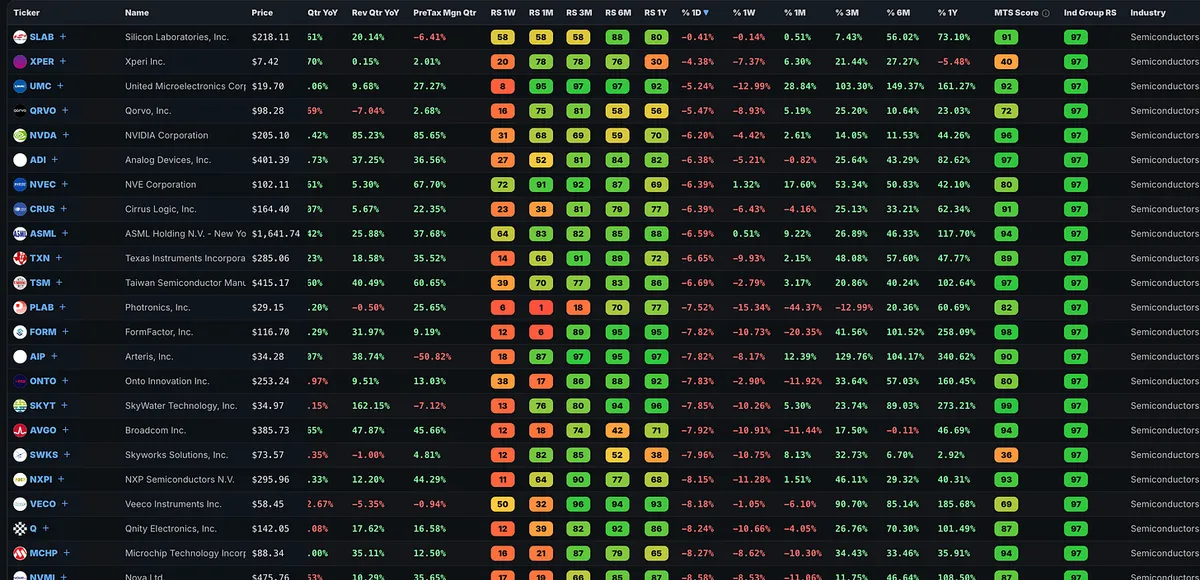
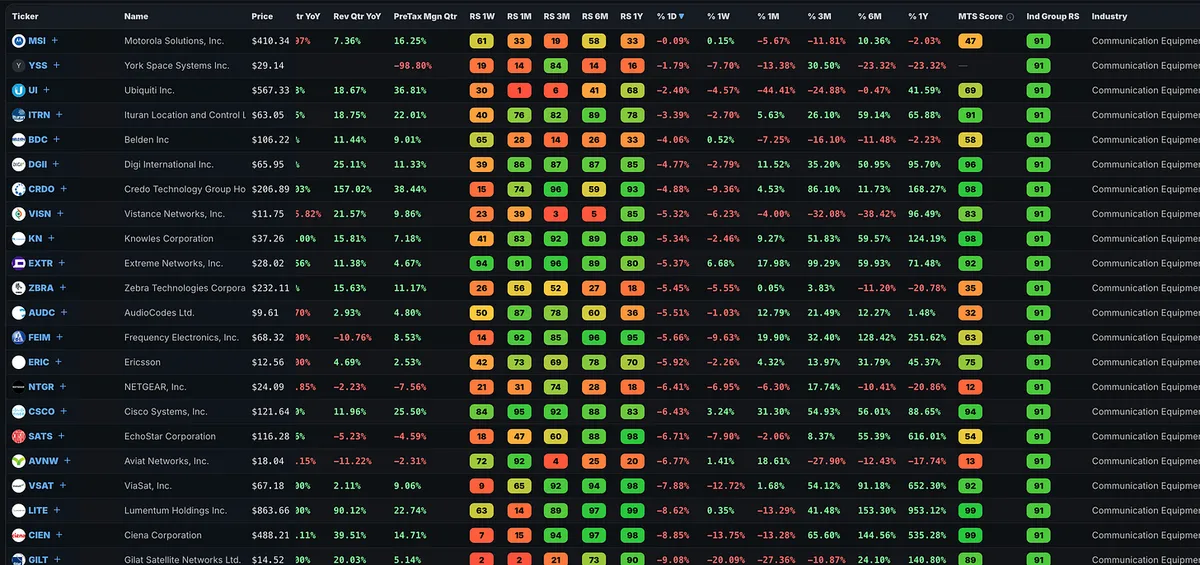
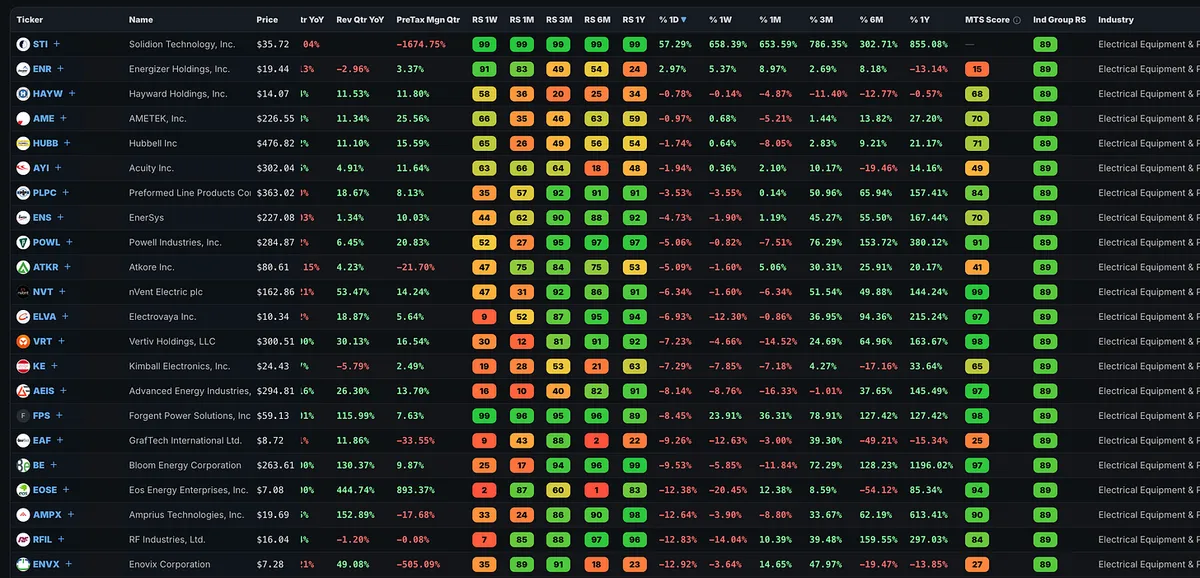
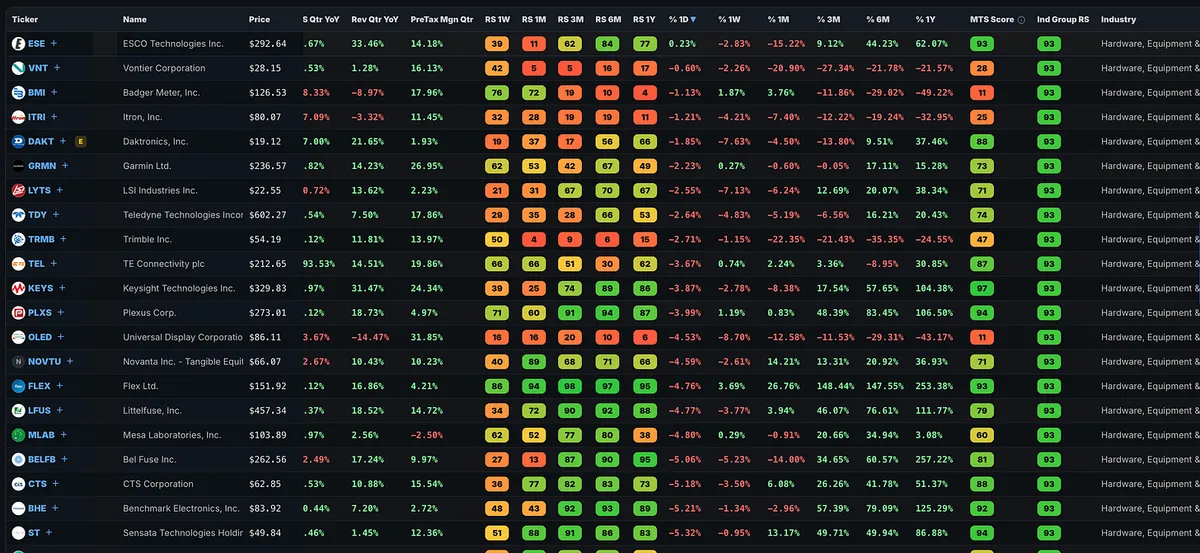
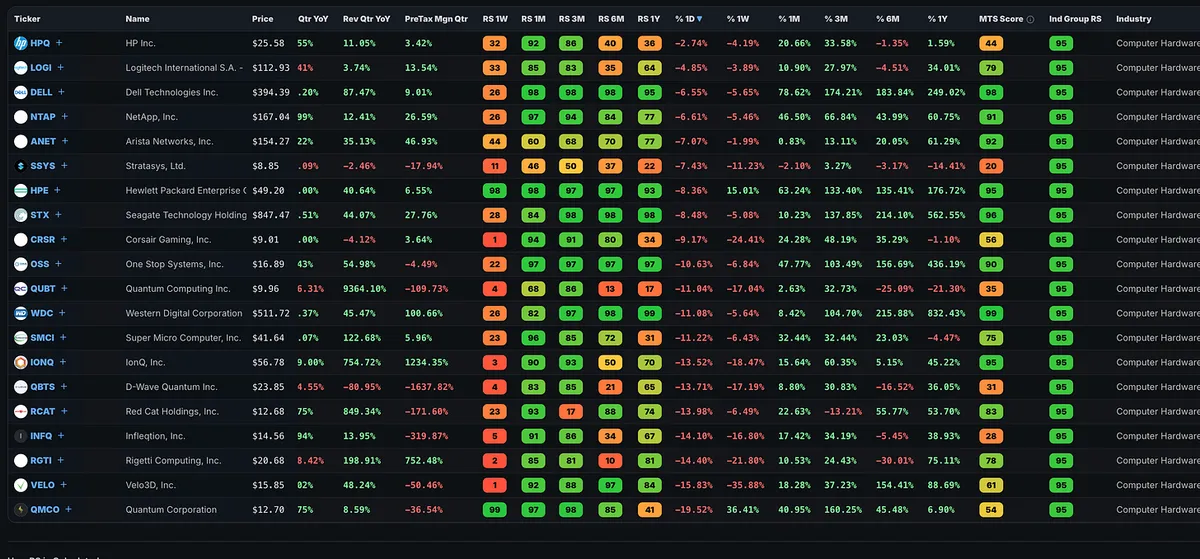
Now look at the screenshots.

On Friday, the Nasdaq fell 4.8% and the S&P 500 dropped 2.64%. Both sliced right through their 20-day moving averages.

If there was ever a time for the strongest stocks to prove they could ignore the market, this was it.

But they didn't.

The same industry groups that had been leading the rally were hit across the board. Many of their top stocks were down 5%, 8%, 10% or more.

How many truly bucked the trend?

Very few.

This is exactly why William O'Neil placed so much importance on the "M" for Market Direction in CAN SLIM. After studying more than a century of the biggest stock market winners, he recognized that even the strongest leaders are heavily influenced by the direction of the general market.

The lesson isn't that you should fear every red day, but you should respect the market.

Stock selection matters.

Industry group selection matters.

But the general market is the tide that lifts or lowers almost every boat.

The screenshots are a perfect reminder that the goal isn't simply to own the strongest stocks.

It's to own the strongest stocks when the wind is at your back.

View on Substack ↗

Technology Continues to Dominate

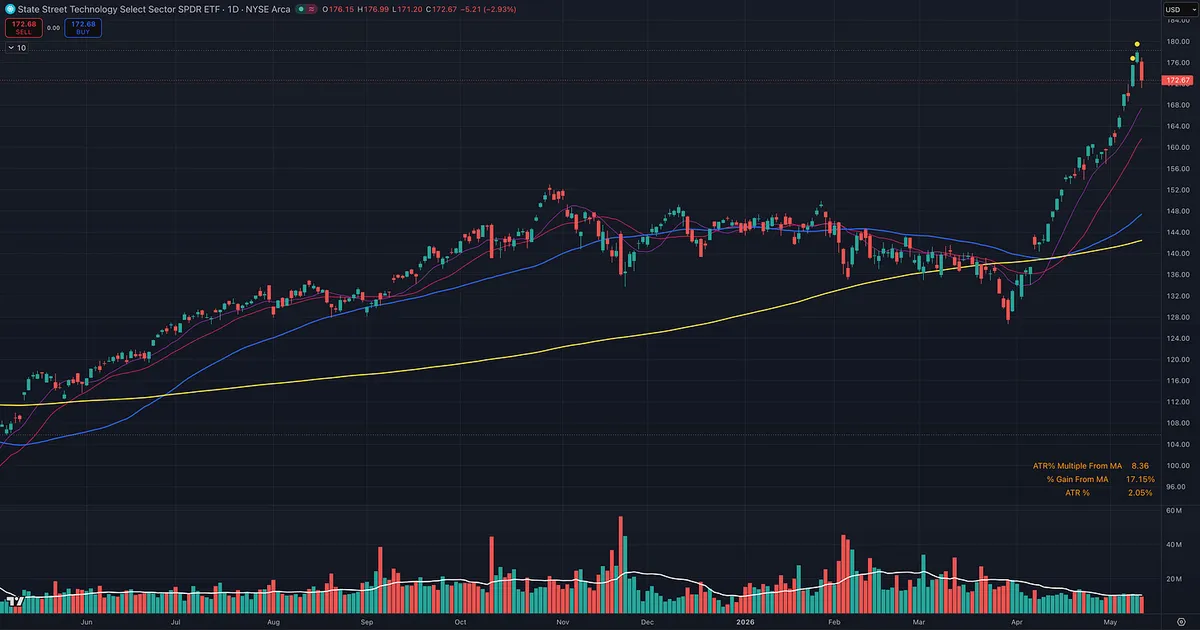
Looking across the 11 major U.S. sectors, one thing remains remarkably clear: technology continues to lead by a wide margin.

Since the April follow-through, no other sector has come close to matching the performance of XLK. The relative strength advantage has been obvious and consistent every week we've reviewed the data. Leadership continues to be concentrated in technology and the growth-oriented industry groups.

As traders, our job is not to argue with leadership. Our job is to identify where capital is flowing and align ourselves accordingly. The evidence has been remarkably clear. If you have been fighting this leadership or searching for strength in weaker areas of the market, perhaps this should be your wake-up call.

View on Substack ↗

Big Down Day? The Warning Signs Were Already There

Nobody should be shocked by today’s price action.

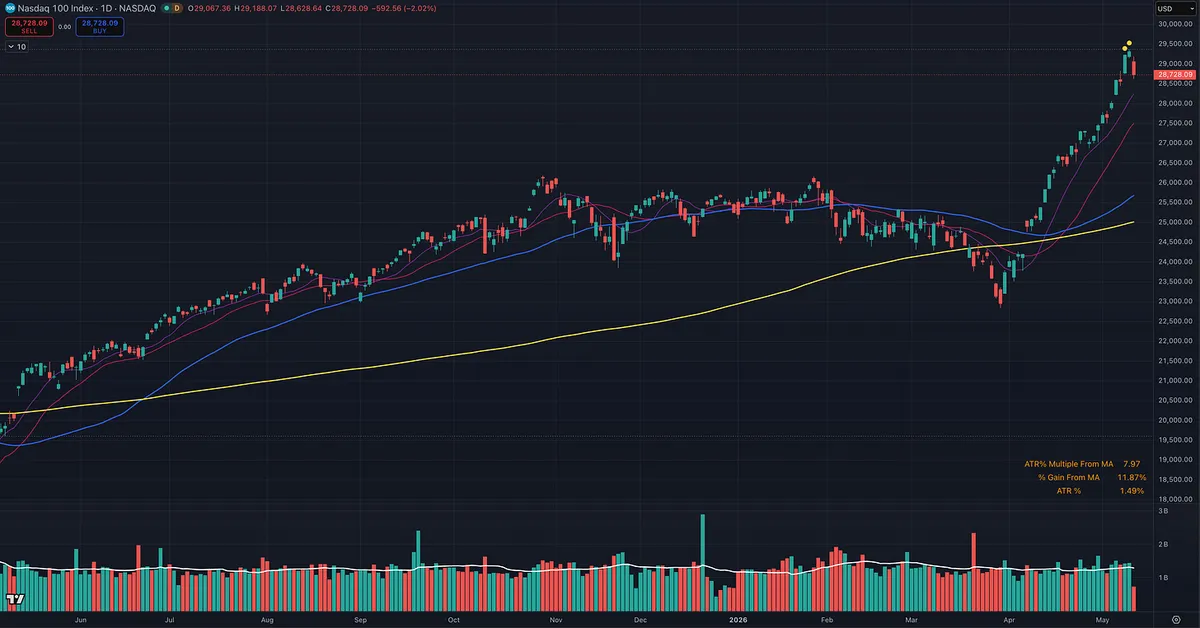
We still have to see how the market closes, but after the type of run we have had, a sharp pullback should not surprise anyone.

I wrote about this in the Big Picture Market Pulse over the weekend.

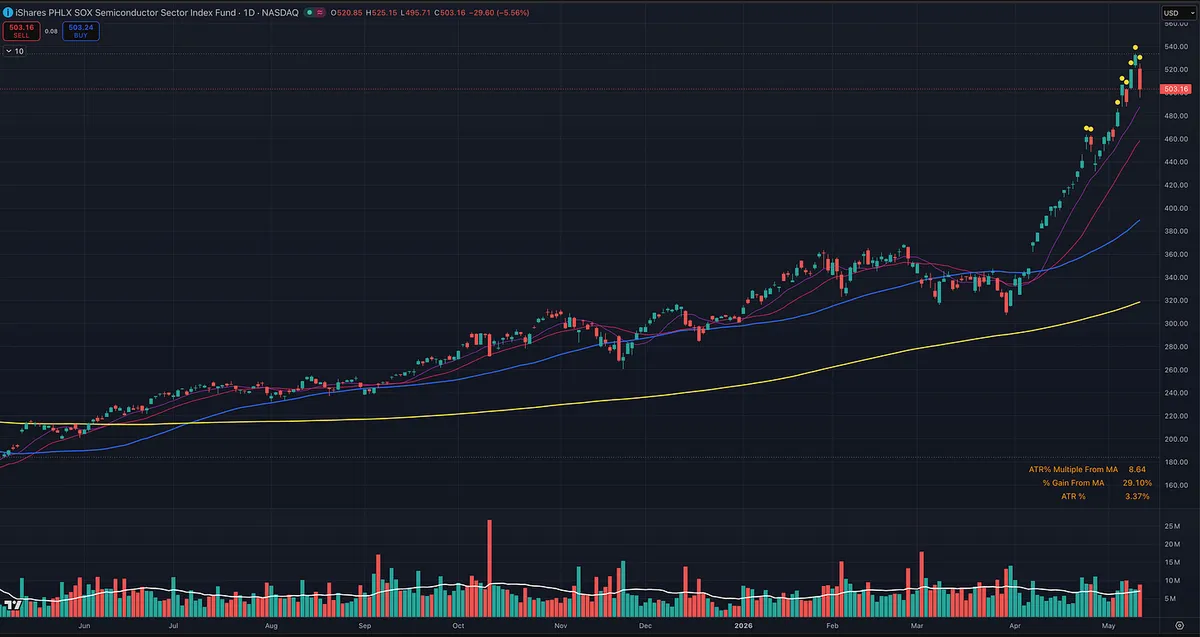
The biggest takeaway was that the Nasdaq 100 had flashed an ATR extension signal from the 50-day moving average, something that had not happened since January 3, 2000.

That does not mean the market has to crash.

It does not mean the bull move is over.

It simply means the market had become extremely extended after a powerful six-week run, and when markets get that stretched, volatility should be expected.

The Nasdaq 100 was not the only area flashing extension.

Technology, through XLK, also became extended. Semiconductors, through SOXX, have been flashing extension signals since April 24th, and that group has been one of the hottest areas driving the move.

This is why we study the big picture and market history.

William O’Neil talked constantly about the importance of understanding the general market. The “M” in CAN SLIM stands for market direction for a reason.

Strong markets create opportunity, but extended markets create risk.

That does not mean you panic.

It means you pay attention.

You watch how the indexes close.

You watch volume.

You watch whether leading stocks hold up or start breaking support.

You watch whether this is normal digestion after a powerful move or the beginning of heavier distribution.

Momentum trading is not about being surprised by every red candle.

It is about understanding the environment, knowing when the wind is at your back, and recognizing when the market is stretched enough that a pullback becomes normal, not shocking.

That is exactly why I do the Big Picture Market Pulse every weekend.