Momentum Trading Strategy

Notes

Lessons from Legendary Traders

Notes built around one named market figure's own words or story, such as O'Neil, Livermore, Minervini, Seykota, Druckenmiller, Tudor Jones or other Market Wizards.

Showing 1–20 of 263 notes

View on Substack ↗

You Don't Have Enough Lifetimes to Learn Every Market Lesson the Hard Way.

It would take me multiple lifetimes to learn everything about the markets through trial and error alone.

That's why I've spent years studying the greatest momentum and growth stock traders in history.

Do I still learn through my own experiences, failures, and mistakes? Absolutely.

But why spend years learning a painful lesson when someone before me has already learned it and written an entire book about it?

Think about this.

Take 1,000 traders and throw them into the markets to figure everything out themselves. Take another 1,000 who first study the principles, successes, and failures of history's greatest traders.

Which group would you bet on?

As a father, it reminds me of raising my sons. You can teach them something a hundred times, explain why it matters, and show them exactly what to do. Yet sometimes, they insist on learning the hard way.

Years later, they finally understand what you were trying to teach them all along.

Adults aren't much different.

What amazes me is how many traders refuse to learn from previous generations because they believe the markets are somehow completely different today.

Markets evolve. Technology changes. But many of the underlying principles of speculation, risk management, and human behavior have stood the test of time.

Being willing to learn from others isn't a weakness. It's a strength.

You're going to make plenty of mistakes of your own. That's inevitable.

But by learning from those who came before you, you can avoid repeating many of those mistakes, and perhaps prevent some altogether.

Why insist on learning every lesson the hard way?
View on Substack ↗

Two Traders. Same Market. Same Opportunities. Completely Different Results.

Over 100 years ago, Richard Wyckoff shared a fascinating story in Studies in Tape Reading.

Two traders started out watching the same ticker, trading the same small positions. One eventually built a fortune. The other never progressed beyond trading ten-share lots.

What separated them?

Wyckoff believed the difference came down largely to their mental qualities, discipline, and ability to interpret what the market was telling them.

He emphasized several principles:

  • Study price and volume to understand supply and demand.

  • Recognize accumulation, distribution, and changes in leadership.

  • Control fear, greed, anxiety, and recklessness.

  • Protect capital and manage risk.

  • Study your mistakes relentlessly.

  • Develop what he called a "trading character."

Here's what I find fascinating.

More than a century later, we have advanced charting software, sophisticated screeners, thousands of indicators, and now AI.

Yet traders still struggle with the same problems Wyckoff wrote about.

They chase tips, fight trends, abandon strategies, refuse to cut losses, and allow emotions to dictate decisions.

The technology has changed. The market has evolved. But human nature hasn't changed.

Perhaps the greatest edge in trading isn't discovering something nobody else knows.

It's developing the discipline to consistently execute principles that successful traders have understood for over 100 years.

That's exactly why I built the MTS Course around principles that have stood the test of time.

If you're tired of chasing gimmicks, following hype marketers, and searching for the next "hot new strategy," maybe it's time to stop searching for something new and start mastering what has worked for generations.

That's what the MTS Course is designed to help you do.

https://tradingmomentum.substack.com/p/momentum-trading-strategy-the-100

On SubstackMomentum Trading Strategy: The 100-Year Playbook Behind the Biggest Winning Stocks
View on Substack ↗

William O'Neil Recommended 4–5 Stocks. But That Doesn't Mean You Start With 4–5 Full Positions.

In my last note, I shared William O'Neil's recommendation of owning roughly 4–5 stocks for an account equivalent to $100,000 today.

But there's an important distinction between building a concentrated portfolio and already having one.

Imagine the market is emerging from a correction. Several industry groups are showing strength, and leading stocks are beginning to break out.

You don't necessarily jump straight into five stocks at 20% each.

Instead, you might begin with smaller positions, perhaps 5–10% of your account, sometimes less, and let your trading results determine when to increase exposure.

Here's a hypothetical example using a $100,000 account:

  • You begin with two or three smaller positions, perhaps 5–10% each, keeping most of your capital in cash while testing the market.

  • As those trades begin working, you add to successful positions at proper entry points or establish new positions in other qualifying stocks.

  • You might eventually hold five positions at 10% each, representing 50% portfolio exposure.

  • Some stocks fail, stall, or simply aren't performing as expected. You cut losses and eliminate weaker holdings according to your rules.

  • Your strongest positions may gradually grow from 5–10% to 15%, and potentially 20–25%, through price appreciation and additional purchases at proper entry points.

  • If the market remains healthy and your trading continues working, you might eventually reach 100% exposure concentrated in 4–5 leading stocks.

But that progression isn't always linear.

During the process, you might temporarily hold 8–10 smaller positions, or more depending on your strategy and market conditions. That doesn't mean all of them will become full-sized positions.

This is closely related to what Mark Minervini calls progressive exposure.

Minervini explains how he starts with smaller positions and increases exposure as his trading becomes profitable. He may accomplish that by increasing position sizes, initiating additional trades, or both.

David Ryan describes a similar approach in Momentum Masters, starting with 5% positions when conditions are uncertain and allowing successful positions to grow toward 20–25%.

Dan Zanger also adjusts his number of holdings and position sizes based on market conditions and how many strong opportunities are available.

And O'Neil himself discussed adding to winning positions while eliminating weaker holdings, although he preferred keeping the overall number of stocks more tightly limited.

Here's the important takeaway:

You don't need to identify your biggest winners in advance or force your portfolio to reach a predetermined number of holdings.

You identify promising opportunities, manage your risk, increase exposure as your trades prove themselves, and direct more capital toward your strongest positions.

And remember, 100% exposure is not the objective in every market. You work toward greater exposure only when conditions and your trading results justify it.

As Minervini wrote:

"Build on success. Subtract on setbacks. Let your portfolio guide you."

The objective isn't to force concentration. It's to let your best opportunities earn it.

Quoting Momentum Trading StrategyHow Many Stocks Should You Own? William O'Neil's Rules, Adjusted for Inflation. In How to Make Money in Stocks (4th edition, 2009), William O'Neil explained why he believed individual investors should concentrate their portfolios rather than over diversify. He even provided specific recommendations based on account…
View on Substack ↗

How Many Stocks Should You Own? William O'Neil's Rules, Adjusted for Inflation.

In How to Make Money in Stocks (4th edition, 2009), William O'Neil explained why he believed individual investors should concentrate their portfolios rather than over diversify.

He even provided specific recommendations based on account size.

But that was 17 years ago. What would those dollar amounts look like today?

O'Neil's Original Recommendations vs. 2026 Dollars

$3,000 in 2009 → $4,700 today

Recommended: 2 stocks

$5,000–$20,000 in 2009 → $7,800–$31,200 today

Recommended: 3 stocks maximum

$20,000–$200,000 in 2009 → $31,200–$312,300 today Recommended: 4–5 stocks

Over $1 million in 2009 → Over $1.56 million today

Recommended: 6–7 stocks

Dollar amounts adjusted using the U.S. Consumer Price Index through August 2026, approximately 56% cumulative inflation since 2009.

Think about that.

According to O'Neil's inflation-adjusted guidelines, someone managing a $100,000 account today would generally hold just 4–5 carefully selected stocks.

His philosophy was simple: Concentrate your capital in your best opportunities, know your holdings exceptionally well, and avoid spreading yourself too thin.

But concentration didn't mean blindly buying a handful of stocks and hoping for the best.

O'Neil emphasized buying correctly, cutting losses, adding to winners as they proved themselves, and reducing exposure when market conditions deteriorated.

The objective wasn't to own fewer stocks simply for the sake of owning fewer stocks. It was to put meaningful capital behind your best ideas while maintaining strict risk controls.

“The best results are usually achieved through concentration, by putting your eggs in a few baskets that you know well and watching them very carefully.” - William O’Neil

How many stocks do you typically hold when you're fully invested?

View on Substack ↗

Your Favorite Growth Stock May Have Already Grown Up

You watched it make other people rich.

Now you finally feel comfortable buying it.

But are you buying its next growth phase, or the reputation it earned during its last one?

That’s a trap William O’Neil discusses in How to Make Money in Stocks.

He describes a company with a strong three-year earnings growth record of 30%, whose recent quarterly growth has slowed to 10% or 15%. Its impressive history can disguise the fact that it’s behaving like a mature growth company.

The business may still be profitable. Earnings may still be great. But great earnings and accelerating earnings growth are different things.

A growth stock can deliver for years. The mistake is treating that label as permanent.

O’Neil also writes:

“Many growth leaders in one cycle do not repeat in the next cycle.”

Yet traders can act like generals preparing to fight the last war. We keep returning to familiar names because we remember what they did.

Meanwhile, the next generation of leaders may still feel unfamiliar, uncomfortable, or “too expensive.”

That doesn’t mean an older company can’t reaccelerate or lead again. It means it has to earn its place through current evidence.

Ask yourself:

  • Is earnings and sales growth strengthening or fading?

  • Is the stock showing leadership in its price and relative strength?

  • Am I buying because of what’s happening now, or because I remember what happened before?

Is your watchlist built around today’s leaders, or yesterday’s memories?

View on Substack ↗

Not Every Soaring Stock Is a Growth Stock

A stock breaks out. Sales surge. Earnings jump triple digits. It starts appearing on your growth screens.

But what’s actually driving those numbers?

In Chapter 4 of How to Make Money in Stocks, William O’Neil explains that three out of four big market winners historically were growth stocks. One in four was a cyclical or turnaround situation.

He specifically describes how China’s industrial expansion drove demand for steel, copper, chemicals, and oil after 2003, bringing cyclical stocks back into leadership. Their earnings exploded, but their businesses remained cyclical.

I believe parts of today’s market illustrate that same distinction.

Consider the forces behind several areas attracting attention:

  • Oil producers and refiners: The Iran conflict has disrupted energy supplies and transportation. Producers can benefit from higher realized oil prices, while refiners benefit when the spread between crude costs and refined fuel prices widens. Those are different earnings drivers. We have been seeing several U.S. refiners reaching all-time highs alongside triple-digit profit growth.

  • Marine shipping, particularly tankers: Disrupted routes and tight vessel availability can push freight rates sharply higher. That can produce an earnings boom without a company adding many ships, although operating costs and risks also rise.

  • Copper and energy infrastructure: Electrification, AI, and data centers create longer-term demand for copper and electricity. Natural gas is an important part of the U.S. power supply supporting that demand. These structural trends can strengthen the outlook while commodity-sensitive businesses remain cyclical.

A company can report tremendous sales and earnings growth because the price of what it sells has increased, industry capacity is constrained, or margins have expanded. That is different from growth driven primarily by new products, new customers, and sustained market-share gains.

Both can produce exceptional stock moves. And a business can have both cyclical and long-term growth drivers.

The mistake is assuming a few explosive quarters establish a durable growth business. Strong earnings and relative strength may satisfy parts of CAN SLIM, but understanding the earnings history and what is driving the acceleration still matters.

Both can be big winners. Understanding what’s driving the earnings helps you avoid mistaking a cyclical boom for growth that can last for years.

View on Substack ↗

Most Traders Don’t Need Another Indicator. They Need to Read These Books.

If you can't read price and volume, identify leadership, recognize a proper setup, screen for the stocks and industry groups actually in play, and define your risk before entering, more indicators probably aren't going to fix your trading.

One thing that has surprised me on Substack is how many traders are missing these foundational skills and are trying to trade live money.

Some can't identify a proper cup with handle or VCP. Others know the pattern names but don't understand what they're actually looking for underneath them: supply and demand.

A constructive setup often shows the same basic characteristics: strong price action when demand is present, weaker volume as the stock pulls back or moves sideways, tightening price action as supply dries up, and renewed demand as the stock moves through its pivot.

If these are gaps for you, you don't need to reinvent anything.

Start with:

William O'Neil:How to Make Money in Stocks

Mark Minervini:Trade Like a Stock Market Wizard and Think & Trade Like a Champion

Anna Coulling:A Complete Guide to Volume Price Analysis

Stan Weinstein:Secrets for Profiting in Bull and Bear Markets

Then use Edwards & Magee, John Murphy, Schabacker, Jiler, and Momentum Masters to go deeper.

But reading isn't enough. You have to run screens, study hundreds and eventually thousands of charts, review your trades, study your mistakes, and repeat the process until you can recognize these characteristics almost instinctively.

The books give you the blueprint. Screen time builds the skill.

View on Substack ↗

You do not have to invent a trading strategy from scratch to become a successful trader.

Look at how many of the traders we admire learned from those who came before them.

Mark Minervini and David Ryan both learned from William O’Neil’s work. Ryan worked directly for O’Neil, while Minervini has openly discussed the lessons he learned from him.

Stanley Druckenmiller learned from his early mentor, Speros “Doc” Drelles, and later from George Soros.

Jerry Parker trained in the Turtle program led by Richard Dennis and William Eckhardt, then built his career on that foundation.

And O’Neil’s own education reached back further. He studied Jack Dreyfus’s stock purchases and learned from the writings of Gerald Loeb, Jesse Livermore, and Bernard Baruch.

These traders contributed their own research, insights, and refinements. They also benefited from knowledge that already existed. Some learned directly from mentors. Others learned through books, seminars, and studying successful investors.

The knowledge kept building from one generation to the next.

I’m incredibly grateful for that. These people spent years studying markets, making mistakes, refining their approaches, and sharing what they learned. Their work gave me a foundation that would have taken far longer to develop on my own.

Most of my struggles as a trader were not about inventing a system with an edge. They were about getting out of my own way and consistently following the approach I had learned.

Accepting losses. Staying patient. Taking the right setups. Managing risk. Becoming skilled enough to execute the same process under pressure.

A medical student learns from an existing body of knowledge. An athlete learns established techniques from coaches. Both still have to put in years of practice to become proficient.

Having access to the knowledge gives you a starting point. Mastery takes work.

The way I see it, adopting an established trading approach is a little like buying into a franchise. You start with an operating model someone else has spent years developing. You still have to understand it, manage it properly, and demonstrate that you can make it work.

Inventing an entirely new strategy adds another job: developing and validating the method itself.

If that is what you want to pursue, I respect it. Just recognize that you have chosen an additional challenge. You’re trying to establish an edge while also learning how to execute it.

I chose to build on foundations that successful traders had already documented.

Over time, you refine your approach to fit your temperament, timeframe, and experience. You track your results and check whether those refinements preserve or improve the edge.

Jerry Parker is a good example. He retained the foundations he learned as a Turtle while refining how he applied them over the years.

You can develop your own style without starting from zero.

Learn the foundations. Put in the practice. Understand why the rules exist. Then make the approach your own.

View on Substack ↗

Your Trading Strategy May Be Older Than You Think

In 1910, Richard Wyckoff published Studies in Tape Reading under the name Rollo Tape. More than a century ago, he was teaching lessons traders are still trying to master today.

  • Read price and volume to understand supply and demand.

  • Trust market behavior over tips and opinions.

  • Keep losses small and avoid trading too frequently.

  • Reduce position size and trade frequency when losses build.

  • Study your mistakes and track your results. Memory alone gives you an incomplete picture of your performance.

Decades later, William O’Neil built upon the work of Wyckoff, Jesse Livermore, and other predecessors. As Trade Like an O’Neil Disciple explains, their ideas helped shape his investment philosophy. O’Neil combined that foundation with extensive research into historical stock-market winners to develop CAN SLIM, bringing together price and volume, earnings growth, leadership, institutional sponsorship, and market direction.

That work helped shape another generation, including David Ryan, Mark Minervini, Dan Zanger, and many U.S. Investing Championship winners. They studied those principles, applied them, and developed their own approaches and refinements.

Great traders study the work of those who came before them.

They learn the principles, test them, and build an approach they can execute. Reading the classics gives us the same opportunity.

View on Substack ↗

William O’Neil Said This Decades Ago.

One of my favorite distinctions from William O’Neil in Market Wizards:

“So you treat a fund very differently from an individual stock account?” “Very, very differently. With an individual stock, you absolutely have to have a stop-loss point, because you never know how far down the stock is going.” - William O’Neil, Market Wizards

This is an important difference.

An individual stock and a diversified fund should not always be managed the same way.

An individual company can permanently deteriorate.

Earnings can collapse. Management can fail. A competitive advantage can disappear. In extreme cases, the stock can eventually become nearly worthless.

That is why O’Neil was so aggressive about cutting losses in individual stocks.

But a broadly diversified fund is different.

O’Neil went on to say:

“When you buy a fund, you want to be in it for 15 years or more. That is how you will make the really big money. But in order to do that, you need the courage to sit through three, four, or five bear markets. The typical diversified growth stock fund will go up 75 to 100 percent in a bull market, but it will decline by only 20 to 30 percent in a bear market.”

- William O’Neil, Market Wizards

That gets to the heart of his argument.

A diversified fund owns many companies across the economy. Individual companies can fail while the fund survives, changes its holdings, and participates when the broader market eventually recovers.

And I think this principle translates directly to many ETFs today.

A broad-market ETF tracking something like the Nasdaq-100 (QQQ), S&P 500 (SPY) or total U.S. stock market (VTI) is much closer to the diversified mutual funds O’Neil was describing than it is to owning one individual company.

But….

Not every ETF should be treated this way.

Leveraged ETFs, inverse ETFs, single-stock ETFs, highly concentrated sector ETFs, and narrow thematic ETFs can carry very different risks.

And if you are trading an ETF tactically rather than holding it as a long-term diversified investment, a predefined stop should be used.

Don’t treat a broken individual stock like a diversified index fund.

And don’t treat a normal bear-market drawdown in a broadly diversified long-term fund like one company whose thesis has completely failed.

Ironically, O’Neil pointed out that many investors do the exact opposite.

They hold individual-stock losers hoping they come back, then panic and sell diversified funds during bear markets.

Individual stocks require protection from permanent loss.

Broad diversified funds require the patience to survive normal market cycles.

Two different vehicles.

Two different jobs.

Two different timeframes.

Two different approaches to risk.

View on Substack ↗

Minervini Averaged 50% Cash. Still Feel Underinvested?

Stocks are ripping. The Nasdaq is making new highs. You look at the cash in your account and feel like you’re doing something wrong.

That feeling can get expensive.

Mark Minervini said he had averaged roughly 50% cash over his career.

People see his big returns and assume he must always be fully invested or leveraged, but he explained that he gets aggressive when conditions and results support it, while spending plenty of time in cash or smaller positions.

Big returns don’t require maximum exposure all the time.

The pressure to be fully invested can push you into extended stocks, mediocre setups, and positions you never would have taken without the fear of missing out.

Having cash available doesn’t mean you need to find something to buy today. Let the opportunities develop. Start with manageable exposure, increase it as your trades work, and pull back when they don’t.

That 50% figure was a historical average, not a target allocation. The point is to let your setups and results determine your exposure.

Cash is a position. Your job is to grow the account, not to keep every dollar busy.

View on Substack ↗

Think Today’s Market Is Different? Read This

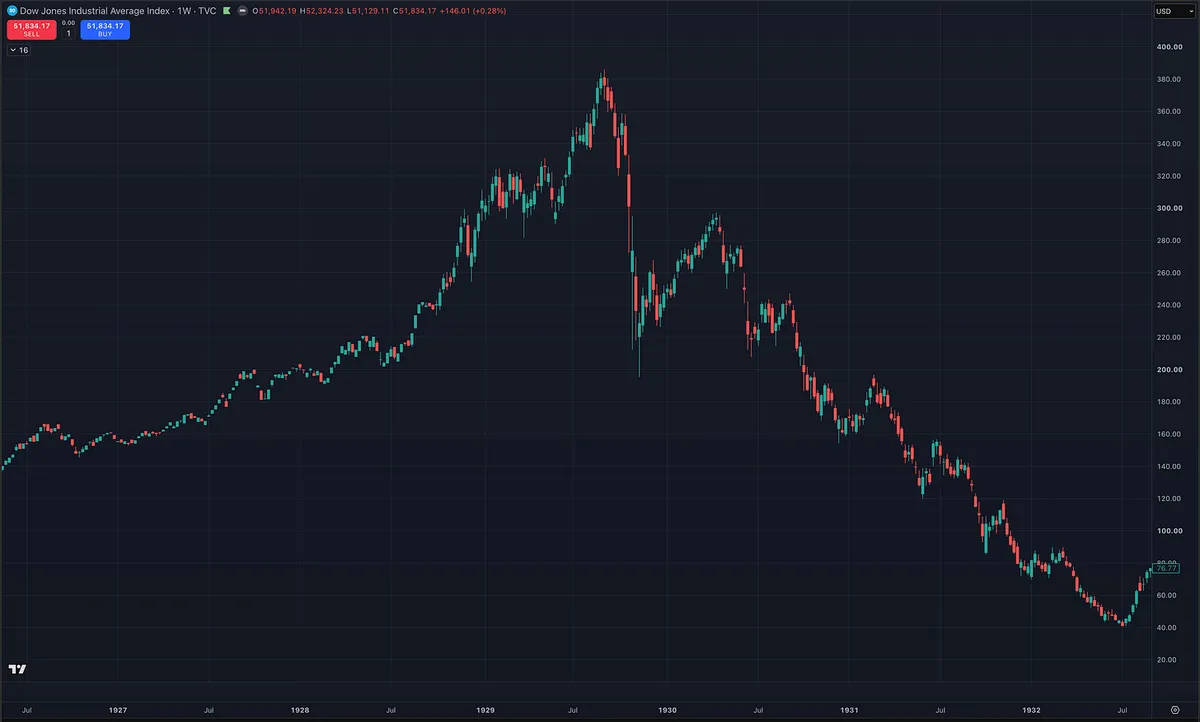
Before the 1929 crash, Gerald Loeb noticed something familiar: his leading stocks were starting to act badly.

He sold them and moved into other names. Then those started deteriorating too. Eventually, he looked for something strong to buy and couldn’t find anything.

The market was pushing him toward cash, one failed opportunity at a time.

Loeb later placed the market’s top on September 3, almost two months before the Great Crash. By his own account, he was mostly out when it arrived.

The lesson isn’t that you should be able to predict the next crash. It’s that you don’t need to predict a crash to recognize when your stocks have stopped behaving well.

That is the same lesson I emphasize today. Watch the leaders. Watch what happens after you buy. When leading stocks deteriorate, replacement ideas keep failing, and your screens stop producing quality setups, stop forcing trades.

You don’t have to find something to buy just because you have money available.

Yes, technology has changed. But faster execution doesn’t turn a broken leader into a healthy stock. More information doesn’t make a failed breakout successful. And a sophisticated platform won’t protect you from refusing to take a loss.

Loeb was learning these lessons nearly a century ago. He later wrote The Battle for Investment Survival, a title that tells you something about how those experiences shaped his thinking.

Recognize when the market is no longer rewarding what you’re doing, protect your capital, and be ready when conditions improve.

Before dismissing an old trading lesson, make sure you aren’t repeating the mistake that taught it.

View on Substack ↗

Larry Hite once said in Market Wizards:

“I don’t know of too many people who get rich by taking small profits.”

Everyone knows the famous saying: Cut your losers short and let your winners run. But look at how many traders actually behave. They give a losing position more room because they hope it will recover, then sell a winning position at the first small gain because they’re afraid of giving it back.

They give their weakest trades patience and their strongest trades a deadline.

Hite’s comment came in a discussion about seeing the bigger picture, controlling risk, and following the trend. Catching a meaningful move requires staying with a stock while it continues to act right, including through normal pullbacks and consolidations.

Taking partial profits can help manage risk and make holding the remainder easier, but if you consistently sell your entire position at the first small gain, you never give a potential big winner the chance to become one.

Stop giving your losers the patience your winners deserve.

View on Substack ↗

The Discovery That Turned “Buy Low” on Its Head

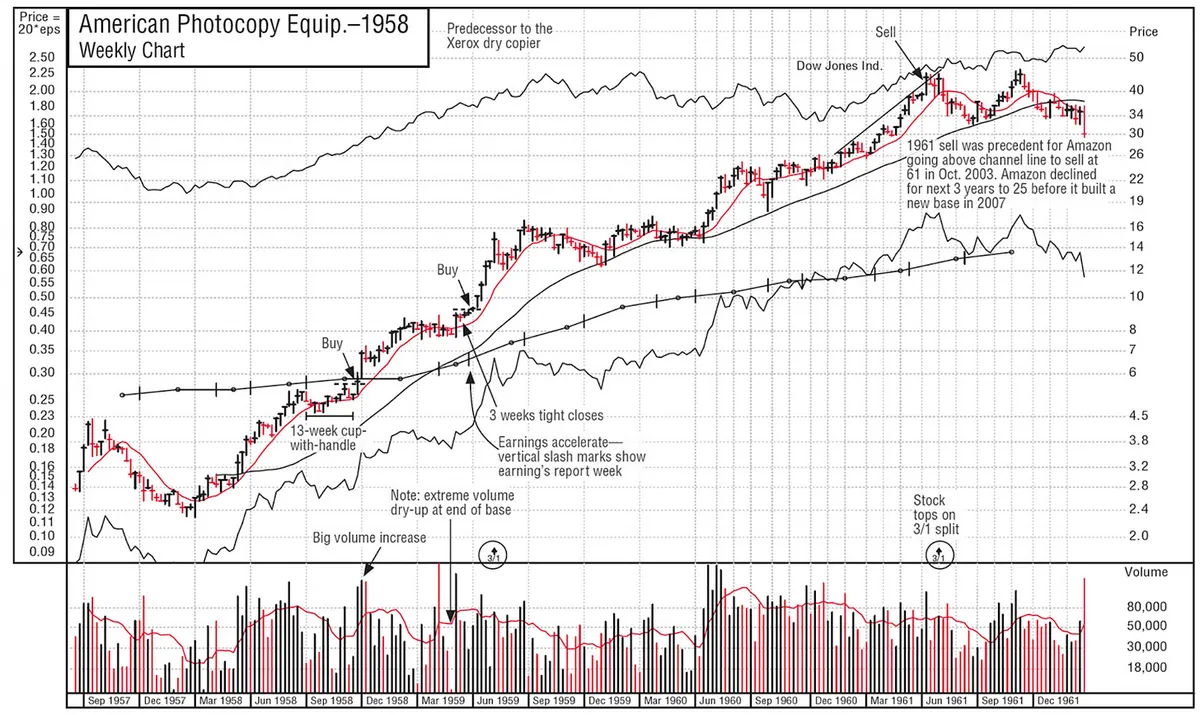
In January 1960, William O’Neil studied the best-performing mutual funds to understand what separated them from their competitors. The Dreyfus Fund stood out. He obtained its reports from 1957 through 1959, calculated the average purchase prices of its new holdings, and marked those prices on stock charts.

After examining more than 100 new purchases, he made what he called a “stunning discovery”: every stock in that sample had been bought at the highest price it had traded at during the preceding year.

Think about that. While many investors associated bargains with stocks that had fallen, one of the standout funds was buying stocks reaching new highs. Those purchases also followed recognizable chart patterns. O’Neil had found two essential clues: strength mattered, and the pattern preceding the breakout mattered.

For an individual stock, a new high shows that price has overcome the selling that previously contained it. When that happens as the stock emerges from a sound base on heavy volume, it provides evidence of demand consistent with institutional buying. Combine that with strong earnings, sales, and relative strength, and you begin to understand why new highs became central to O’Neil’s stock selection.

A true all-time high adds another advantage: the stock has cleared its historical overhead supply. Investors who bought at higher prices are no longer waiting above it to sell at breakeven. A 52-week high is significant too, although older resistance can still exist.

For the general market, new highs help reveal the strength of the environment in which those stocks are trading. O’Neil studied the major indexes’ price and volume action because market direction could support or undermine even an excellent stock selection. An index reaching new highs is good evidence, while volume, distribution, and the behavior of leading stocks help determine how much confidence that strength deserves.

He also examined which industries dominated the new-high list. Multiple strong stocks from the same group helped identify where leadership was developing.

This became part of a coherent strategy: a supportive market, leading companies, sound bases, and strong demand at the breakout. New highs off properly formed bases were explicitly part of the “N” in CAN SLIM.

O’Neil’s lesson was to study what successful stocks actually did and let that evidence challenge what felt comfortable.

A new high can be the beginning of a major move. Learn to recognize the conditions that make it worth buying.

View on Substack ↗

Seven Distribution Days. O’Neil Took This Seriously.

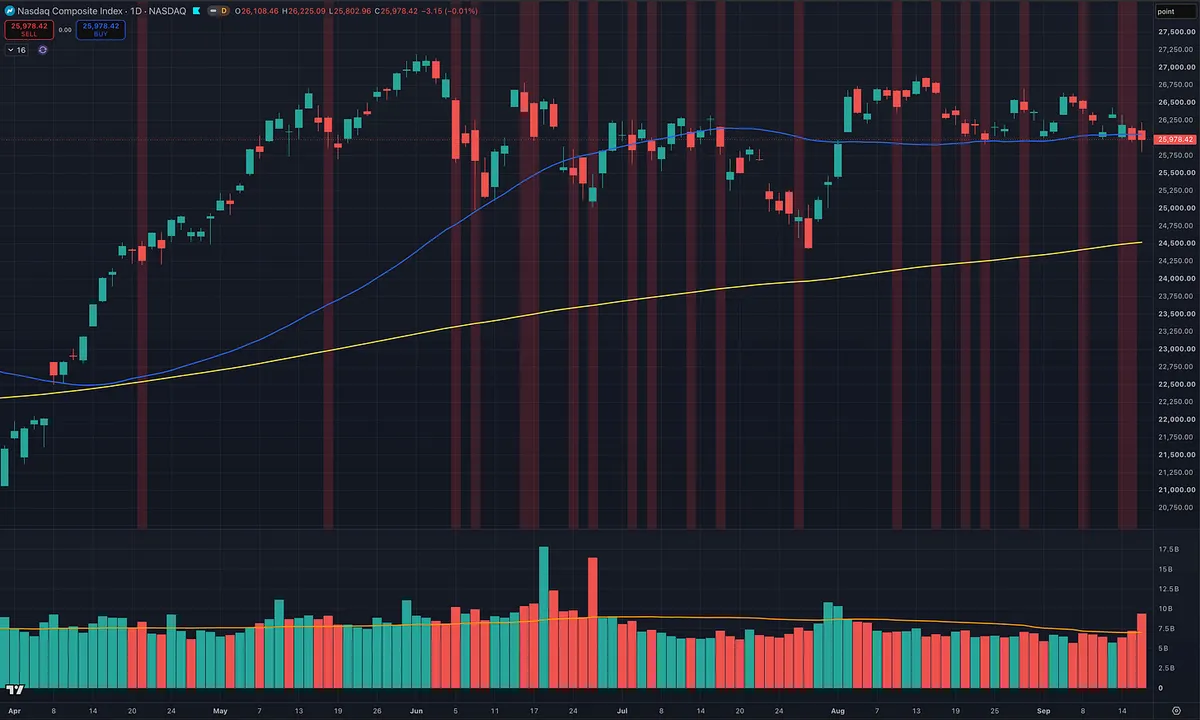
My current distribution-day count over the last 25 trading sessions:

  • Nasdaq Composite: 6

  • S&P 500: 7

  • Nasdaq 100: 4

William O’Neil treated repeated distribution as evidence that institutions were selling and the market’s uptrend was becoming vulnerable.

In How to Make Money in Stocks, his down-day rule was specific: an index declines more than 0.2% on higher volume than the previous session. He also recognized distribution through stalling, when heavier volume produces little upward progress.

The market can come under distribution while it is still advancing. That is what makes these warnings easy to overlook.

O’Neil wrote:

“After four or five days of definite distribution over any span of four or five weeks, the general market will almost always turn down.”

He took these signals seriously enough to act.

In his discussion of the 2007 market top, O’Neil explained that investors should have taken some selling action by the fifth distribution day and cut back further after the sixth. By the seventh, he described “seven crucial warnings.”

That historical example does not mean today must unfold like 2007. It shows how much weight he placed on repeated distribution.

Another detail matters:

“It takes only one of the indexes to give you a valid repeated signal of too much distribution.”

The Nasdaq 100’s lower count therefore does not cancel the warnings from the Nasdaq Composite and S&P 500.

Seven distribution days on both of those indexes deserves serious attention.

O’Neil also watched leading stocks closely. Are breakouts working? Are leaders holding support? Are declines attracting heavier volume while rebounds struggle? He considered the behavior of leading stocks the second most important indication of a major market change, after the indexes themselves.

The count belongs alongside that evidence. How closely the distribution days cluster, how the indexes respond, and how your stocks behave all matter.

As those warnings accumulate and price action deteriorates, O’Neil’s approach calls for selling, raising cash, and protecting capital.

You don’t have to know how far the market will fall to recognize when the evidence calls for less risk.

View on Substack ↗

The First Rate Hike Matters. Martin Zweig Explained Why.

Today, September 16, the Fed raised rates 0.25 percentage points to 3.75%–4.00%, its first increase since July 2023.

We went from cutting, to holding, to raising.

Even an expected hike changes the monetary backdrop.

This is where Martin Zweig’s Winning on Wall Street deserves another read. In his chapter “Don’t Fight the Fed,” he wrote:

“Generally, a rising trend in rates is bearish for stocks; a falling trend is bullish.”

He also emphasized that the trend in interest rates mattered more than the level itself.

When rates rise, savings accounts, CDs, and Treasury bills can offer higher yields with considerably less risk than stocks. Stocks may still deliver greater returns, but some investors may decide the potential extra gain no longer justifies the additional risk. Meanwhile, businesses face higher borrowing costs that can eat into their profits.

Zweig turned that observation into a specific rule.

In his Fed Indicator, a rate hike clears any remaining positive points in the affected component and adds one negative point. Each negative point expires after six months unless a reversal toward easing in that component removes it sooner. His revised rules explicitly included changes in the federal funds rate.

The positive points awarded for earlier cuts also expire according to his rules, even when rates remain unchanged.

In Zweig’s model, earlier easing does not provide permanent bullish credit. That credit fades with time, and a hike wipes out whatever remains in that component.

And with the 10-year Treasury yield around 5%, longer-term borrowing costs deserve attention alongside the Fed’s decision.

Zweig’s work earned respect from some exceptional traders. In Market Wizards, Michael Marcus, Bruce Kovner, Richard Dennis, Paul Tudor Jones, and David Ryan all praised or recommended his work. Marty Schwartz also described consulting with Zweig.

During Marcus’s interview, Jack Schwager observed that Zweig was probably the person most mentioned by the traders he interviewed.

One hike does not automatically mean a bear market starts today. Zweig also followed the tape, combining monetary conditions with market momentum in his broader model.

William O’Neil made an important distinction in How to Make Money in Stocks. He considered Fed rate changes valuable and discussed three successive significant hikes as a historical warning. But he explicitly cautioned:

“Fed rate changes, however, should not be your primary market indicator because the stock market itself is always your best barometer.”

That is how I’m applying these lessons: give the change in policy weight, evaluate it alongside breadth, leadership, and credit conditions, and let the indexes’ price and volume action and the behavior of leading stocks guide my trading decisions.

I remain open to a rally despite the hike. How stocks behave in the coming days will help us judge how well the market is absorbing tighter policy. A rally that gains participation and shows accumulation would tell us something different from a weak bounce that quickly fails.

We have to remain open to that evidence while recognizing that the monetary backdrop has changed.

Although today’s rate hike was widely expected, “priced in” does not mean “irrelevant.” Yesterday’s easing is no reason to ignore today’s tightening.

View on Substack ↗

He Gave You Belief in Yourself, Not Hype

One thing I always loved about William O’Neil was the integrity I saw in his teaching. I admired him as an investor, trader, businessman, and educator. But what stayed with me most was that he came across as a straight shooter, not someone willing to tell you anything to sell another IBD subscription.

Watching his old videos or reading his book, I never felt like I was being sold a fantasy. He made me believe I could learn this. He didn’t make me believe I was one secret hack away from becoming a millionaire.

In How to Make Money in Stocks, he wrote:

“You can definitely learn to invest wisely.”

But he paired that encouragement with responsibility. He emphasized serious study, learning from mistakes, and revisiting the material rather than expecting one reading to be enough. The opportunity was real, but so was the work.

The world needs more of that. Encouragement without deception. Confidence without guarantees.

That’s the message I want to pass along here.

You can learn this. Study the good books I share, work through the MTS course, and revisit the articles. But don’t confuse finishing the material with learning the skill. Don’t just read it, listen to it, or watch it once.

Absorb it. Study the charts. Practice with small risk. Review your decisions, especially the uncomfortable ones. Give yourself time to turn what you understand into what you consistently do.

You’re going to make mistakes. You’re going to have frustrating stretches. That doesn’t automatically mean you aren’t capable. It means you have something to examine, learn from, and improve.

O’Neil also wrote:

“No one can hold you back but yourself. Think positive.”

I take that as a call to take responsibility, not a promise that success is guaranteed. This is a marathon, not a sprint. Your willingness to study, practice, and keep improving matters.

You don’t need someone to convince you that trading is easy. You need to believe you can learn something difficult, then be willing to do the work.

View on Substack ↗

O’Neil Didn’t Invent CAN SLIM in a Vacuum

William O’Neil didn’t build his strategy by locking himself in a room and inventing everything from scratch.

He studied the people who were already winning.

In 1960, O’Neil analyzed more than 100 purchases made by the Dreyfus Fund, one of the top-performing funds at the time. He noticed something that went against conventional Wall Street thinking:

They weren’t buying cheap stocks. They were buying stocks breaking into new highs from sound chart patterns.

That became one of the foundational ideas behind O’Neil’s approach.

Then he studied Jesse Livermore, who influenced his thinking on pivot points, pyramiding, and adding to winners instead of averaging down. O’Neil explicitly said he adopted Livermore’s pyramiding method.

Gerald Loeb reinforced aggressive loss cutting.

Bernard Baruch reinforced the idea that you don’t need to be right most of the time if you keep losses small and make enough when you’re right.

O’Neil also studied the chartists who came before him, tested their ideas against actual historical winners, kept what worked, and rejected what didn’t.

And maybe his greatest teacher was his own mistakes. After watching profits disappear in 1961, he went back through every trade, marked his buys and sells on charts, and studied exactly what he had done wrong.

That is exactly what we are doing with Momentum Trading Strategy.

O’Neil built on the work of the great traders who came before him. We are building on O’Neil, Livermore, Loeb, Minervini, Ryan, Weinstein, Darvas, Zanger, and the other great momentum and trend traders who followed the same lineage.

We’re not trying to reinvent the market.

We’re studying 100+ years of what has actually worked, taking the best ideas from the traders who proved them with real results, testing them, and continuing to refine the playbook.

That’s how trading knowledge gets passed down: study the winners, keep what works, learn from your mistakes, and build on the shoulders of those who came before you.

View on Substack ↗

Marine Shipping Is Showing Exactly What O’Neil Taught

“The majority of the leading stocks are usually in leading industries.” — William O’Neil, How to Make Money in Stocks

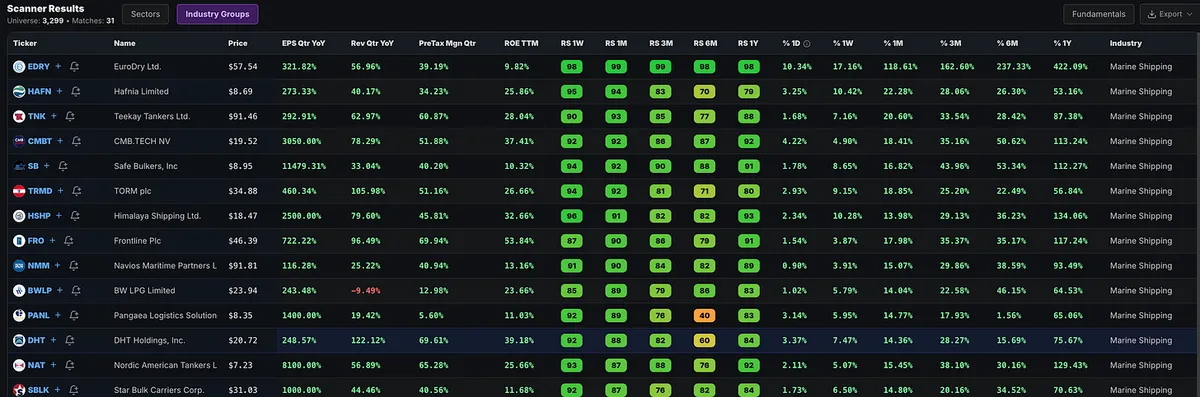
Look at the Marine Shipping strength in MTS Velocity. The group ranks #3 out of 140 industry groups, with a blended relative strength rating of 98.

EDRY, TNK, SB, TRMD, FRO, DHT. Multiple names are advancing together, with strong earnings growth and relative strength showing up across the group. This is exactly why I look beyond an individual stock’s chart and check what its peers are doing.

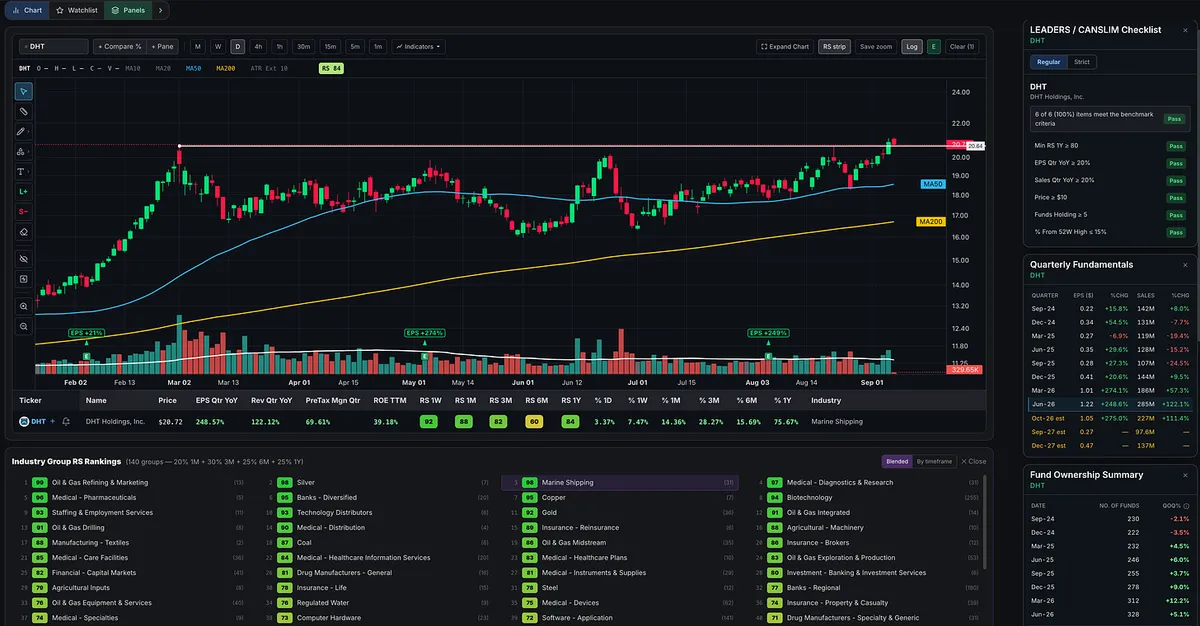
DHT is one example, working through resistance near $20.64 after a multimonth base. The attached screen shows quarterly earnings growth of approximately 249%, sales growth of 122%, and fund ownership climbing from 222 to 328 funds since December 2024.

Strong fundamentals. An improving chart. A leading industry group behind it.

That doesn’t make every shipping stock a buy. O’Neil emphasized selecting the leaders within strong groups, and we still need a proper entry and a defined exit if the trade fails.

Before you buy a stock, look at the company it keeps.

View on Substack ↗

95% of His Money Came From Stocks at New Highs

Dan Zanger was asked whether he ever bottom-fished.

His answer:

“All the biggest-moving stocks I’ve owned during the past 20 years, where I’ve made 95% of my money, were ones hitting new highs from very solid bases.”

A stock can be at an all-time high and still be near the beginning of a fresh advance. It may have spent months consolidating before finally breaking through resistance.

Yet traders see the new high and immediately think, “I missed it.”

Then they search for something that “hasn’t moved yet,” assuming a lower price means more opportunity.

If your first reaction to every new high is “too late,” you may be dismissing the exact opportunities that produced most of Zanger’s money.