Momentum Trading Strategy

Notes

Market Conditions

Reading the overall market and deciding how aggressive to be.

Showing 21–40 of 227 notes

View on Substack ↗

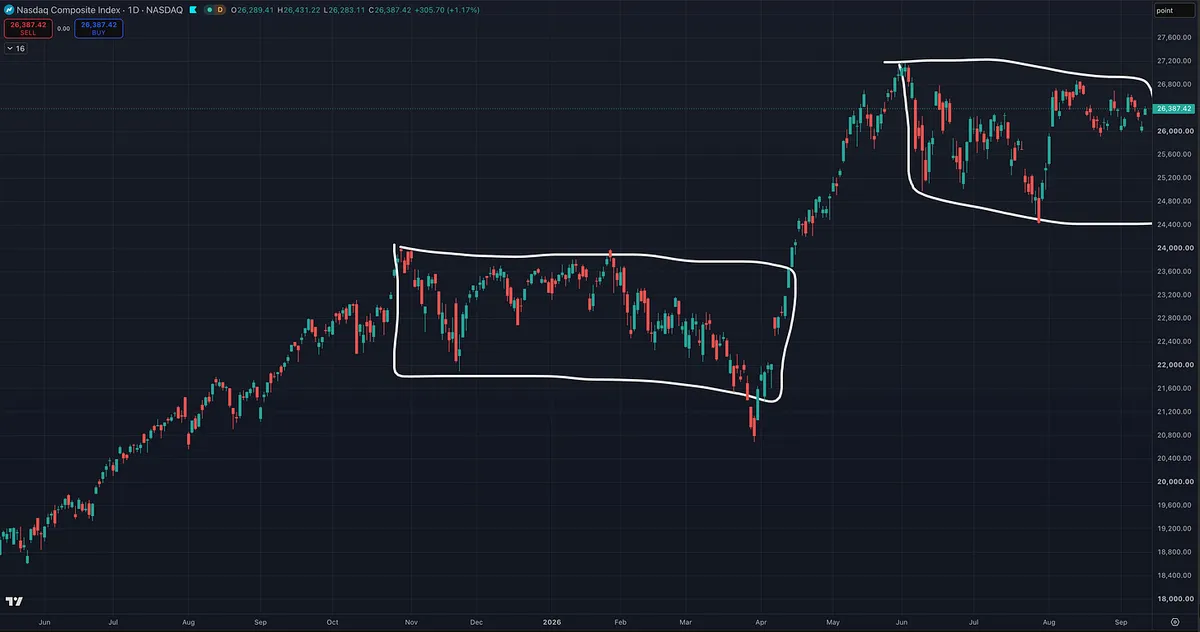
The Market Will Wear You Out Right Before It Moves

One of the most dangerous things about a sideways, choppy market isn’t just losing money.

It’s what the market does to you psychologically.

You buy a breakout. It fails. You take another shot. Nothing happens. A stock looks ready to go, then reverses. You get stopped out, try again, and get stopped out again.

Eventually, you get tired of playing.

William O’Neil understood this extremely well. His solution during difficult markets was not to force trades. He emphasized protecting capital, raising cash when conditions deteriorated, cutting losses quickly, and refusing to get sucked into weak rally attempts.

But there’s another side to that lesson that is just as important:

You cannot allow a bad market to condition you into being afraid of the next good one.

Because this is what markets do.

They chop. They frustrate. They produce failed breakouts and false starts. They make you question your system. Eventually, traders stop taking the setups they would normally take.

Then the environment changes.

O’Neil wrote about tracking every rally attempt and waiting for the market itself to confirm that something had changed. He wasn’t trying to predict the bottom. He wanted the evidence first.

That is the key.

Defensive does not mean disengaged.

You can be mostly in cash and still be studying the leaders.

You can be taking very little risk and still be building your watchlist, marking your buy points, studying relative strength, and watching for the stocks refusing to break down with the market.

Then, when the evidence begins to change, you start putting money to work and let your results tell you whether to increase exposure.

You can be frustrated with the environment and still be preparing for the next Stage 2 advance.

We’ve seen this repeatedly. Long stretches of sideways action can make it feel like the market is never going anywhere.

Until suddenly it does.

These periods feel like they will last forever while you are living through them.

They never do.

And one of the cruelest parts of the market is that the next major opportunity often begins after it has exhausted the people waiting for it.

Your job is not to predict when the chop ends, but to survive it, protect your capital, protect your confidence, and stay engaged enough to recognize when the evidence finally changes.

Some of the biggest opportunities come after everyone has been worn out.

Don’t let the market wear you down so badly that you’re asleep when it finally wakes up.
View on Substack ↗

Your Stop-Loss Won’t Save You From Overtrading

In Momentum Masters, Mark Minervini makes a blunt observation:

“A whipsaw market is more dangerous than a bear market.”

For a breakout trader, the trap is easy to recognize.

A stock breaks out. You buy. It reverses. You take a small loss.

Then you do it again. And again.

You’re respecting every stop, but your account keeps shrinking because you keep committing capital to setups that aren’t following through.

Minervini says excessive whipsaws call for examining your selection criteria and the market.

In the same discussion, David Ryan says he reduces exposure and position size. Dan Zanger says he usually steps aside entirely when the market turns choppy.

A stop controls your exit. You still control how much you risk, how often you trade, and whether the next setup deserves your money.

You don’t have to participate in every market.

The market can go nowhere while your account goes down.

View on Substack ↗

Before You Pick a Stock, Read the Market

Everyone wants to find the next big winning stock. But before you open your screener, step back and ask: What kind of market am I buying into?

Martin Zweig put it plainly in Winning on Wall Street:

“Big money is made in the stock market by being on the right side of the major moves. I don’t believe in swimming against the tide.”

Zweig studied monetary conditions, price and volume, and investor sentiment alongside individual stock fundamentals. The market environment helped determine how aggressive he should be. When conditions were favorable, he pressed. When the evidence was mixed, he held more cash.

That’s why my process starts with the big picture. Before screening for earnings, sales growth, relative strength, and chart setups, I want to understand the market trend, participation, and where leadership is developing.

Finding a great stock is only part of the job. Knowing when to press and when to back off matters just as much.

This week’s Big Picture Market Pulse is out, walking through that evidence before we dive into individual stocks.

Some of the greatest traders in history made understanding the market part of their routine. Why shouldn’t you?

View on Substack ↗

The U.S. Debt Crisis Has Been “Coming” for Over 40 Years

There’s a lot of chatter about the U.S. debt again.

And I’m not saying it isn’t a problem. It is. But one thing studying market history teaches you is that being right about a long-term problem and being right about when it becomes a market problem are two very different things.

Go back to the late 1980s.

In the 1987 Paul Tudor Jones documentary Trader, Jones correctly anticipated the stock market crash. But the documentary also discussed his much broader belief that America could be nearing the end of a 200-year bull market.

Then read the Jim Rogers interview in Market Wizards. Rogers was already talking about U.S. budget deficits, trade deficits, foreign debt, a weakening dollar and eventually a collapse in the bond market. When Schwager asked when, Rogers basically admitted he didn’t know. He said it could be three years or it could be ten.

That interview was more than 35 years ago.

The point isn’t that debt doesn’t matter. It absolutely does. The point is that nobody knows when a long-term structural problem becomes the catalyst that actually matters to markets.

It could become a major issue tomorrow. It could be 10, 20 or 30 years from now. It could be long after we’re gone.

So understand the debt. Understand the potential consequences. But also understand your time frame.

For most traders, letting a decades-long macro concern override what the market is actually doing today can be just as dangerous as ignoring the risk completely.

And this is something I think a lot of people struggle to separate.

A major economic crisis can be terrible for the country and devastating for millions of people. We saw that in 2008. We saw something far worse during the Great Depression. You can understand that, care about it and still recognize that your job as a trader is different.

Your job is not to predict the exact day the system finally breaks.

Your job is to follow your system, manage risk and respond to what the market is actually doing.

You could sit in cash for 10 years waiting for a debt crisis that never comes while the market goes through an enormous bull market. Or you could participate in that bull market and allow your rules to progressively reduce exposure when the market itself begins telling you conditions have changed.

That is why having a strategy and a risk-management process matters so much.

You have to learn to separate what you believe is right for the country, the economy or society from what the market is actually doing. Those are not always the same thing.

If a true debt crisis eventually arrives, it could be devastating economically, but as traders, our advantage is that we do not have to predict when it happens.

We have to recognize when the market changes and act accordingly.

None of this is new. Traders were having almost the exact same conversation before many people participating in markets today were even born.

View on Substack ↗

I Don’t Need to Call the Bottom. I Need to See the Character Change.

Bitcoin and crypto are getting my attention again.

Not because I’m trying to predict the bottom.

Because the price action is starting to behave differently.

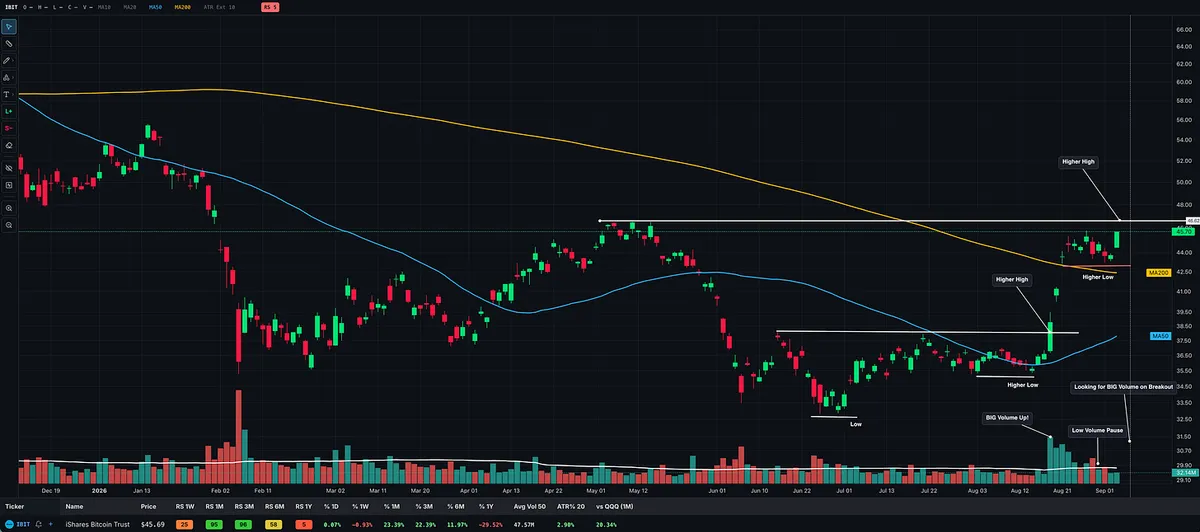
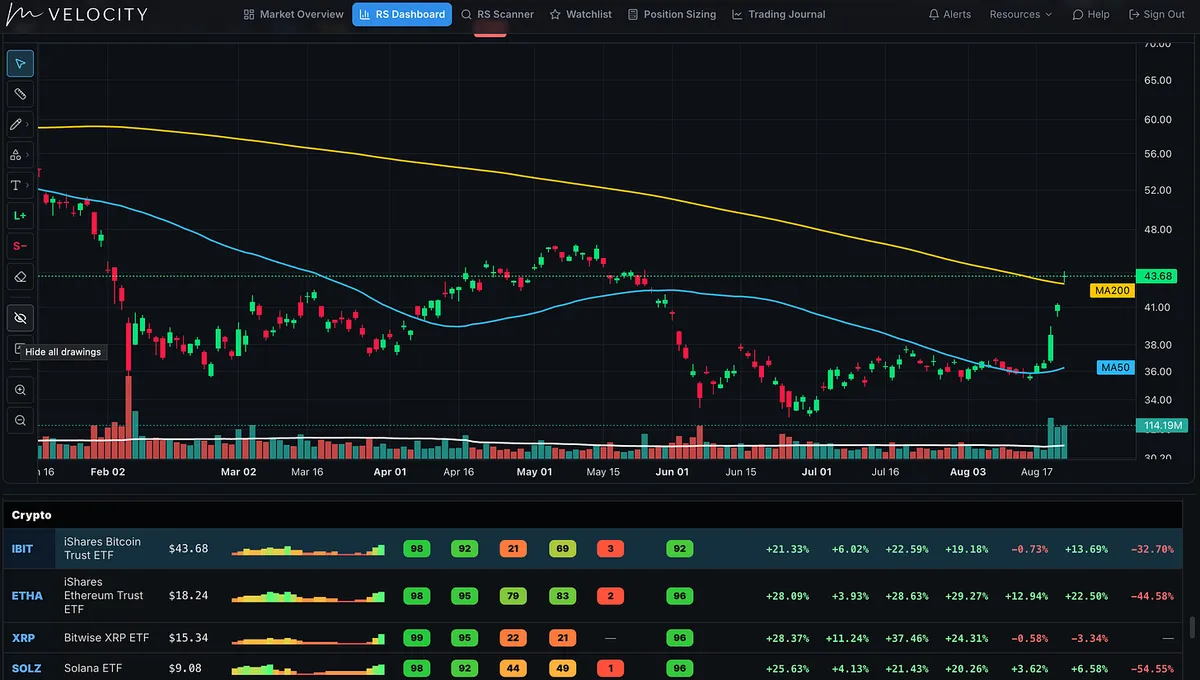
Look at IBIT on the attached chart. We had the low, then a higher low, a higher high on strong volume, another higher low, and now price is pushing back toward the prior May high. Short-term relative strength has improved significantly.

That is what I mean by a change of character.

You see this repeated across O’Neil, Minervini, Weinstein, Ryan, and Zanger.

Minervini describes a Stage 2 advance as a stock beginning to stair-step higher through higher highs and higher lows, with strong volume on advances and lighter volume on pullbacks.

Zanger describes an uptrend almost the same way in Momentum Masters: higher highs, higher lows, with tight consolidations between advances. Ryan also wants the moving averages and relative strength confirming the trend.

Weinstein puts heavy emphasis on relative strength improving before the breakout and warns that poor volume on a breakout is a danger signal.

But this is important:

Change of character is not full confirmation.

IBIT has reclaimed its 50-day and 200-day moving averages, but the longer-term trend still has work to do.

Minervini’s confirmed Stage 2 criteria require the 200-day to turn higher, with the shorter moving averages properly aligned above it.

Ryan describes an even stronger uptrend as the 20-day above the 50-day, the 50-day above the 200-day, with the averages rising.

We are not there yet.

There is also still plenty of overhead supply with IBIT well below its all-time highs.

So I’m not saying:

“Bitcoin is definitely starting a new bull market.”

I’m saying:

The evidence is improving.

Higher lows. Higher highs. Improving RS. Big volume on the initial upside move. Low-volume consolidation afterward. Price now pressing back toward resistance.

The next thing I want to see is simple:

A decisive breakout through the prior high on strong volume, followed by price holding that breakout and continuing to build the uptrend.

Then I want to see the moving averages continue to improve and eventually stack correctly as the trend matures.

I don’t need to guess what Bitcoin will do next.

I just need to recognize when the market starts telling me something has changed.

View on Substack ↗

When Your Favorite Setup Stops Working

One mistake traders make is assuming that when a setup stops working for a period of time, the entire method is broken.

Sometimes the method is fine, actually, most of the time it is.

The market environment changed.

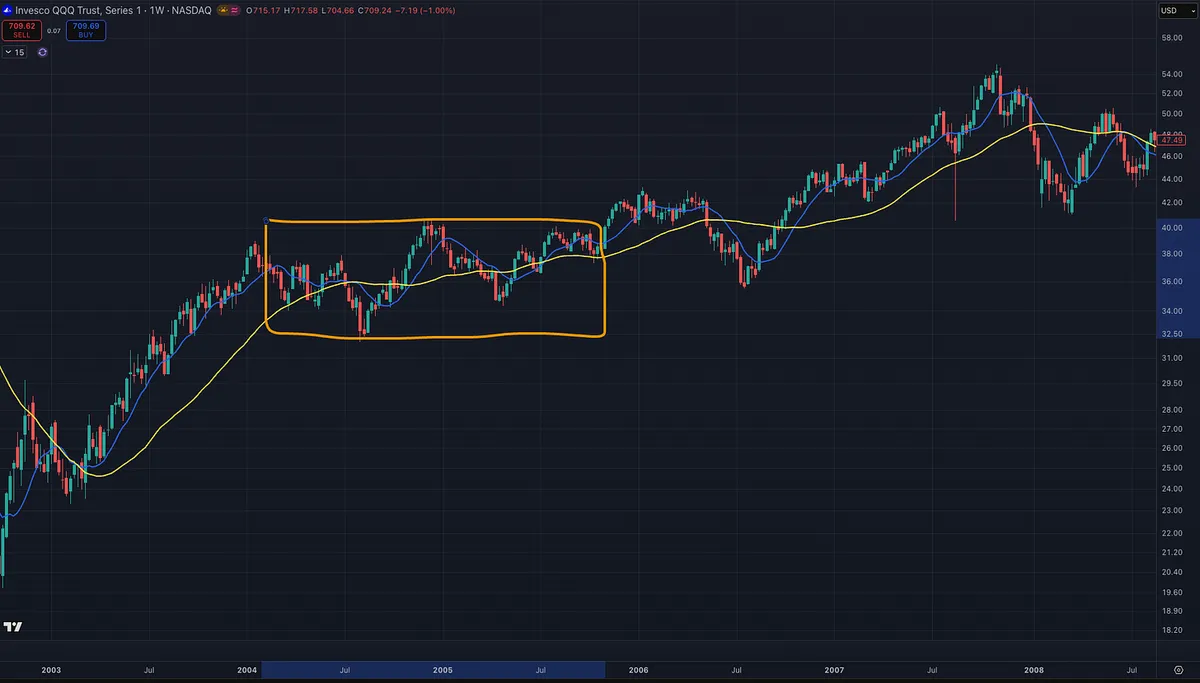
Morales and Kacher ran into exactly this in 2004 and 2005 in Trade Like an O’Neil Disciple. Traditional base breakouts were struggling in a choppy, sideways market. Instead of abandoning growth-stock trading, they adapted their entries to the environment.

Sound relevant right now?

Van Tharp taught a similar principle: there is no trading system that works in every market environment.

I’d take it one step further for most growth and momentum traders.

Sometimes the best adjustment in a sideways market is to stop trading.

If existing positions are holding up, I may keep them, take some profit, and trail stops. But I do not need to keep forcing new buys while breakouts are failing, leadership is rotating week to week, and the market is chopping sideways.

Morales and Kacher make this point elsewhere in the book too. There are periods when the best decision is simply to sit in cash, study, and wait for conditions to improve.

For me, that means waiting for the Stage 2 uptrend to reassert itself, the sideways action to resolve, and consistent leadership to return.

You do not have to change your entire method every time your favorite setup stops working. Sometimes you just have to wait for the environment your method was built for.

View on Substack ↗

Want to Understand the “M” in CAN SLIM Better? Learn How the Rest of the Market Thinks.

This is not something I originally set out to learn in order to become a better growth stock and momentum trader.

But the more experience I gained, the more I realized how valuable it was to understand how the rest of the market thinks.

I tend to buy stocks near 52-week highs and all-time highs. I want strong earnings and sales, powerful relative strength, institutional accumulation, and stocks moving up the right side of the chart. I am willing to buy high with the intention of selling higher.

But a huge amount of capital in the market does not think that way.

Many investors are extremely valuation-conscious. They care about P/E ratios, discounted cash flows, dividend yields, interest rates, and whether an asset appears cheap or expensive relative to alternatives.

That matters to us even if we never trade that way.

Take Treasury yields.

When investors can earn 5%, 6%, or potentially more in relatively safe government debt, the calculation changes. Stocks now have to compete against a much more attractive risk-free return. Investors may become less willing to pay premium valuations for stocks, particularly long-duration growth companies whose value depends heavily on earnings far into the future.

That can affect liquidity, valuations, institutional positioning, and ultimately the general market environment we are trying to trade.

The opposite can matter too. When Treasury yields suddenly collapse, it is not automatically bullish. Sometimes yields are falling because investors are rushing toward safety as economic conditions deteriorate.

This is where I think understanding the rest of the market has helped me better understand the “M” in CAN SLIM: Market Direction.

It reminds me of something we drilled constantly in the military. You cannot properly understand the battlefield by studying only how you intend to fight. A major part of planning is understanding how the other side is likely to behave.

Trading is obviously not warfare, but the principle translates surprisingly well.

I don’t need to become a value investor, bond trader, macro investor, or economist.

But understanding what drives their decisions, where capital is flowing, and why institutions may suddenly become more or less willing to take risk gives me a much better understanding of the environment in which my growth stocks are trying to operate.

And over time, that understanding has absolutely helped my trading.

View on Substack ↗

When the Market Gets Choppy, Trade Less.

Michael Marcus said it best in Market Wizards:

“I think the secret is cutting down the number of trades you make.”

He was talking about choppier markets and more false breakouts.

His answer was not to force trades. It was to wait for the ones where fundamentals, technicals, and market tone all line up.

Sometimes there are plenty of those opportunities.

Sometimes there are fewer.

When there are fewer, trade less.

View on Substack ↗

New Lows Just Overtook New Highs on Both Exchanges

One thing caught my attention today.

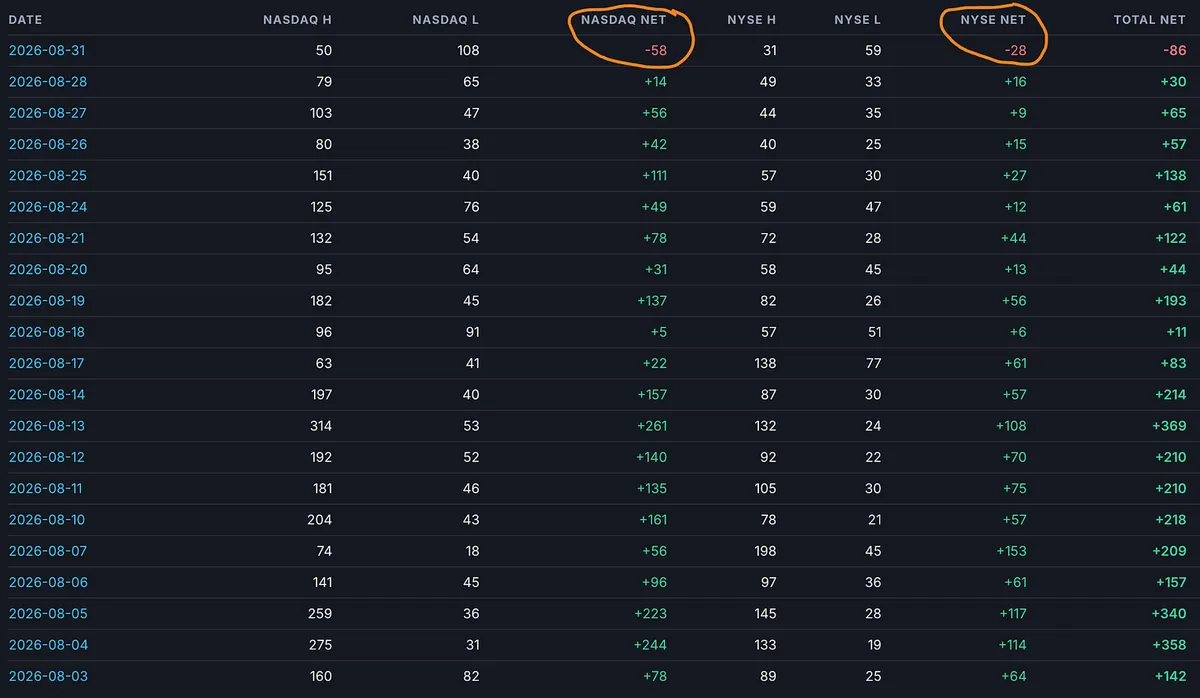
I track Nasdaq and NYSE net new 52-week highs versus lows across multiple data sources. Today was the first session in the past month where both exchanges finished net negative.

In other words, more stocks made new 52-week lows than new 52-week highs on both the Nasdaq and the NYSE.

Data from IBD (I combined AMEX with NYSE)

View on Substack ↗

The Market Has Been Going Up, but Look Who’s Leading.

One thing I’m watching closely right now is the quality of the leadership.

Look at the groups that keep showing up across our rankings and screens:

Healthcare: Biotechnology, Pharmaceuticals, Medical Diagnostics & Research, Medical Distribution, Medical Devices, Genomics, and other medical groups.

Energy: Oil & Gas Refining & Marketing, Drilling, Exploration & Production, Oil Services, and Midstream.

Metals & Mining: Silver, Gold, Copper, Coal, Steel, Uranium, and other precious metals.

Financials & Insurance: Banks, Capital Markets, Investment Banking, Financial Data & Exchanges, Asset Management, Insurance Brokers, and other insurance groups.

We are also still seeing strength in Software, Cybersecurity, and select AI-related names, along with individual opportunities in areas like marine shipping.

These are legitimate leaders right now, and I will absolutely trade them when the individual stocks meet my criteria. Some represent genuine growth leadership, while others are more cyclical, defensive, or secondary areas.

BUT throughout this bull market, many of those non-growth areas have tended to become more prominent when the dominant growth and technology leaders, which have been closely aligned with the AI-driven theme of this bull market, were cooling off, correcting, or moving sideways. During those periods, I generally would have been better served by reducing trade size, frequency, and overall exposure until the stronger growth leadership returned.

That’s the part I’m watching closely.

The market still looks healthy enough to trade, but this is not an easy-money environment.

When a bull market is firing on all cylinders, the strongest growth stocks are breaking out, RS is expanding, and the best setups tend to follow through quickly.

Right now, we are seeing more rotation, more cyclical and defensive leadership, and more laggards beginning to participate, and more failed breakouts. Many of these are the same areas that were overshadowed during the strongest periods of growth and technology leadership in this bull market.

So I would not call this a red-light environment, but I also would not call it a full green-light, easy-money market.

We’re also heading into a seasonally more difficult period for the market, which is another reason to stay alert. Seasonality alone will never determine my positioning. I’ll always let price action, leadership, and my individual trades tell me what to do. But combined with the rotation and changing quality of leadership we’re seeing, it’s something worth keeping in the back of our minds.

It feels more amber right now. Tradable, but cautionary.

View on Substack ↗

Sometimes the Stocks Tell You Before the Indexes Do

In my last note, I talked about why understanding the general market, sectors, and industry groups matters.

But that is only half of my process.

I also agree with Minervini that sometimes the best way to understand the health of the market is to look directly at the individual stocks.

He wrote that constantly updating your list of leading stocks can:

“sharpen your feel for the overall health and quality of the market.”

That is exactly what this short video shows.

When you have the right stock screens, you can often see leadership, rotation, and deterioration developing from the bottom up before it becomes obvious in the indexes or sector charts.

Minervini also points out that many of the best leaders can bottom and begin moving before their sectors, and by the time everyone realizes a group is hot, the strongest stocks may have already made significant moves.

That is why I don’t choose between top-down or bottom-up analysis.

I do both.

Market → Sectors → Industry Groups → Stocks

And then:

Stocks → Industry Groups → Sectors → Market

Sometimes the first clue that the market is changing is simply what starts showing up on your stock screens.

Click to watch the full video:

ArticleHow to Spot the Market’s Next Leading Industry Groups Before the Crowd
View on Substack ↗

The Trading Edge Most People Are Too Lazy to Build

William O’Neil found that roughly 3 out of every 4 stocks follow the direction of the general market.

He also found that approximately 37% of a stock’s price movement is tied to its industry group, with another 12% tied to its broader sector.

That means nearly 50% of a stock’s movement can be influenced by its industry group and sector, while more than 75% of stocks tend to move with the overall market.

This is exactly why I spend so much time every weekend studying the general market, sectors, and industry groups.

It gives me a much greater awareness of the environment I am trading in.

Over the last 20 years, I have seen the difference in my own trading when I consistently put in this work. I have also seen what happens during periods when I have slacked off.

The difference in my portfolio has been drastic.

Is this work exciting? No.

A lot of it is boring. A lot of it is monotonous. It means sitting down weekend after weekend, when the market is closed, reviewing charts, studying relative strength, identifying leadership, tracking deterioration, and trying to understand where money is flowing.

But sometimes the boring, repetitive work is exactly where the edge comes from.

And I know most traders are not doing it.

So many great traders across completely different disciplines have emphasized the importance of market awareness and preparation. Day traders, swing traders, position traders, and investors may approach the market differently, but they repeatedly come back to the same idea:

Know the environment you are operating in and do your homework.

So if you are not getting the results you want, ask yourself a simple question:

Are you actually putting in this work every weekend while the market is closed?

And if not, why not?

View on Substack ↗

The Reaction Matters More Than the News

One of the clearest signs of a market’s underlying health is how prices respond to news.

In a strong market, leading stocks and major indexes often absorb bad news and respond forcefully to positive surprises. Weak openings find buyers, early declines recover, and prices frequently finish near the highs of the day.

In a weak market, the opposite occurs. Even great news struggles to produce sustained gains, minor disappointments cause outsized damage, and promising morning rallies fade into weak closes.

One session proves very little, but when this behavior repeatedly appears across the indexes and leading stocks, it reveals whether demand or supply is in control.

The reaction tells you what kind of market you are in.

View on Substack ↗

Downside Pressure Just Hit Its Worst Level of August

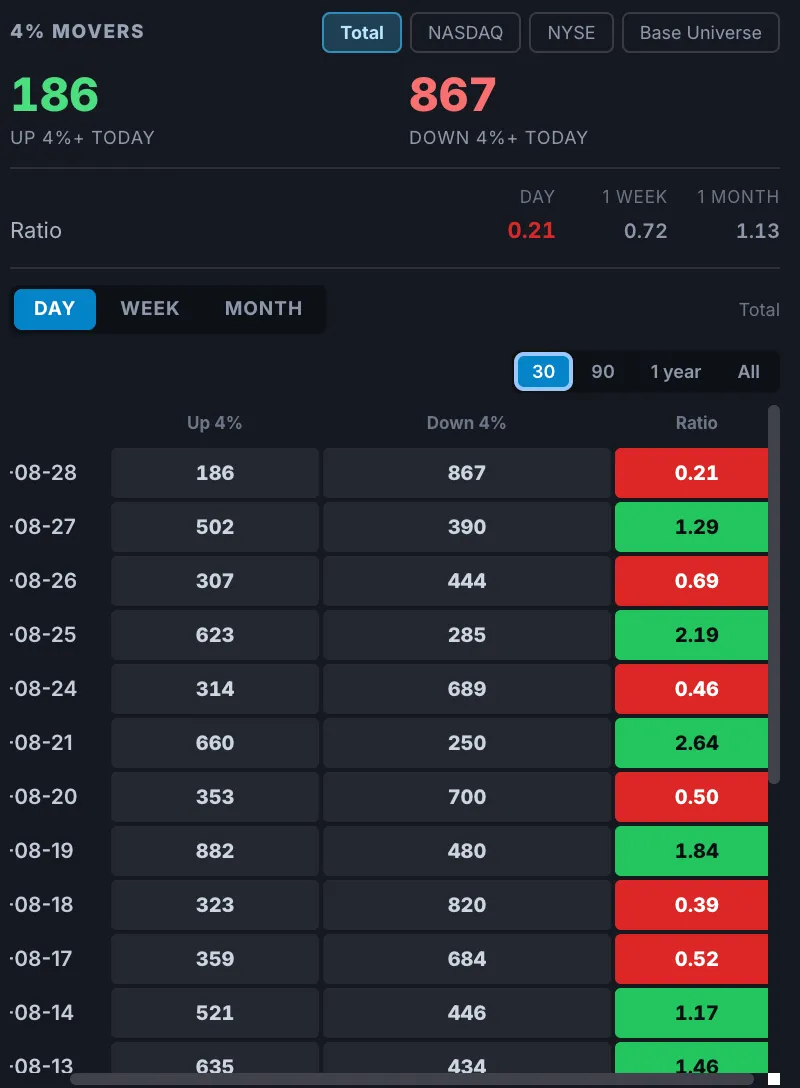
Today produced the weakest 4% mover ratio we have seen all month across the combined Nasdaq and NYSE universe.

  • 186 stocks advanced 4% or more

  • 867 stocks declined 4% or more

  • 4% mover ratio: 0.21

That means nearly five stocks fell at least 4% for every one stock that gained 4% or more.

Of the 1,053 stocks that moved at least 4% in either direction, approximately 82% were decliners, while only 18% were advancers.

The 4% mover ratio is a short-term momentum gauge that measures whether significant individual-stock moves are concentrated to the upside or downside, helping us identify buying or selling pressure beneath the indexes.

View on Substack ↗

Remember When AI Was Supposed to Kill Software?

Just a few months ago, everyone was convinced that AI was going to destroy the software industry.

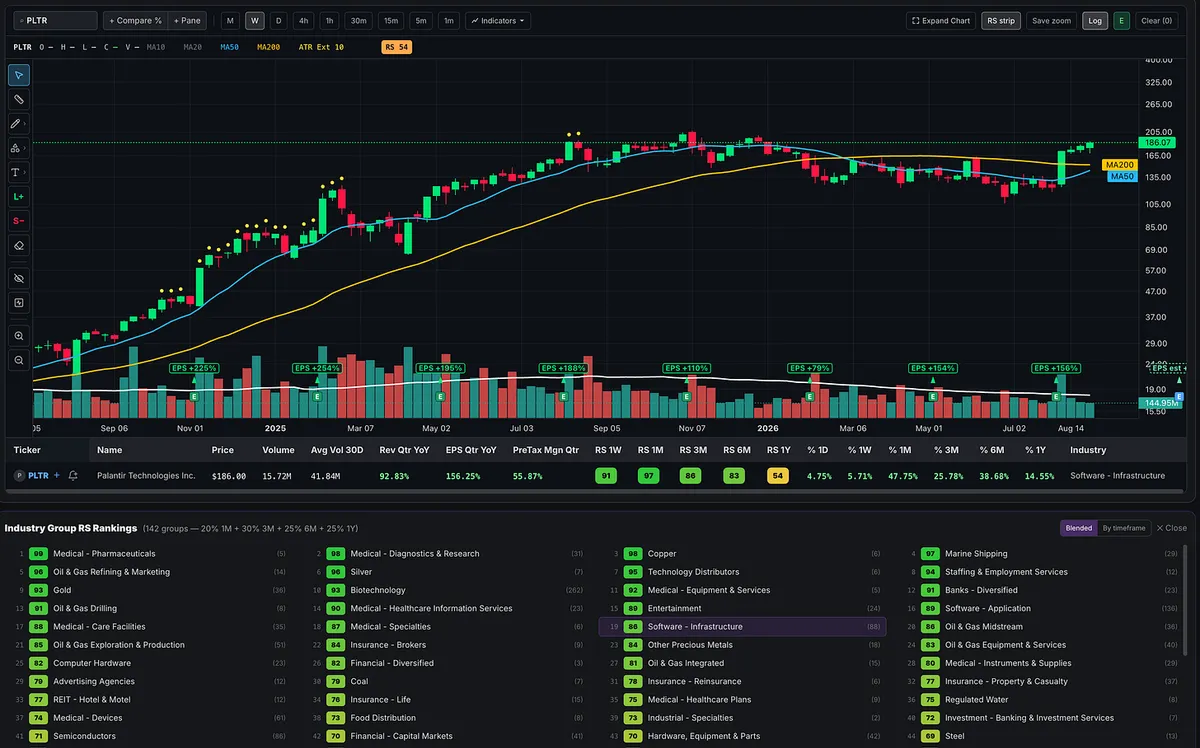
Now software stocks are delivering some of the market’s strongest moves and breaking out again.

Markets change quickly. Price tells the truth.

Looks like software is back.

View on Substack ↗

Most Traders Press the Gas at Exactly the Wrong Time

I see this cycle play out over and over again.

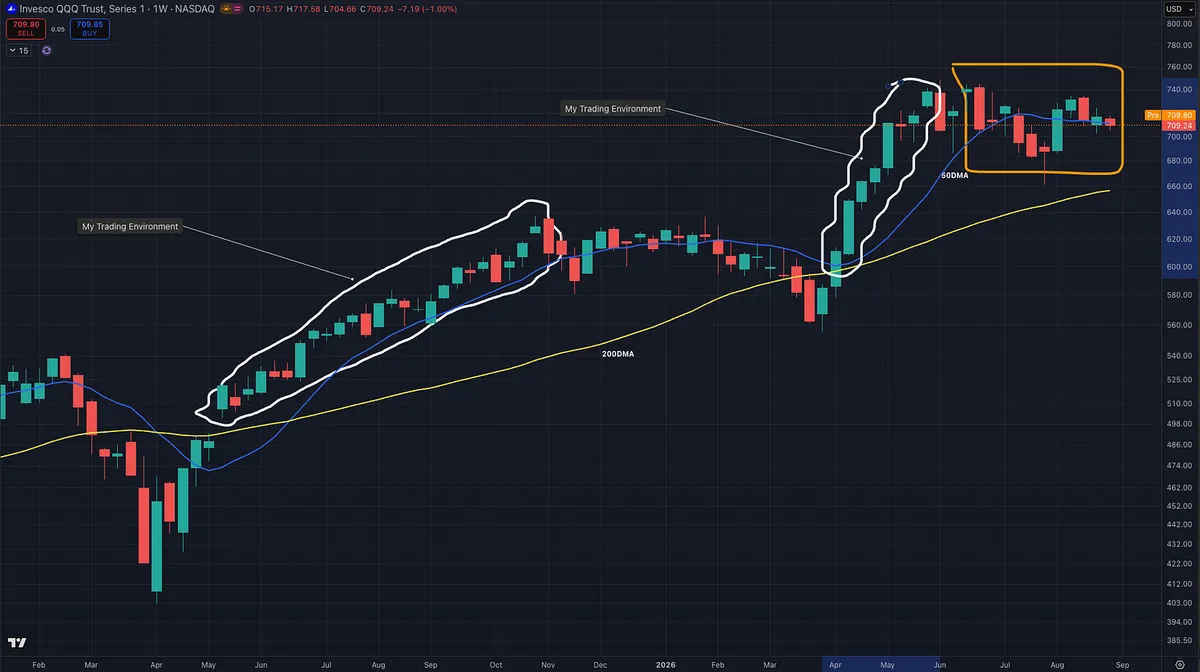
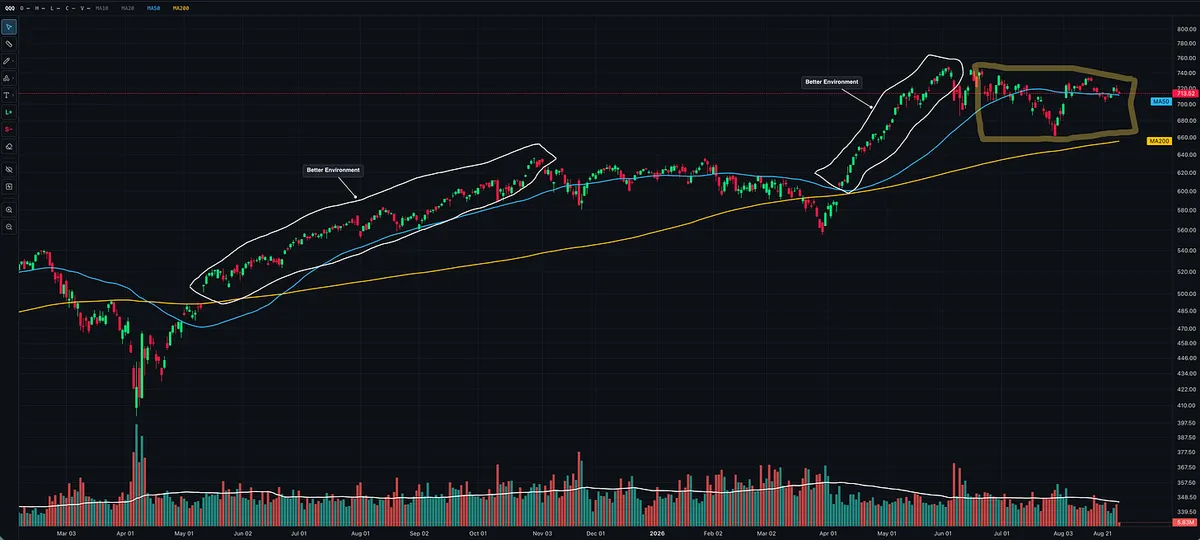
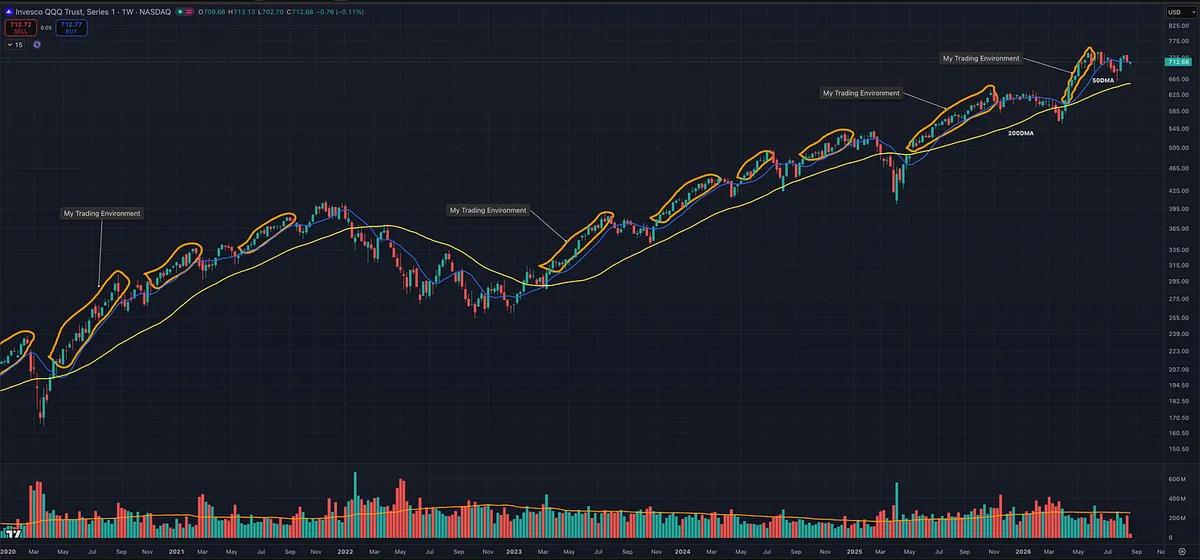
The circled areas on this chart show the environments when traders should be pressing the gas.

The market is in a clean uptrend. Week after week, it is making higher highs and higher lows. Price is at all-time highs and above both the 50-day and 200-day simple moving averages. This is a weekly chart with the daily moving averages plotted.

Yet this is when many beginners hesitate.

They miss the move, are afraid to enter, or simply lack the experience to recognize when the odds are in their favor.

Then the environment changes.

Price action becomes more difficult, and suddenly they are desperately searching for stocks and forcing activity. They are trying to make up for the move they already missed.

Eventually, the difficult period wears them out. Many traders are at that point right now.

Then the next uptrend begins.

They are too frustrated, exhausted, or afraid to capitalize on it. Their confidence and excitement only return after the move has already progressed, usually near the end.

Then the entire cycle repeats.

Pressing the gas does not mean abandoning risk management. It means progressively increasing exposure when the market is rewarding you and pulling back when it is not.

Let the market environment determine your exposure, not boredom, fear, regret, or the need for activity.

View on Substack ↗

Look at Bitcoin and Crypto Go 👀🚀

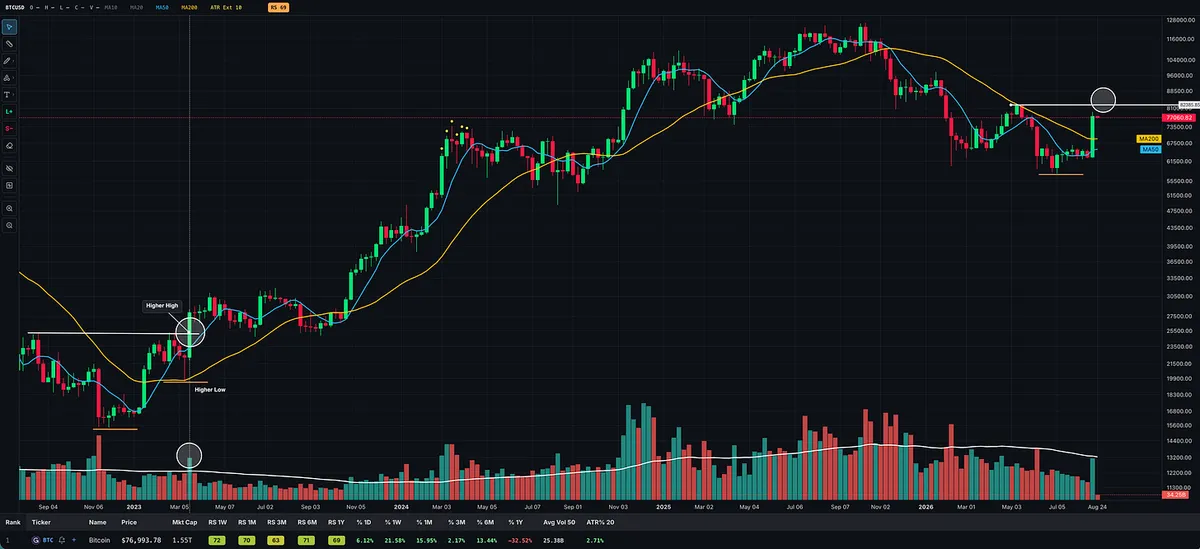
BTC is working toward showing the kind of character change I’ve been waiting to see.

Price is now back above the 200-day moving average, something we haven’t seen since the topping process began last fall.

From here, I’d actually prefer to see a pullback and consolidation rather than price just running straight up. Ideally, BTC establishes a higher low, similar to what we saw in 2023, and then turns higher to break out to a new high.

That would also give the 50-day moving average time to rise back above the 200-day, while allowing the 200-day to flatten out and eventually start trending higher.

Higher high. Higher low.

Price above the 200-day.

50-day crossing back above the 200-day.

200-day turning higher.

That’s the character change I’m looking for.

Crypto is getting interesting again. 👀

$BTC

View on Substack ↗

The Market Movers Have Looked Very Different All Week

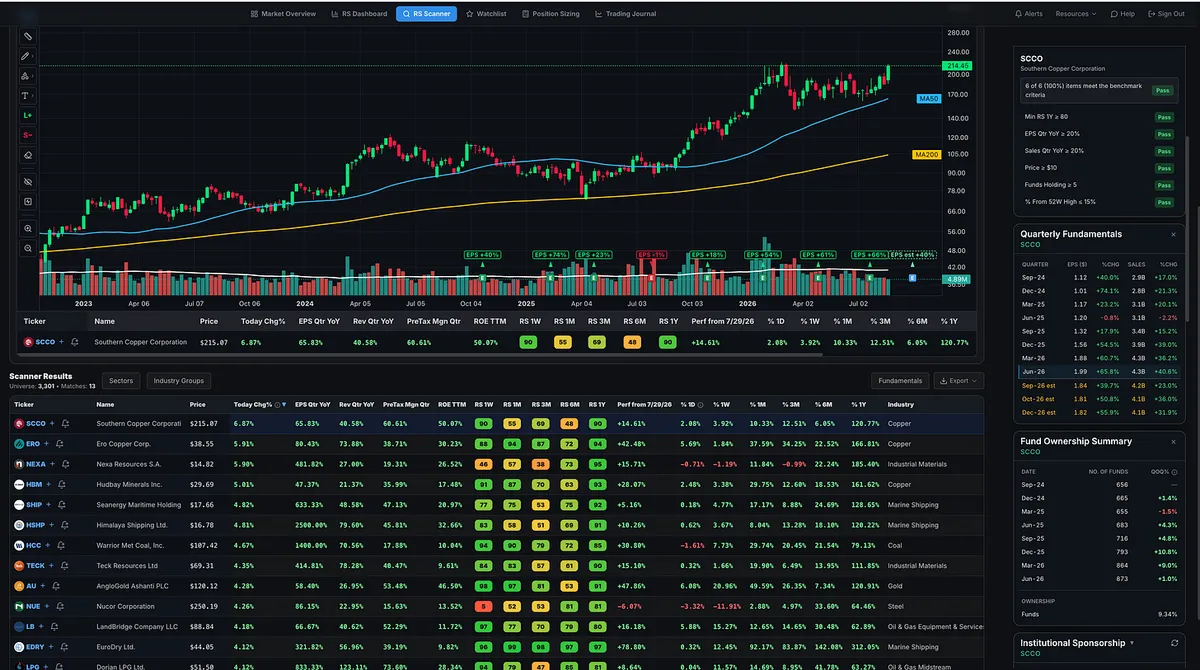
I’m looking at today’s biggest market movers, then running my growth scan and layering in the stocks with the biggest earnings and sales growth.

The picture looks very different from what we’ve become accustomed to seeing.

And it hasn’t just been today.

It’s been happening all week.

View on Substack ↗

If You’re Complaining About This Market, What Are You Going to Do in a Bear Market?

This market is sitting near all-time highs.

Major indexes are above key moving averages. Breadth is strong. Net new highs are outpacing net new lows. Leadership is broadening. There is plenty of evidence that buyers still have control.

And somehow, people are still complaining about how “hard” the market is.

That actually made me laugh, because it raises a much bigger question:

What are you going to do when a real bear market shows up?

Not if. When.

We will have another 2022. We will have another prolonged bear market. At some point, we will probably live through something much worse.

And 2022 wasn’t even some historic market catastrophe. It was a pretty normal bear market.

If normal volatility, corrections, pullbacks, failed breakouts, and a few frustrating weeks are enough to shake you out mentally, the problem probably isn’t the market.

Maybe you need to spend more time studying the market and its history. Or maybe the market isn’t the problem. Maybe it’s time to look inward.

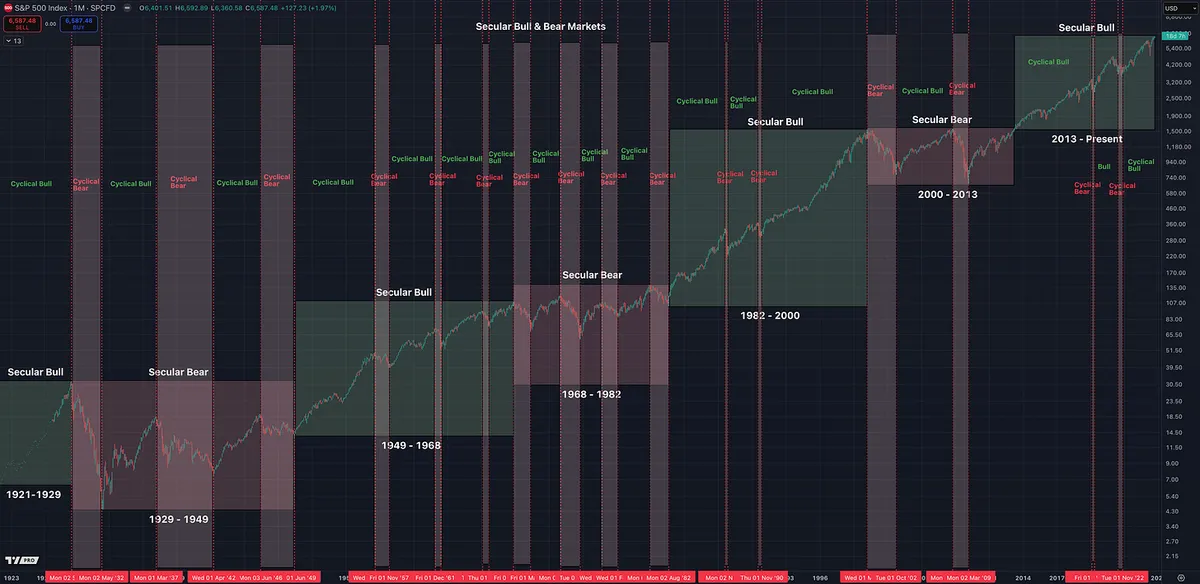
We are in a secular bull market and a cyclical bull market at the same time. It doesn’t get much better than this.

A lot of people who started trading over the last 15 or 20 years have never experienced a true secular bear market. Sure, they’ve lived through bear markets like 2020 and 2022, but those occurred inside a much larger secular bull cycle.

Eventually, that larger cycle will shift too.

I don’t say that to scare anyone. I say it because traders need to understand that markets move through cycles, and the conditions we’ve grown accustomed to will not last forever.

Study market history. Study bull markets. Study bear markets. Learn what changes when the larger cycle changes. And learn what normal, healthy market movement actually looks like.

Because if you think this is hard, eventually the market is going to show you what hard really looks like.