Momentum Trading Strategy

Notes

Market Conditions

Reading the overall market and deciding how aggressive to be.

Showing 41–60 of 227 notes

View on Substack ↗

The Market Wizard the Market Wizards Respected

“I deal in probabilities, not certainties. So, the key was strategy, not preaching.”Martin Zweig, Winning on Wall Street

That might be one of the most important market lessons ever written.

Most investors are trying to predict.

  • Where is the market going?

  • Is the Fed going to cut?

  • Is this the top?

  • Is this the bottom?

  • Is the economy going into recession?

Zweig approached the market differently.

He understood that you don't need certainty to make money. You need probabilities, risk control, and a strategy for what you will do as conditions change.

That distinction is enormous.

Before the 1987 crash, Zweig saw risk increasing, but he didn't pretend he knew exactly what would happen. In fact, he explicitly said he wasn't 100% certain. Instead, he adjusted his strategy, reduced risk, and positioned himself so that if he was wrong, the damage was manageable, and if the market collapsed, he was protected.

That is what great trading looks like.

  • Observe what the market is actually doing.

  • Determine the probabilities.

  • Adjust your exposure as the evidence changes.

  • Protect yourself when risk rises.

  • Get aggressive when the odds move back in your favor.

And if you're wondering how respected Martin Zweig was among great traders, go back and read Market Wizards.

Michael Marcus told Jack Schwager that he liked Zweig's market letters. Schwager then made an interesting observation: “Of the traders I have interviewed, Zweig is probably the one most mentioned.” Marcus responded that Zweig was very solid and that you always got something of value from him.

Bruce Kovner, one of the greatest macro traders ever interviewed by Schwager, specifically praised Zweig's risk control and his refusal to act like he could predict the future. Kovner's description is almost a perfect summary of Zweig's philosophy: Zweig observed what was happening and made rational bets from the evidence.

Richard Dennis was asked which analysts he respected.

His response?

“Zweig, is good.”

Paul Tudor Jones was even more direct. When Schwager asked which market advisers he paid attention to, Jones responded:

“Marty Zweig and Ned Davis are great.”

And David Ryan, three-time U.S. Investing Champion and William O'Neil's protégé, included Winning on Wall Street on his recommended reading list for someone serious about becoming a successful stock trader.

There is a reason so many great traders respected Zweig.

He wasn't trying to sound smart by predicting every turn in the market.

He was trying to survive long enough to exploit the opportunities when the probabilities were in his favor.

That's a very different game.

And a much more profitable one.

You don't need to know what the market is going to do next.

You need to know what you're going to do next based on what the market does.
View on Substack ↗

The Market Is Confirming the Rally

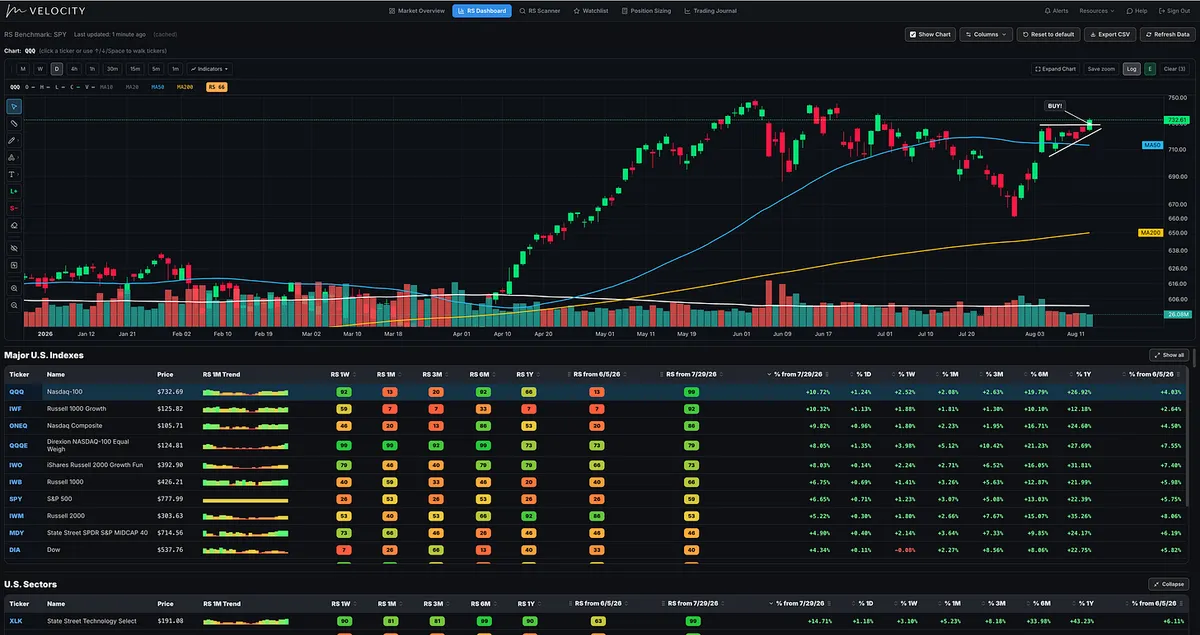
The NASDAQ continues to look strong, but the most important part isn’t simply that QQQ is moving higher.

It’s what’s happening underneath the indexes.

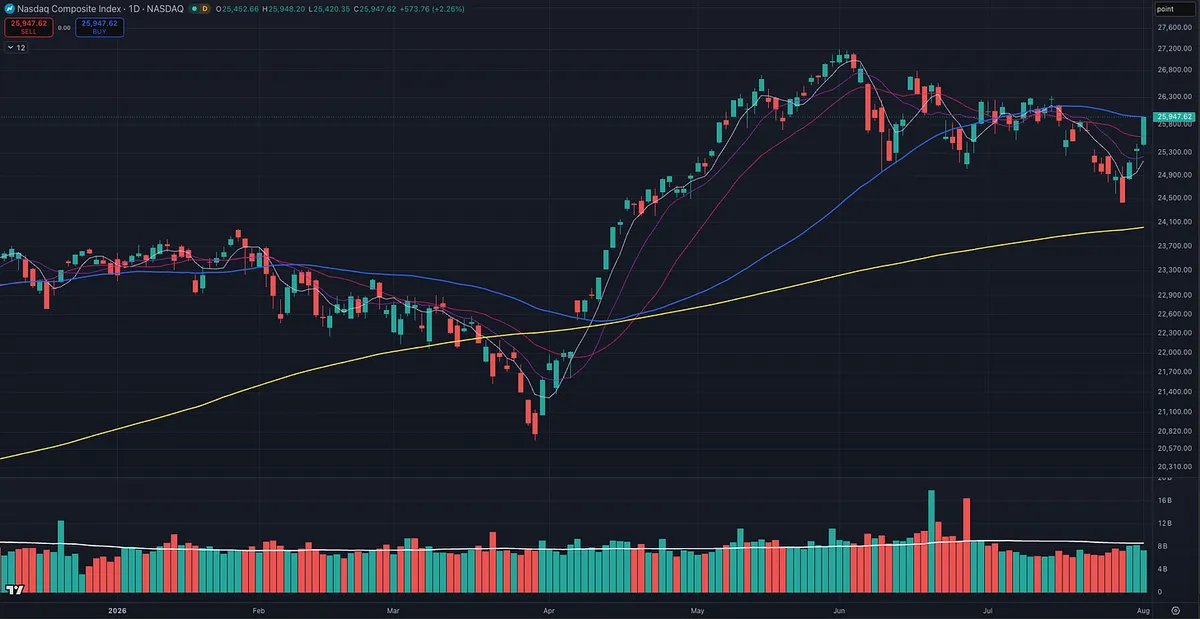
The August 4 follow-through day gave us the important confirmation that the market may have changed character. Since then, the rally has continued to hold up. The Nasdaq 100, Nasdaq Composite, S&P 500, and Russell 2000 are all above their key moving averages, while the Dow is pulling back toward its 10-day and still holding up well.

The market internals are also supporting the move.

Up/down volume is well above 1.0, showing buying volume is outpacing selling volume. The advance/decline ratio is positive. NASDAQ net 52-week highs are positive and expanding. Breadth has improved across the market, and over the past two weeks we’ve consistently seen significantly more stocks advancing 4% or more than declining 4% or more.

I consider those secondary pieces of evidence.

The most important confirmation is coming from the stocks themselves.

Growth stocks are beginning to outperform again. Technology has moved back into the lead, and many of the areas that led earlier in the year are reasserting themselves off the July 29 lows.

Semiconductors. Memory. Cybersecurity. Artificial intelligence. Select software.

And when I go into the stock screener and look at the strongest movers with big earnings and sales growth, I’m finding many of those same areas showing up again.

There was significant damage to growth leadership beginning in early June. So I didn’t want to assume that leadership had returned simply because the indexes bounced.

I wanted the market to prove it.

A follow-through day was one piece of evidence.

Improving price action was another.

Expanding new highs and stronger breadth added confirmation.

But ultimately, the strongest evidence is seeing fundamentally strong growth stocks with high relative strength beginning to break out, move higher, and emerge as leaders again.

That is what we want to see.

Of course, none of this means the market has to continue higher. There are no guarantees.

The goal isn’t to predict what happens next.

The goal is to objectively read what the market is doing right now, follow the strongest stocks and industry groups, and let our own trading results determine how aggressive we should become.

If the leaders keep working, exposure can increase progressively. If breakouts begin failing and our trades stop working, we pull back.

Right now, the weight of the evidence continues to improve.

But as always, the stocks themselves get the final word.

View on Substack ↗

The Market Can Go Much Higher Than You Think. And Much Lower Than You Can Imagine.

One of the most important trading skills I’ve developed over the years did not come naturally to me.

I had to force myself to learn it.

In Market Wizards, Jack Schwager asked legendary trader Bruce Kovner what separated him from the average trader.

Kovner said one of his greatest strengths was his ability to “imagine configurations of the world different from today” and actually believe they could happen.

That sounds simple.

It isn’t.

Most investors are anchored to what just happened.

After a correction, they remember the losses, the bad headlines, the economic problems and all the reasons the market supposedly shouldn’t go higher.

Then the market starts turning.

A follow-through day appears. Price begins moving powerfully higher. Leading stocks start reclaiming moving averages and breaking out of bases.

But people hesitate.

“How can the market possibly go higher from here?”

Then it goes higher.

The exact opposite happens during major declines.

A stock falls 30%, and people say it can’t possibly fall another 30%.

The market drops 20%, and suddenly everyone is calling it cheap.

They keep trying to decide where the market should stop instead of watching what the market is actually doing.

Then it keeps falling.

One of the biggest changes in my trading came when I started forcing myself to accept a simple truth:

Anything is possible.

That does not mean predicting crazy outcomes.

It means refusing to mentally eliminate them.

If my process tells me the market is improving, price is confirming it, and quality stocks are setting up, I want to be able to pull the trigger even when the prevailing narrative tells me the market has no business going higher.

And when distribution starts piling up, leaders begin breaking down and price starts telling me something is wrong, I want to be able to reduce exposure even while everyone around me is still euphoric.

Kovner described great traders as independent, extremely contrary and disciplined enough to take appropriate position sizes.

That mindset is important because the market does not care what seems reasonable.

It does not care what economists think fair value should be.

It does not care how far something has already risen or fallen.

Your job is not to decide what the market is going to do.

Your job is to recognize what it is doing, manage your risk and execute your process.

The moment you truly accept that the market can go much farther than you think possible, you stop trying to impose your opinion on it.

And you start listening to it.

View on Substack ↗

The Market Has Flipped the Switch. Now Comes the Hard Part.

The market gave us the signal we were waiting for.

✅ Follow-through day

✅ S&P 500 reached all-time highs last week

✅ Breadth expanded

✅ Major indexes back above key moving averages

But here’s where it gets interesting.

A strong index tape doesn’t automatically mean the next great growth-stock leaders have emerged.

Some of the biggest moves off the July 29 lows are coming from stocks that were previously crushed. Meanwhile, many former leaders are still technically damaged.

So I’m not interested in chasing everything that’s bouncing.

I’m looking for the stocks and industry groups showing real relative strength, strong growth fundamentals, and leadership as this new uptrend develops.

The market gave us the green light.

Now we have to figure out which stocks actually deserve our capital.

At the end of this week’s Big Picture Market Pulse, I shared 10 stocks across several different areas of the market that are standing out as potential leaders.

Full Big Picture breakdown below 👇

https://tradingmomentum.substack.com/p/the-market-just-gave-us-the-signal

On SubstackBig Picture Market Pulse | August 10, 2026: The Market Just Gave Us the Signal We Were Waiting For: Now Comes the Hard Part
View on Substack ↗

The Market Climbs a Wall of Worry

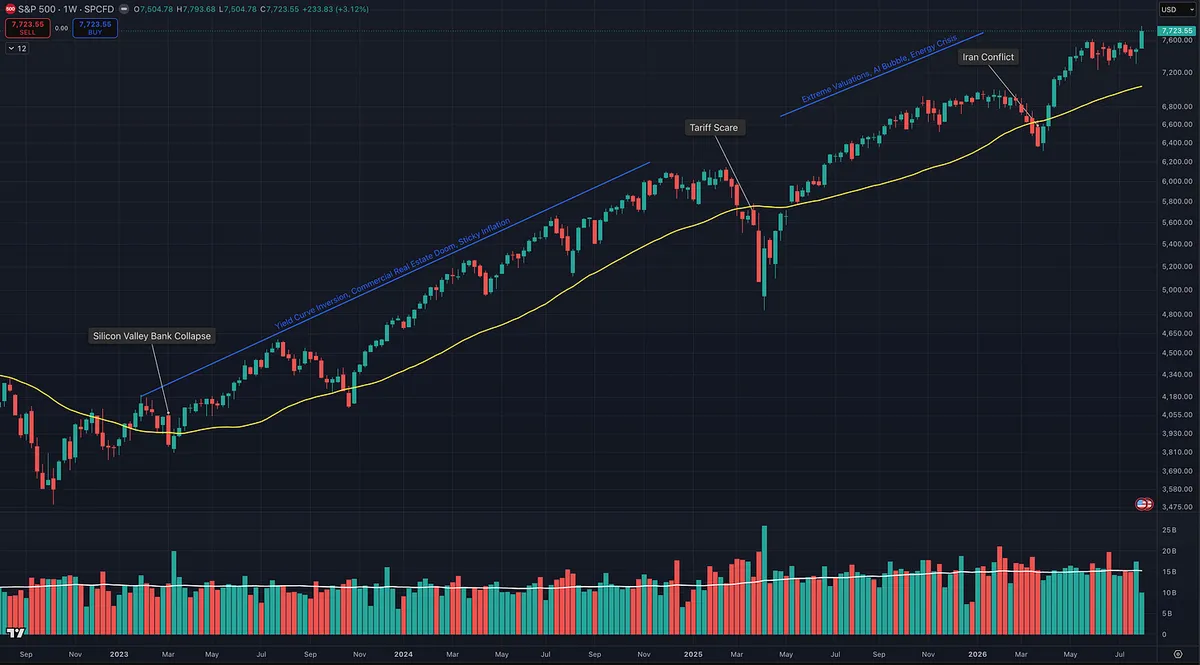
When we look back at this bull cycle, there has been no shortage of reasons to believe the market should not be going higher.

Silicon Valley Bank collapsed in March 2023.

Then came the deeply inverted yield curve, commercial real estate doom, sticky inflation, higher-for-longer interest rates, tariff fears, extreme valuations, the AI bubble narrative, the Iran conflict, and fears of an energy shock.

There have been a million reasons not to participate.

There have been a million reasons to short the market.

Yet it has consistently paid to stay optimistic.

The problem is not optimism.

Optimistic traders usually get destroyed because they fail to manage risk, position sizing, and leverage first.

On the other side, many bearish traders manage risk well but remain so negative that they fail to participate when the market continues moving higher.

The best approach is to combine both sides.

Manage your risk and position sizing first.

Then allow yourself to be an optimist when everyone else is convinced the end is near.

The market climbs a wall of worry.

The time to become truly cautious is when the worry disappears, everyone becomes euphoric, and nobody can imagine prices falling.

When there is no longer a wall of worry left to climb, that may be when the music is finally about to stop.

View on Substack ↗

The Market Delivered a Follow-Through Day

After reviewing today’s closing volume across the major indexes, futures, and ETFs, the message is clear: the weight of the evidence supports increasing exposure.

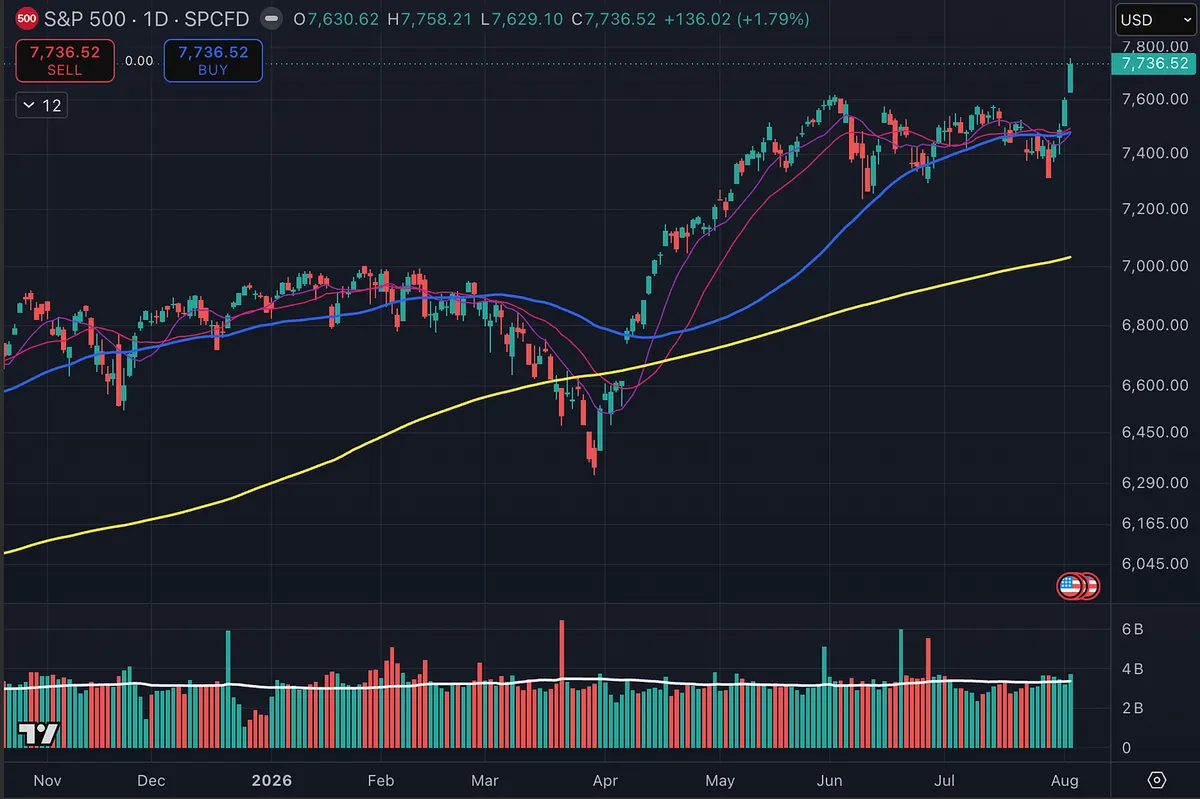
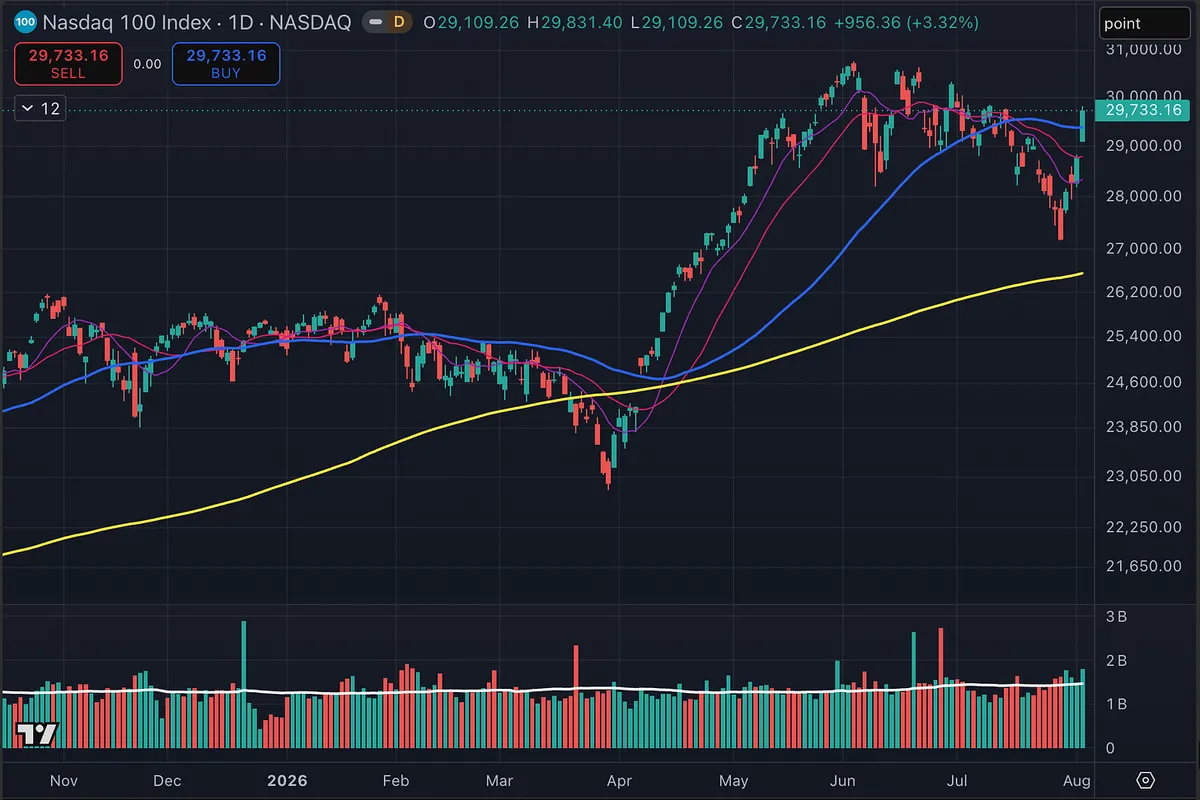
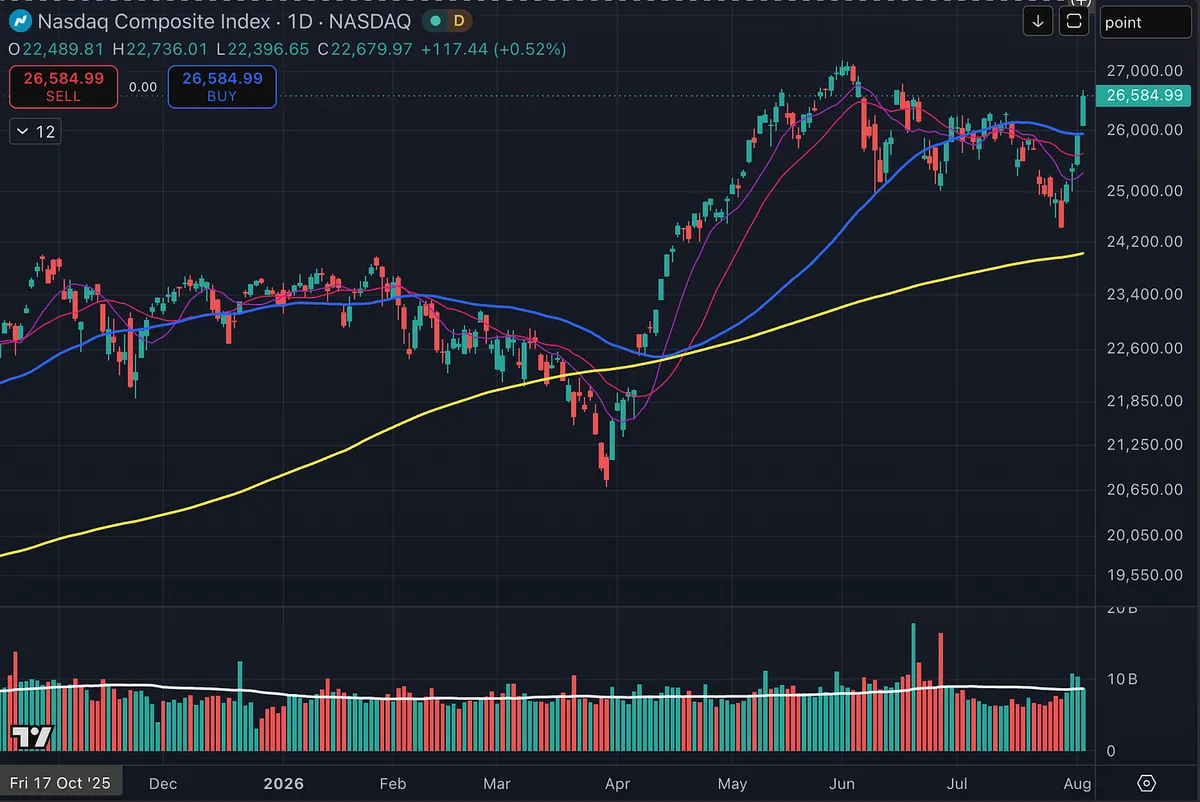
The S&P 500 gained 1.79%, the Nasdaq 100 rose 3.32%, the Nasdaq Composite advanced 2.59%, the Russell 2000 climbed 1.85%, and the Dow gained 1.72%.

Volume confirmed the move across nearly every major benchmark. The S&P 500 and Nasdaq 100 traded higher on increased volume in the cash indexes, futures, and their corresponding ETFs. The Dow and DIA also posted higher volume.

The one exception was the Nasdaq Composite. Its reported index volume was lower than the previous session, so it did not technically qualify for an official follow-through day on its own. However, ONEQ, the Fidelity Nasdaq Composite Index ETF, did trade on higher volume.

The S&P 500 and Nasdaq 100 both delivered follow-through-day signals, the major index ETFs confirmed the move, and the Nasdaq Composite has reclaimed all of its key moving averages.

The Broader Market Is Confirming the Move

The signal is also supported by extraordinary strength beneath the surface.

The S&P 500 and Dow are at all-time highs. The Russell 2000 is sitting near its record high, while equal-weight indexes such as RSP, EDOW, and the equal-weight Russell 1000 are also at or near all-time highs.

The strength extends well beyond the largest companies. The S&P MidCap 400 ETF, MDY, is at an all-time high. The Russell 1000, major value indexes, the Vanguard Total Stock Market ETF, and the NYSE Composite are also at or near record highs.

Meanwhile, the Nasdaq Composite, Nasdaq 100, and the equal-weight Nasdaq 100 ETF, QQQE, are all trading above their key moving averages.

This shows broad participation. The market’s strength is not confined to a small area of the market. Large caps, mid-caps, small caps, equal-weight indexes, value stocks, growth stocks and the broader NYSE are all participating.

That breadth adds credibility to the follow-through signal.

Why All-Time Highs Matter

All-time highs matter because they remove most of the overhead supply created by investors who previously bought at higher prices and are waiting to sell when they get back to breakeven.

When an index or stock moves into new-high territory, virtually everyone holding it is sitting on a profit. There is no large group of trapped investors waiting to sell simply to recover their original investment.

That does not mean the market cannot pull back. It means a major source of potential resistance has been removed, allowing prices to advance more freely when institutional demand remains strong.

This is why legendary traders such as Jesse Livermore, Nicolas Darvas, William O’Neil, and Mark Minervini have placed so much importance on stocks and markets moving into new-high ground.

Strength often produces further strength. The strongest markets and stocks can appear expensive, extended, or “too high” long before their advances are finished.

What the Evidence Is Telling Us

The evidence supports increasing exposure and participating in this market.

That does not mean immediately moving to maximum exposure. It means adding positions progressively as individual stocks confirm the market’s strength and our individual trades begin working.

The previous two occasions when the market experienced a meaningful correction, reclaimed the 50-day moving average, and produced this type of follow-through signal were May 12, 2025, and April 8, 2026.

Today’s action is the signal we have been waiting for. The focus now shifts to execution: identifying the strongest leadership, entering positions with disciplined risk management, and allowing successful trades to earn additional exposure.

View on Substack ↗

The Old Leaders Are Waking Back Up

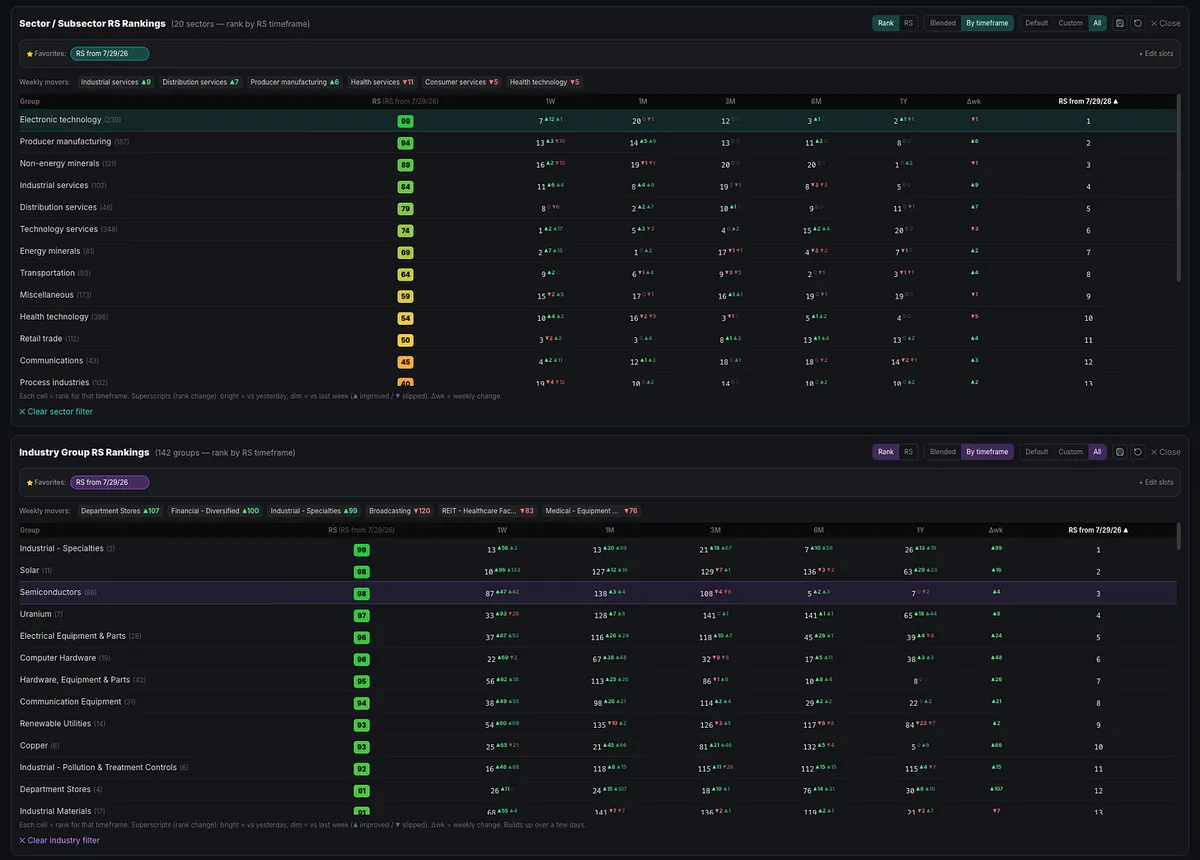
The strongest sectors and industry groups since the July 29 low are many of the same areas that led the market over the past year:

Technology

Semiconductors

Electrical Equipment and Parts

Computer Hardware

Electronic Equipment and Parts

Communication Equipment

These areas took a beating after major runs in many of their leading stocks.

We will see whether the market produces a follow-through day today or in the coming days, and whether these groups can reclaim their prior leadership.

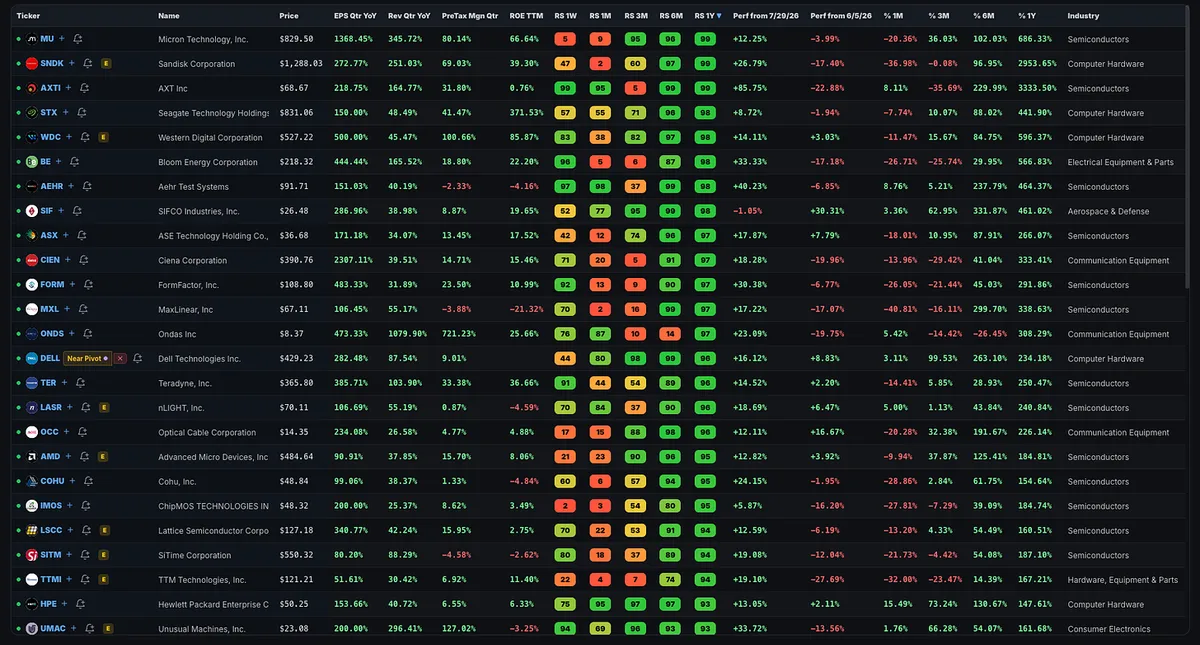
Many of the former leaders, including SNDK, MU, BE, CIEN, and PENG, were hit hard and still have significant ground to recover.

But the areas that led before the correction are once again showing some of the strongest relative performance off the lows.

View on Substack ↗

A Different Kind of Strength Since Last Wednesday’s Low

Now we will see if the rally attempt earns confirmation with a follow-through day in the coming days.

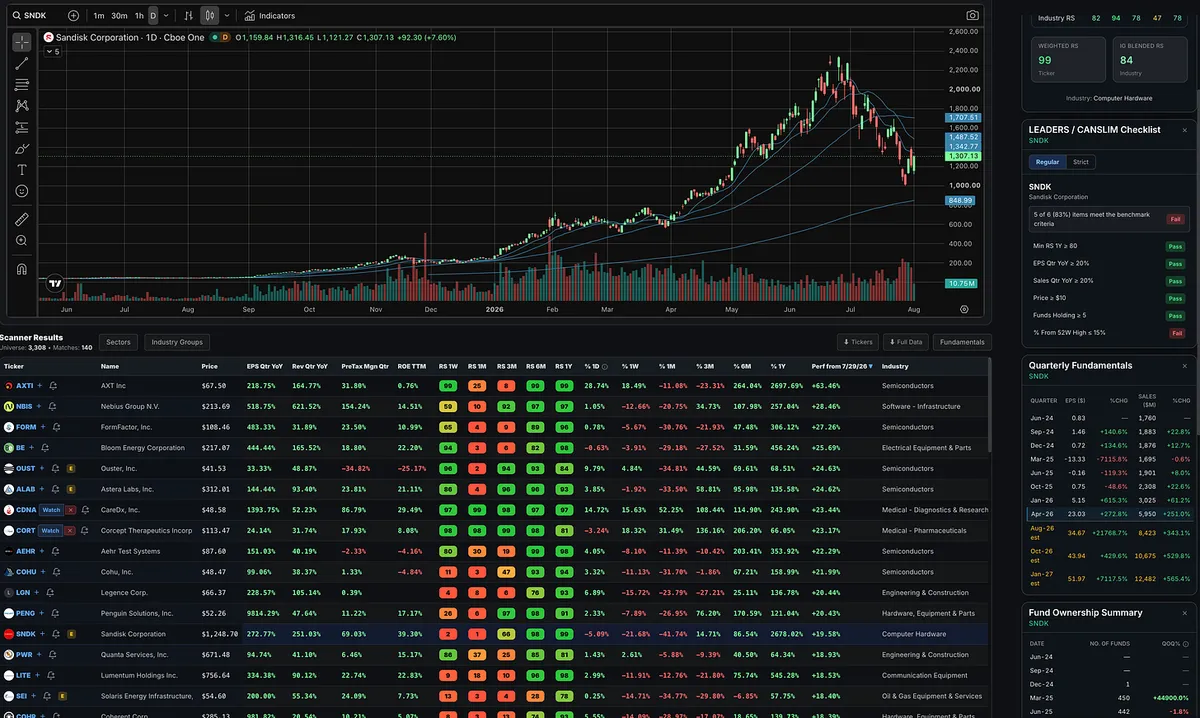
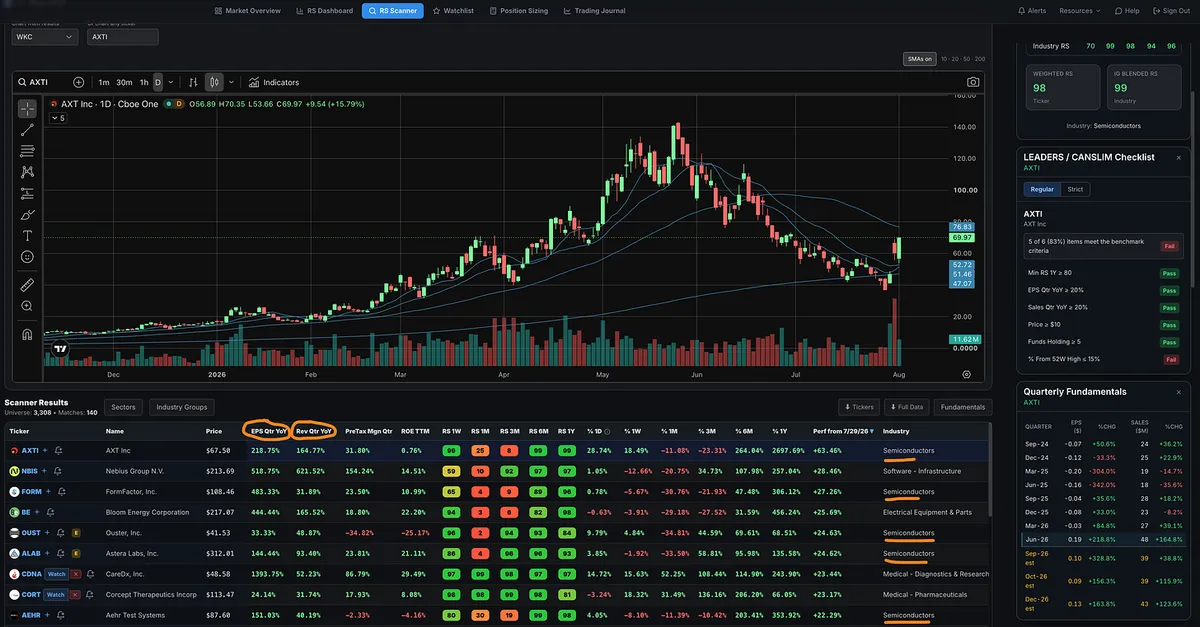
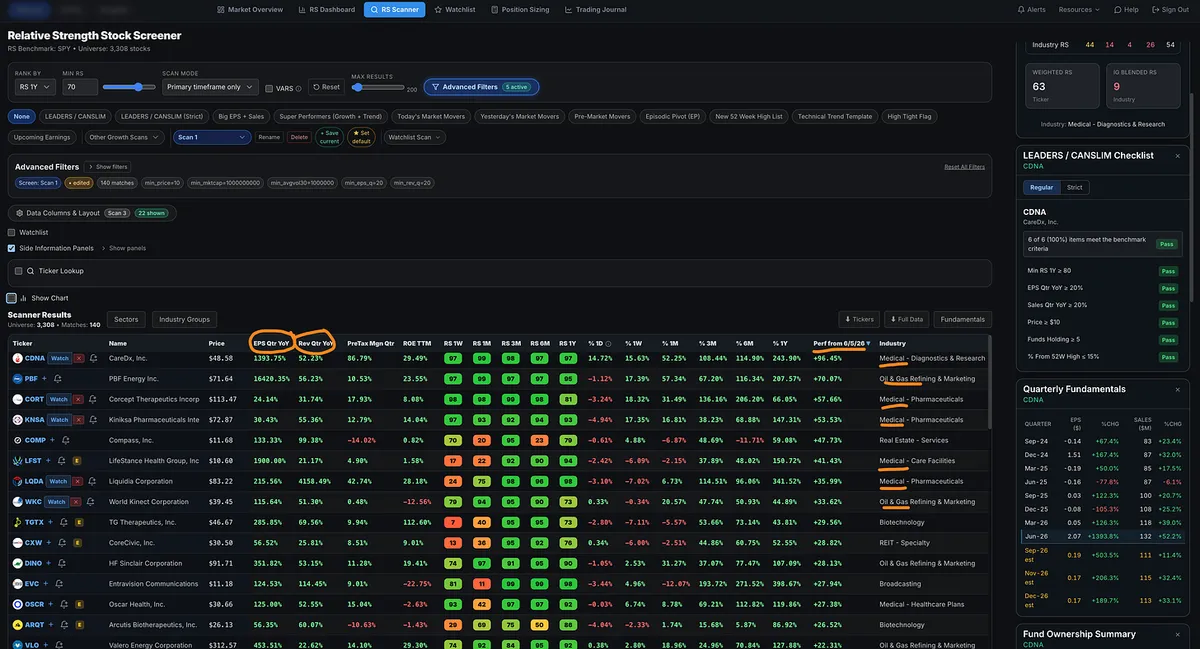
Using the same scan of liquid stocks with big earnings and sales growth, the leaderboard looks completely different depending on the starting point.

From the June 5 character change through today, the strongest performers have largely come from healthcare, energy, and other less traditional growth areas.

When performance is measured from last Wednesday’s low, however, the list shifts sharply toward semiconductors and beaten down former leaders.

That change is notable, but it is not yet proof that these stocks are back or that a new leadership cycle has begun. Many remain well below their highs. AXTI, for example, had declined nearly 75%. During corrections and bear markets, deeply damaged stocks can produce powerful short term rallies without repairing their longer term trends.

The question now is whether this develops into sustained relative strength, institutional accumulation, or fades as another rebound from oversold levels.

The market still has to provide the evidence. A rally attempt can fail or develop into a legitimate follow through, while genuine leaders must continue separating themselves through superior relative strength and price and volume action.

Same fundamental scan. Different measurement window. Completely different type of stock showing strength. It is a character change worth watching, not a conclusion.

View on Substack ↗

Everyone’s Afraid of an AI Bubble. They’re Missing the Point.

We are likely in an AI bubble.

That does not mean artificial intelligence is fake, useless, or incapable of changing the world.

Railroads changed the world and helped fuel major investment manias.

The automobile, radio, electricity, aviation, and other new technologies helped drive the speculative boom of the 1920s.

The internet changed the world and created the dot-com bubble.

The pattern is familiar.

Transformative innovation attracts capital.

Capital attracts excitement.

Excitement turns into speculation.

Eventually, prices run ahead of reality.

Then the bubble bursts.

But the crash does not make the technology disappear.

Most of the weak companies are wiped out, capital becomes more disciplined, and the strongest survivors continue building the future.

That is often where the real transformation begins.

So being in a bubble does not mean we stop trading.

For a growth stock or momentum trader, bubbles can create some of the greatest opportunities in the market.

The real danger is not participating, and participating without sell rules.

Inexperienced investors buy the biggest names, assume the trend will continue forever, and never decide when to take profits or when to exit.

That is not what we do.

We do not need to predict the exact day the bubble pops.

We follow price, volume, market direction, institutional selling, and the behavior of leading stocks.

As the evidence weakens, we peel out of positions and raise cash.

William O’Neil taught it.

Mark Minervini teaches it.

It is exactly what I teach inside the Momentum Trading Strategy course.

The bubble is not what should scare you.

Having no sell rules should.

View on Substack ↗

Stop Fighting the Market

“Three out of four stocks usually follow the overall market trend, whether it’s up or down.” - William J. O’Neil

William O’Neil spent decades studying the greatest winning stocks in market history. His conclusion was simple: the majority of stocks move with the overall market.

When the market is rising, most stocks rise with it.

When the market is falling, most stocks decline with it.

This is not just something O’Neil understood. Legendary traders across generations have built their strategies around the same truth. Your odds of success improve dramatically when you align yourself with the market’s primary direction.

Yet many of you continue fighting against the current.

When the market was moving higher week after week and leading stocks were breaking out, you were afraid to pull the trigger.

Now that the market has weakened, you suddenly want to buy every dip and prove that you can find the one stock strong enough to ignore everything happening around it.

Trading is already hard enough.

You do not need to make it harder by constantly positioning yourself against the market.

View on Substack ↗

You Think This Is Bad? Zoom Out.

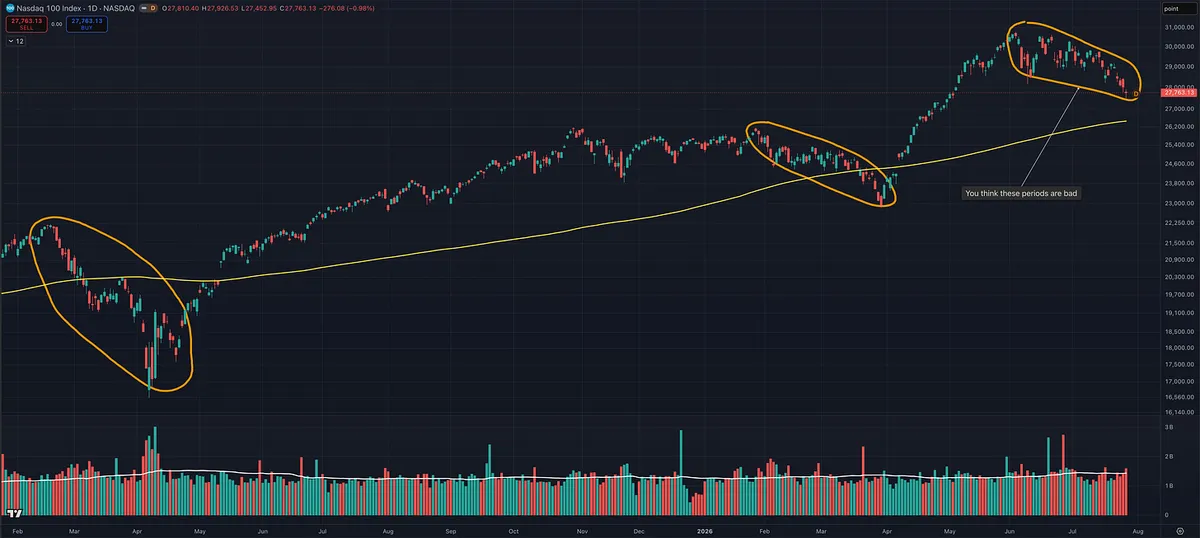
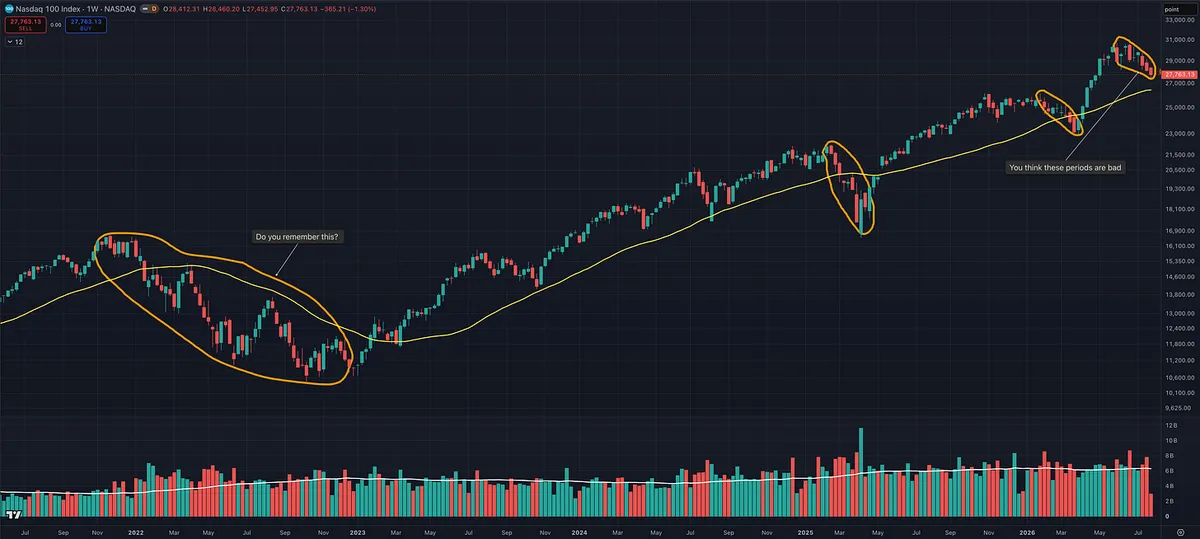
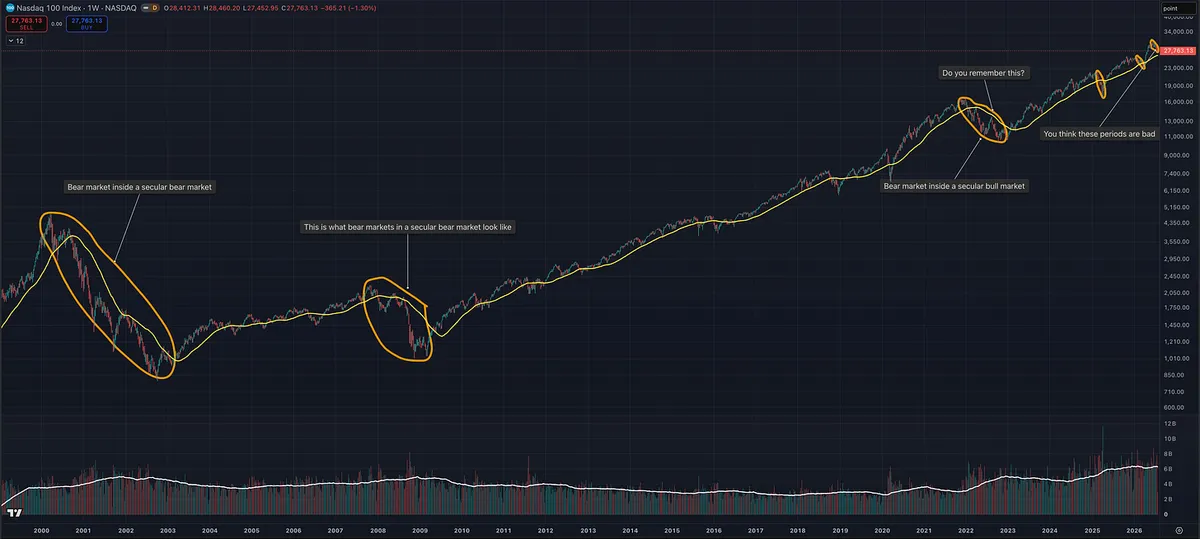
It is funny watching so many newer traders act as if every bull market consolidation or correction is some historic disaster.

Were they not trading in 2022?

And even 2022, in the grand scheme of market history, was not that bad.

Yes, it was painful. Many former leaders lost 50%, 70%, or more.

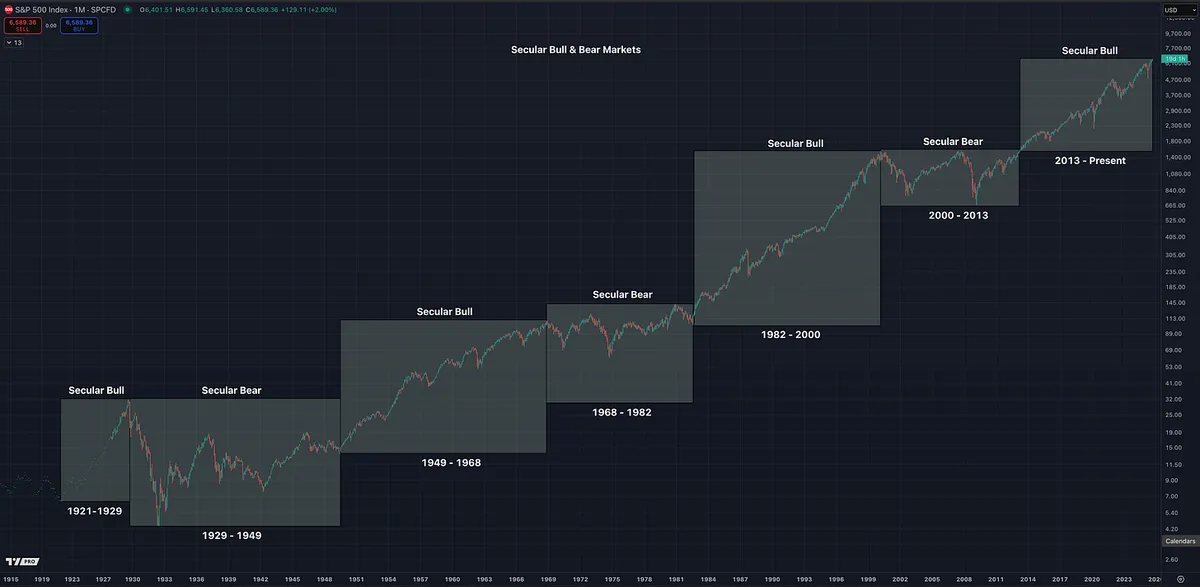
But 2022 was still a cyclical bear market inside a much larger secular bull market.

A cyclical bear market inside a secular bull market can be violent, but the market eventually repairs itself and resumes the larger long-term advance.

A bear market inside a secular bear market is an entirely different animal.

Go study 2000 through 2002.

Then study 2008.

Those declines occurred during the broader secular bear market that stretched from roughly 2000 through 2013. Rallies repeatedly failed, major indexes made little lasting progress for years, and investors could not simply assume every correction would eventually lead to new highs.

That is what a truly hostile long-term market environment looks like.

The current secular bull market will eventually end. It is aging, and nothing lasts forever.

But that does not mean every consolidation, correction, or uncomfortable stretch is the beginning of the next Great Depression.

Zoom out.

The periods that feel unbearable on a daily chart often appear as small interruptions within a much larger advance when viewed across several decades.

That does not mean you ignore weakness, hold blindly, or stop managing risk.

It means you understand context.

Respect the correction. Protect your capital. Reduce exposure when conditions deteriorate.

But relax.

Not every pullback is 2008.

Not every bear market is the beginning of a secular bear market.

Sometimes the market is simply correcting inside a much larger bull market.

View on Substack ↗

Your Strategy Isn't Broken. You're Ignoring the Context.

One of the biggest mistakes beginner traders make is believing strategies, setups, and indicators work the same way in every market.

They don't.

The same strategy can perform extremely well in one environment and struggle badly in another.

The same setup can produce powerful follow-through when the market, industry group, and stock are aligned, then repeatedly fail when those conditions disappear.

The same indicator can be bullish in one situation and meaningless in another.

Education matters, but experience develops the awareness to understand when each signal actually matters.

A novice sees an overbought reading and immediately thinks, "Sell."

An experienced trader asks:

What is the market context?

Did the market just break out of a six-month correction, with institutions returning and the indexes reclaiming key moving averages?

Or are we months into an extended rally, with leadership stocks breaking down, distribution increasing, and volatility rising?

The same indicator can flash in both situations, but the message is completely different.

After months of consolidation, a few powerful weeks may only be the beginning of the move.

After months of running hot, that same reading may be warning you to sell positions and reduce exposure.

The indicator didn't change.

The context did.

The same applies to your strategy and setups.

A breakout strategy has better odds when the market is healthy, leadership is expanding, strong industry groups are producing multiple winners, and institutions are aggressively buying.

That exact same breakout setup has much lower odds when the indexes are weakening, yesterday's leaders are breaking down, and the stock belongs to a weak industry group.

Eventually, you start saying:

"This strategy doesn't work."

But the strategy may not be the problem.

You may be using it in the wrong market, in the wrong group, and in the wrong stocks.

Experienced traders are not reading one signal.

They are reading the entire environment.

Years of screen time do not simply teach you patterns.

They teach you how the pieces fit together.

No single factor makes the decision.

It is the weight of the evidence.

Situational awareness is also difficult to maintain when you are emotionally overwhelmed by oversized positions or unwilling to accept the risk you placed in the market.

Before considering an individual trade, ask:

  • Is my strategy suited for this market?

  • Are my setups currently producing follow-through?

  • Does this indicator matter in the present context?

Before every trading day, ask:

"What kind of market am I in?"

Once you answer that question, everything else becomes easier to interpret.

Context is the lens through which every strategy, setup, and indicator should be viewed.

View on Substack ↗

The Market Already Told You. You Just Weren’t Listening.

Most traders obsess over the news.

Professionals obsess over the market’s reaction to the news.

That difference changes everything.

When a company reports outstanding earnings and sales, raises guidance, announces a major partnership, or receives another bullish catalyst, what should happen?

The stock should go up.

But what if it doesn’t?

What if it barely moves, or worse, sells off?

The news wasn’t the important part.

The market’s reaction was.

The opposite is also true.

When negative headlines seem endless, yet stocks continue making higher highs and higher lows, the market is telling you that buyers are overwhelming sellers. That’s exactly why people say bull markets climb a wall of worry.

Price is revealing something the headlines cannot.

The market is a continuous auction, and price is the final vote on whether the news actually matters.

Strong markets shrug off bad news.

Weak markets can’t capitalize on good news.

If bullish catalysts keep appearing but price refuses to advance, pay attention. Institutions may already be fully invested, expectations may already be priced in, or demand simply isn’t strong enough to push prices higher.

Either way, the message is the same.

Stop asking whether the news is good or bad.

Start asking how the market responded.

Because in the end, price is the truth.

View on Substack ↗

The Market Shift Was Hiding in the Screens

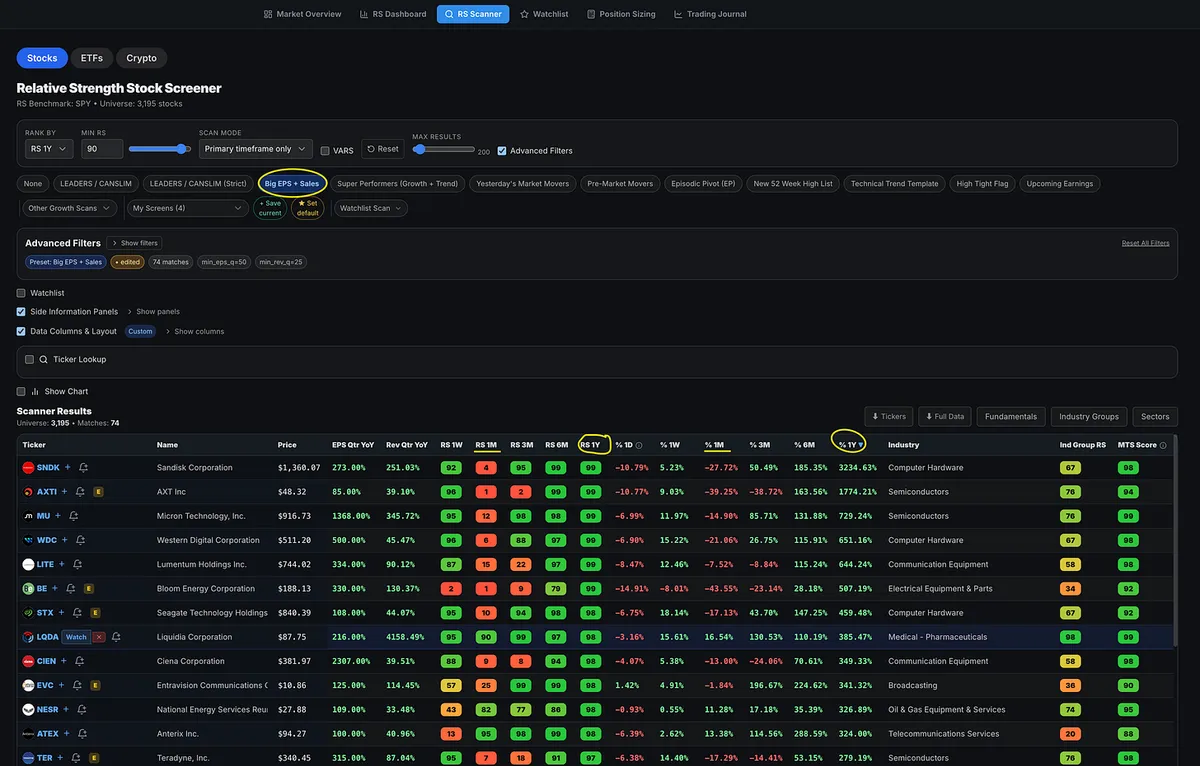
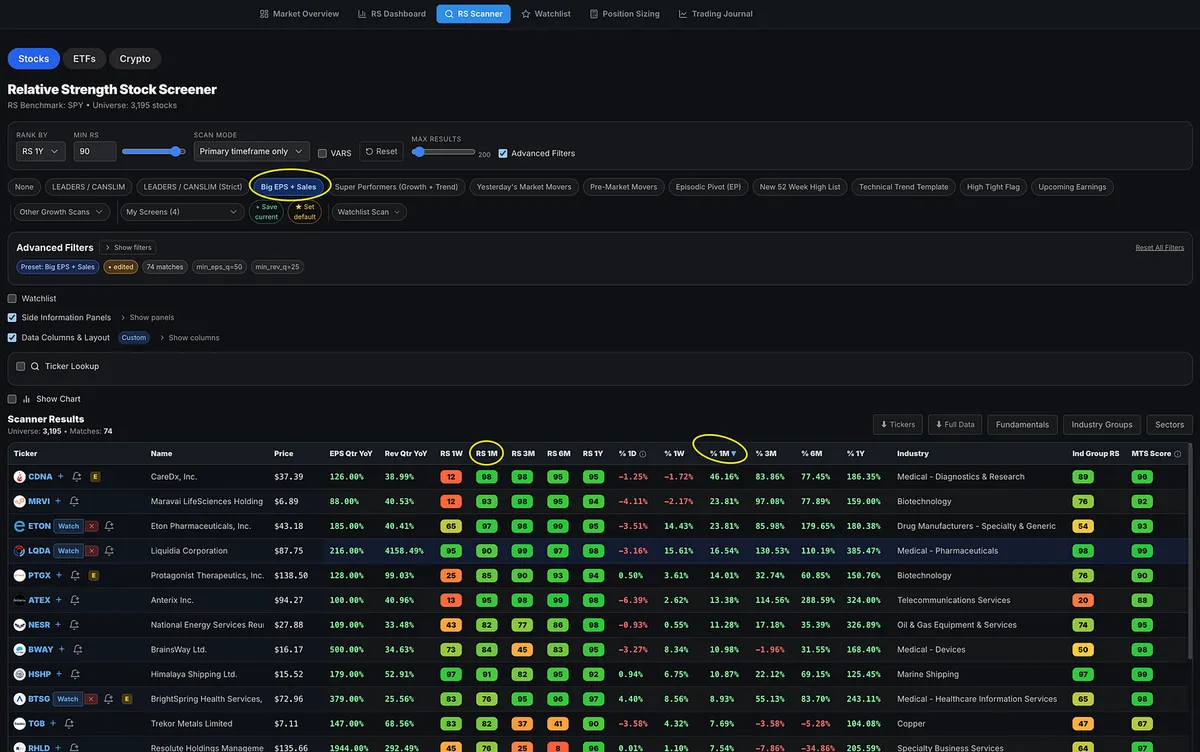
One of my favorite scans, and one I ran for years in MarketSurge, is the Big EPS and Sales screen. I now run the same scan inside the Momentum Trading Strategy software.

When you sort the results by one-year relative strength, the familiar leaders dominate: SNDK, MU, LITE, WDC, WTX, TER, etc.

The strongest groups are also the ones we have become accustomed to seeing: semiconductors, computer hardware, telecom, and communications equipment.

But sort the exact same screen by one-month relative strength, and the picture completely changes.

Now you see medical, biotechnology, pharmaceutical, oil and gas, and marine shipping names moving toward the top.

This shift was visible in the individual stock screens weeks ago.

When the indexes, sectors, industry groups, and individual stock screens all begin telling the same story, you are no longer guessing whether leadership is changing.

You are watching it happen in real time.

View on Substack ↗

The Market Changed on June 5. Your Relative Strength Lookback Should Too.

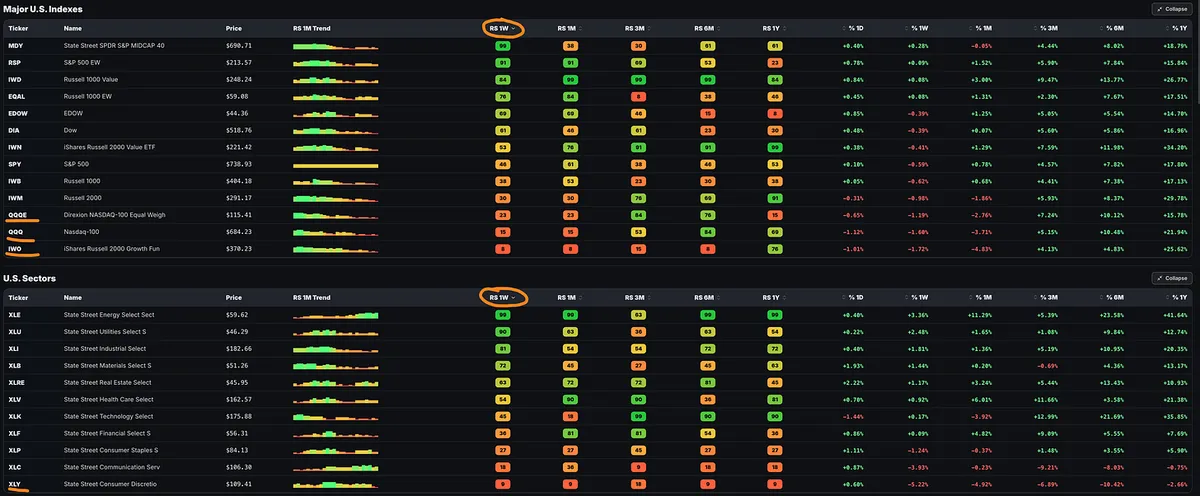
Most platforms only let you measure relative strength using default timeframes like three months, six months, or one year.

But the market does not change character according to those defaults.

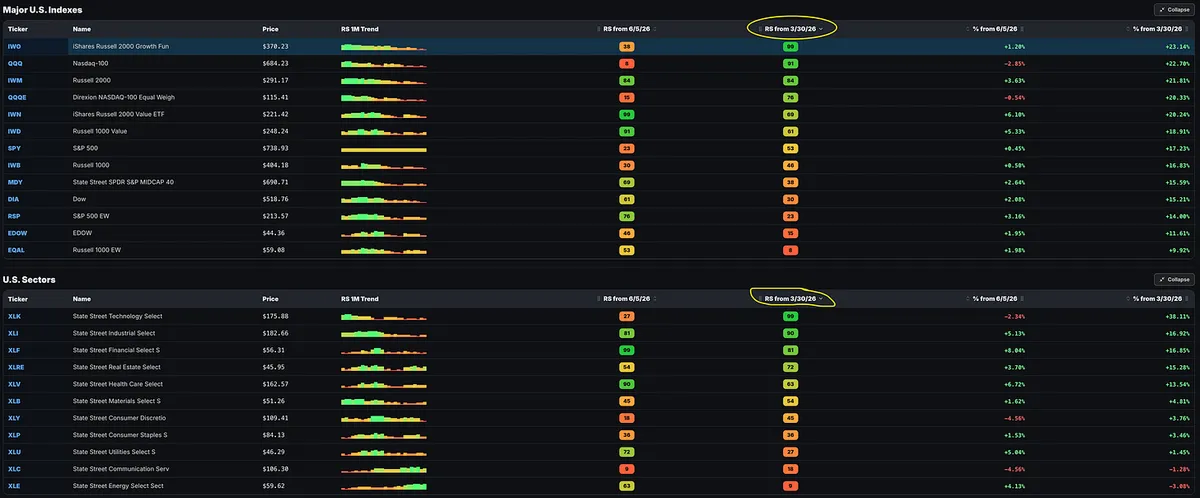
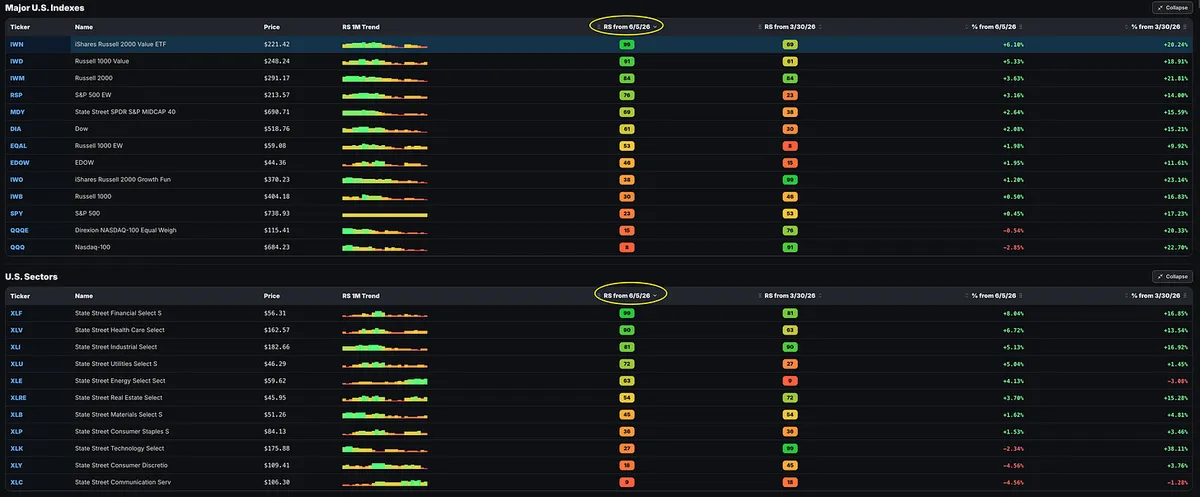
That is why I added custom relative strength lookback periods to the MTS Trading Software Relative Strength Dashboard and Stock Scanner.

For example, the current uptrend began near the March 30 lows. From that point, leadership was dominated by growth, technology, semiconductors, software, and AI-related names.

But the market changed on June 5, when the Nasdaq gapped down and fell roughly 4%.

When we measure relative strength from that exact date, we see a completely different market.

Russell 2000 Value, Russell 1000 Value, equal-weight indexes, and midcaps have moved to the top.

Financials, healthcare, and industrials have led at the sector level.

Pharmaceuticals, insurance, biotech, banks, oil and gas, and real estate have led among industry groups.

The old leaders can still appear strong over longer default timeframes because of gains made earlier in the advance.

Custom lookbacks let you answer a more important question:

What has been leading since the market actually changed?

View on Substack ↗

The Market Is Warning You. Are You Still Scanning Like Nothing Changed?

Before you start screening for individual stocks this weekend, answer a few questions.

  • Is the market getting stronger or weaker?

  • Is participation expanding or shrinking?

  • Are growth stocks breaking out and following through, or are more setups failing?

  • Is institutional buying increasing, or does distribution remain elevated?

Because the evidence weakened again this week.

Distribution remains elevated on the Nasdaq.

Breadth has now deteriorated for three consecutive weeks.

Up/down volume continues to weaken week over week.

For the first time during this pullback, Nasdaq 52-week lows outpaced 52-week highs on a weekly basis.

The major indexes are below their short-term and intermediate-term moving averages.

Most importantly for growth traders, individual growth stocks continue to struggle.

You can have the best screener in the world.

But none of that changes the environment in which you are placing the trade.

Professional traders from all timeframes study the big picture before deciding how aggressively to trade.

So why would you begin building your watchlist before understanding whether the market is telling you to press the gas or hit the brakes?

Recognize when the odds have shifted before your account forces you to recognize it.

I broke down the full evidence, the areas of relative strength, and what needs to happen before growth traders should become aggressive again in this week’s Big Picture Market Pulse.

Read the full article here:

https://tradingmomentum.substack.com/p/the-market-is-warning-you-again-dont

Zoom out before you zoom in.

On SubstackBig Picture Market Pulse | July 26, 2026: The Market Is Warning You Again. Don’t Ignore It.
View on Substack ↗

Why Great Traders Can Be Bullish and Bearish at the Same Time

One of the most confusing yet surprisingly simple concepts for new traders is hearing one person say they are buying the S&P 500 while another says they are shorting it.

Even more confusing?

Sometimes the same trader is doing both.

No, they are not necessarily hedging.

They are trading different timeframes.

A long-term investor or position trader may believe the S&P 500 remains in a cyclical or secular bull market and continue adding to long-term investments.

At the exact same time, that trader may short the market as a swing trade because a correction is unfolding over the next few days or weeks.

Just look at the chart of any long-term bull market. You will find several meaningful corrections along the way.

Both trades can be profitable because they are answering two completely different questions.

Long-term: Where is the market likely headed over the next 6 to 24 months?

Short-term: What is the highest-probability move over the next few days or weeks?

These are not contradictions.

They are simply different lenses.

Even among investors, timeframes can vary dramatically.

One investor may be buying during a cyclical bear market because they believe the secular bull market remains intact and their outlook is 10 to 20 years.

Another investor may be selling the exact same market because their timeframe is only three to five years.

Both decisions can make sense.

The same is true even among swing traders.

One trader may be long based on a setup expected to play out over the next four to six weeks, while another is shorting a pullback expected to last only three to five days.

Both can be right.

Both can make money.

This is where beginners often get lost.

They hear opinions from investors, position traders, swing traders, and day traders and assume everyone is talking about the same move.

They are not.

Before accepting or rejecting anyone’s market opinion, ask one simple question:

“What timeframe are they talking about?”

Once you understand that, many of the apparent contradictions in the market disappear.

The market can be bullish on one timeframe and bearish on another.

Great traders understand the difference.

View on Substack ↗

The Market Doesn’t Care About Your Favorite Indicator

One of the biggest mistakes I see traders make is becoming overly bullish or bearish based on a single market indicator.

The truth is, no indicator deserves that much authority.

That is why, in the Big Picture Market Pulse, I don’t rely on one statistic. I look at dozens of market indicators, but I let the weight of the evidence tell the story.

For example, the Advance/Decline Ratio can be below 1.0, yet growth stocks can still be producing excellent opportunities. William O’Neil pointed out that a market advance can be led by a relatively small group of exceptional stocks. As growth investors, we don’t need every stock to participate. We need the right stocks to participate.

The opposite can also be true.

Recently, Net New Highs have remained positive, but many growth stocks have struggled. Why? Because much of those new highs have come from areas outside of traditional growth leadership. Looking at Net New Highs alone could have led you to believe conditions were healthier for growth stocks than they actually were.

The same applies to the percentage of stocks above their key moving averages. The market can have healthy participation on a broad basis while leadership rotates away from the areas you actually trade.

This is why I never interpret any market indicator in isolation.

Instead, I constantly compare them against one another and, more importantly, against the actual price action.

At the end of the day, the major indexes and the behavior of the leading stocks carry more weight than any individual breadth statistic. If the leaders are breaking out, acting well, respecting support, and producing follow-through, that matters far more than whether one indicator is flashing green or red.

Indicators provide context.

Price action provides the verdict.

That philosophy isn’t unique to me. It’s the same evidence-based approach William O’Neil built into CAN SLIM and Investor’s Business Daily: use multiple pieces of evidence, but let the market itself have the final say.

View on Substack ↗

The Juice Isn't Always Worth the Squeeze

One of the biggest mistakes traders make is believing they always need to be trading.

Nothing works in every market environment all of the time. The key is recognizing what type of environment you're in and adapting accordingly.

Can you still find trades in difficult markets? Absolutely. There are almost always opportunities, and I've made money in environments like this before. But they're harder to find, there are fewer of them, and the probabilities are simply lower.

That's exactly why I spent this week in the Appalachian Mountains with my wife and four kids. Stepping away didn't hurt my portfolio one bit.

After a great few months, there was no reason to fight the market just to stay busy. That reminded me of an old saying:

The juice isn't always worth the squeeze.

If you took advantage of the favorable environment when the odds were in your favor, you don't need to force trades now.

Sometimes the highest-probability decision is to hold cash, protect your gains, and wait for the market to confirm a healthier environment with genuine leadership.

The market will still be there.