Momentum Trading Strategy

Notes

Market Conditions

Reading the overall market and deciding how aggressive to be.

Showing 61–80 of 227 notes

View on Substack ↗

Leadership changes before most traders notice.

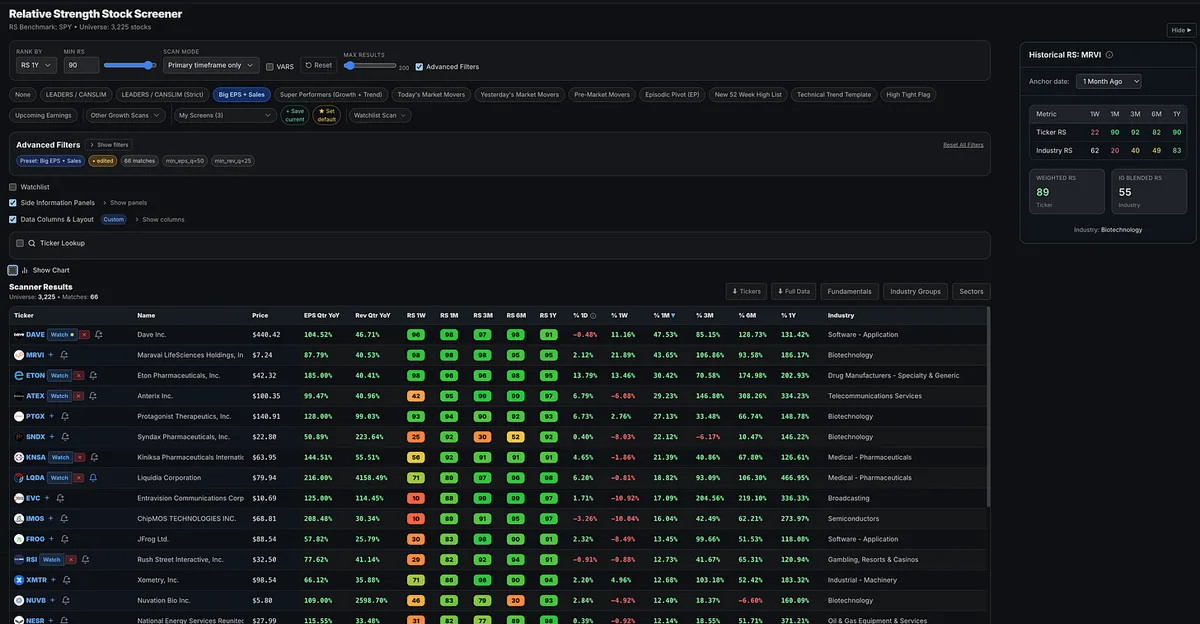
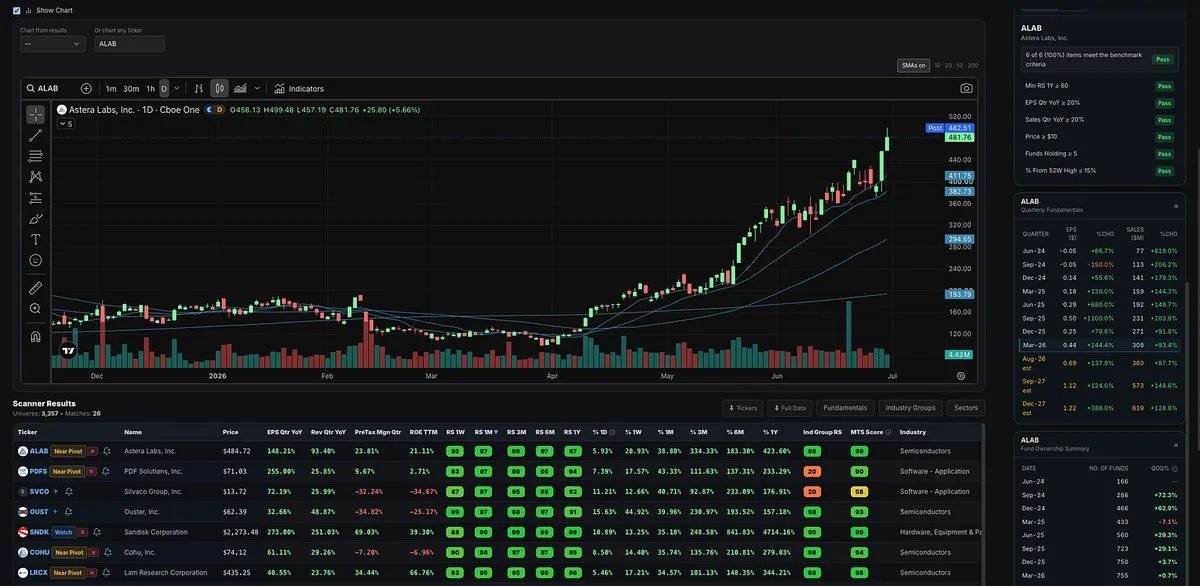
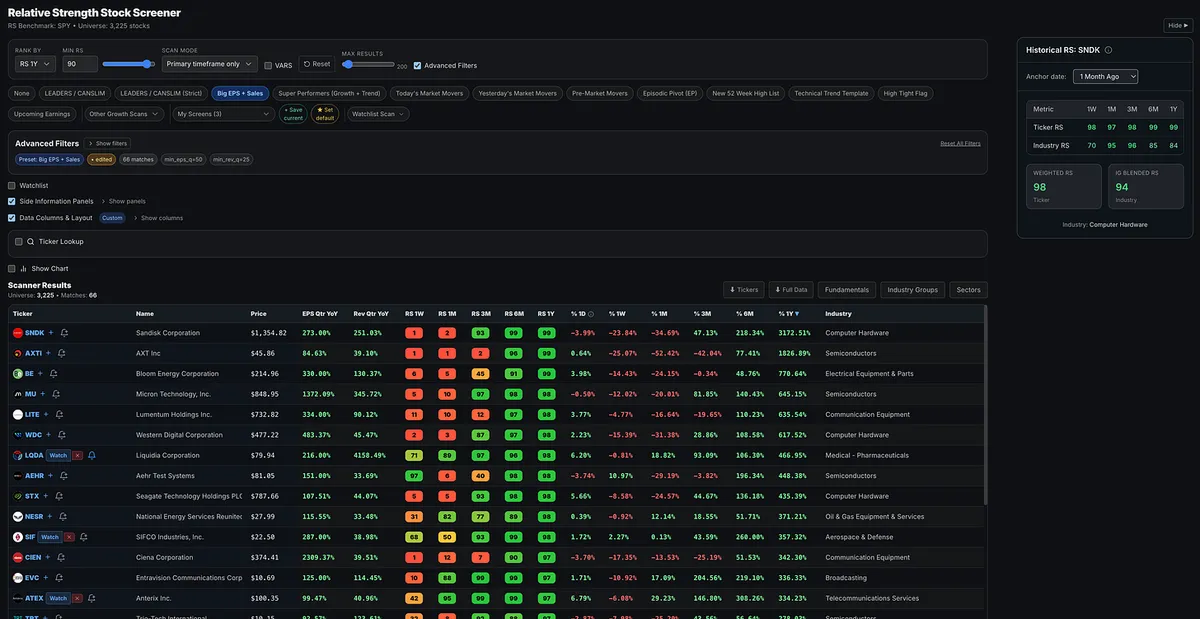
Run the Big Earnings and Big Sales screen, then compare one-year relative strength with one-month relative strength.

The shift is unmistakable.

Many of the stocks that dominated the last year still carry elite long-term RS ratings, but their short-term rankings have collapsed:

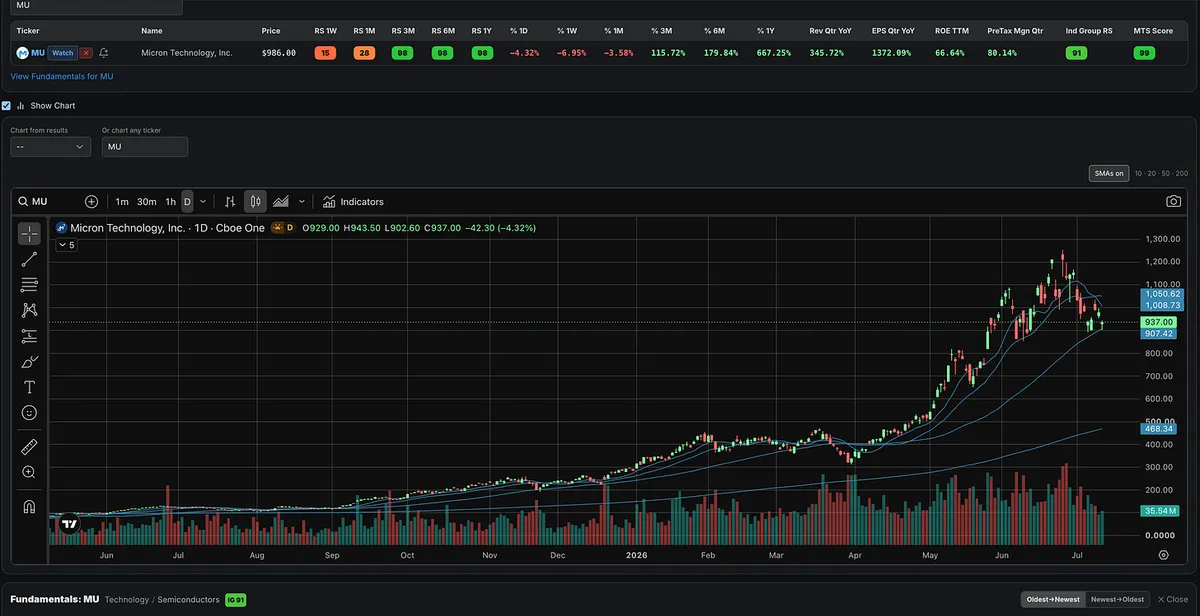
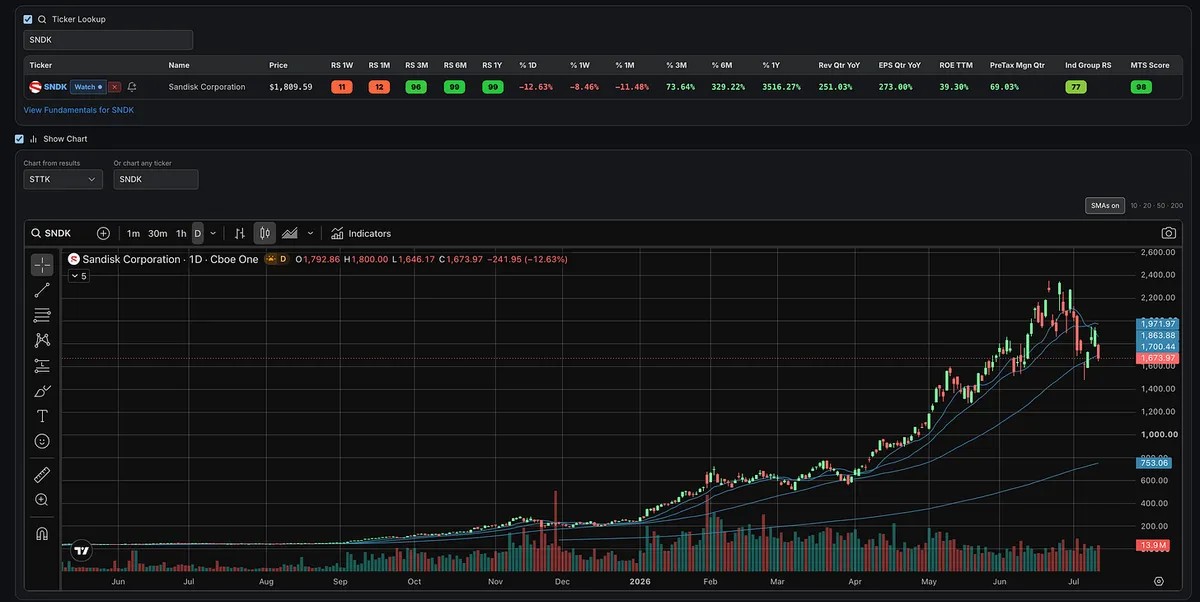
SNDK: 1yr RS = 99 / 1m RS = 2

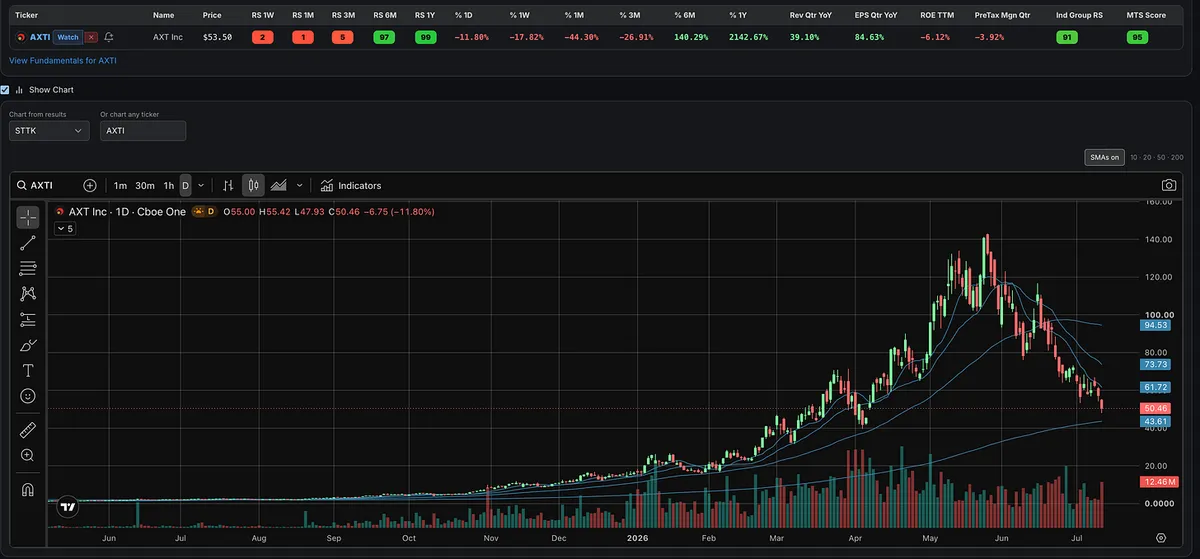
AXTI: 99 to 1

MU: 98 to 10

WDC: 98 to 3

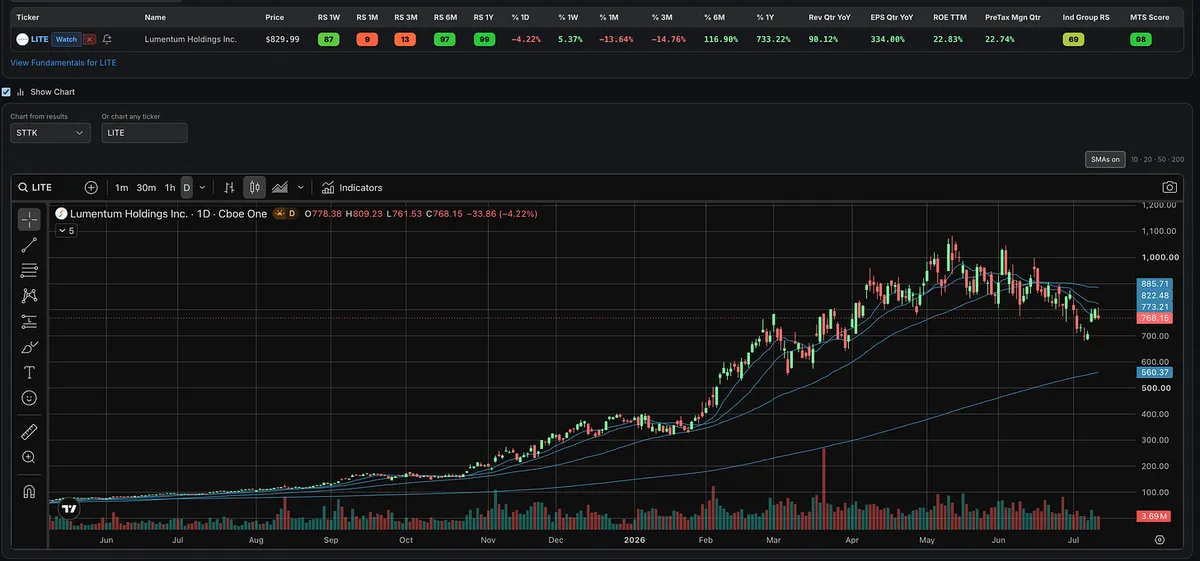
LITE: 98 to 10

CIEN: 97 to 12

At the same time, biotechnology, pharmaceuticals, software, and other emerging groups are moving toward the top of the screen.

That is what leadership rotation looks like in real time.

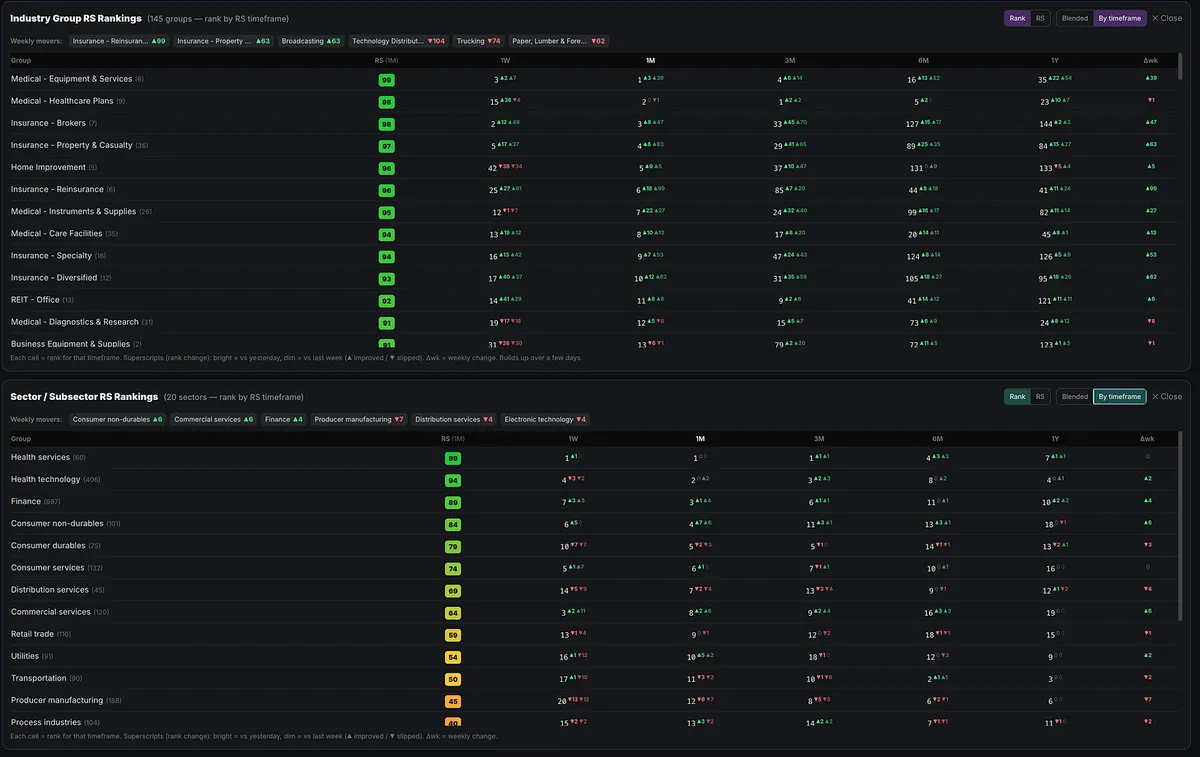
The market doesn’t send a memo. It leaves clues in relative strength, and industry-group rankings.

View on Substack ↗

Before you zoom in on individual stocks, zoom out on the market.

There is a reason William O’Neil put the M in CAN SLIM.

There is also a reason traders as different as Paul Tudor Jones, Bruce Kovner, Michael Marcus, David Ryan, and Marty Schwartz studied, followed, or deeply respected Martin Zweig’s work.

Even the best short-term traders understood that individual setups do not exist in a vacuum.

Market direction and Industry-group leadership matters. Liquidity, rates, breadth, momentum, and institutional behavior matter.

O’Neil emphasized buying leading stocks in leading groups. Nicholas Darvas understood the same principle decades earlier.

So before opening the stock screener and planning this week’s trades, take a few minutes to study the bigger picture.

This week’s Big Picture Market Pulse examines the major destruction across former leading growth stocks and industry groups, the rotation in the indexes, and the impact on growth stock investors and momentum traders.

Zoom out before you zoom in.

https://tradingmomentum.substack.com/p/major-destruction-across-leading

On SubstackBig Picture Market Pulse | July 19, 2026: Major Destruction Across Leading Industry Groups and Growth Stocks
View on Substack ↗

Why Some Traders Panic During Market Pullbacks

If you are freaking out during market pullbacks, corrections, or bear markets, or constantly trying to force trades to work in those environments, it may be because you missed the market move when conditions were actually good.

I have written and talked about this several times.

The market climbs a wall of worry.

The best opportunities often appear while most people are still nervous, skeptical, or waiting for everything to feel safe.

By the time everyone finally starts getting bullish, the trend is often much closer to the end than the beginning.

If you participated in April and May into early June, you should not care much about what the market is doing right now.

You participated when conditions were favorable. Now you can protect your gains, reduce exposure, and patiently wait for the next proper opportunity.

As growth stock investors, we are trend followers.

We are not trying to buy the exact bottom, sell the exact top, or predict every market turn.

We are trying to capture the middle meat of the move, which is often the most profitable portion.

That may sound like we are simply following everyone else, but we are not.

Most people do not participate when they should.

They hesitate while conditions are improving, finally become confident after the move is obvious, and then begin forcing trades because they feel like they missed out.

The answer is not to chase harder.

Participate when conditions are favorable.

Protect your capital when they deteriorate.

Then remain patient until the market gives you another proper opportunity.

View on Substack ↗

What Leader Is Still Standing?

The market looks ugly, but the individual stock scans may look even worse.

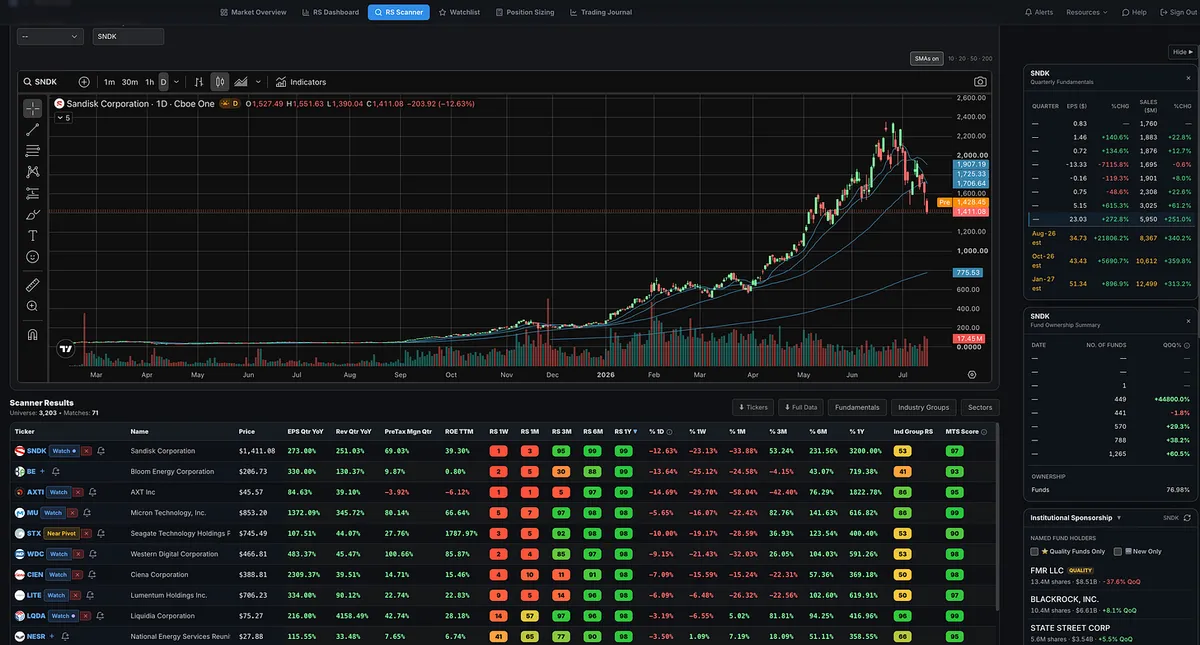
Many of the leading stocks from the past year have suffered meaningful technical breakdowns. With SNDK now confirming its breakdown below the 50-day moving average, it joins MU, STX, WDC, and a growing list of former leaders that have lost important support.

Since the market set its low on March 30 and began a new Stage 2 uptrend, which leaders are actually still standing?

Post a chart of a leading stock in a leading industry group that has not suffered a meaningful technical breakdown. Let’s see which former leaders are still holding up, if there are any.

View on Substack ↗

The Longer You Trade, the Less You Trade

The longer you trade, the more you may notice that you trade less.

This may not apply to everyone, but many highly experienced traders will tell you the same thing. As you gain experience and trading wisdom, you become more selective, not only about the stocks you trade, but also about when your strategy works best.

You stop trying to force trades during unfavorable periods. You begin to recognize the market environments where your setups have the greatest edge, and you become more comfortable sitting on your hands when those conditions are missing.

The interesting part is that even with less activity, you may make just as much, if not more, while taking fewer trades.

Beginners often believe they need to be constantly active. They either do not yet understand when their strategy works best, or they keep trying to force it during less desirable market conditions.

So how do you learn when you trade best?

Track your data.

Study how your results change across different market environments. Look at when your setups perform well, when they struggle, and when you should reduce exposure or stay out completely.

This is closely related to what Dr. Van Tharp taught when he described six different market types. It is unrealistic to expect one trading strategy to work equally well in every market environment.

The goal is not to trade more.

The goal is to trade when your edge is actually present.

View on Substack ↗

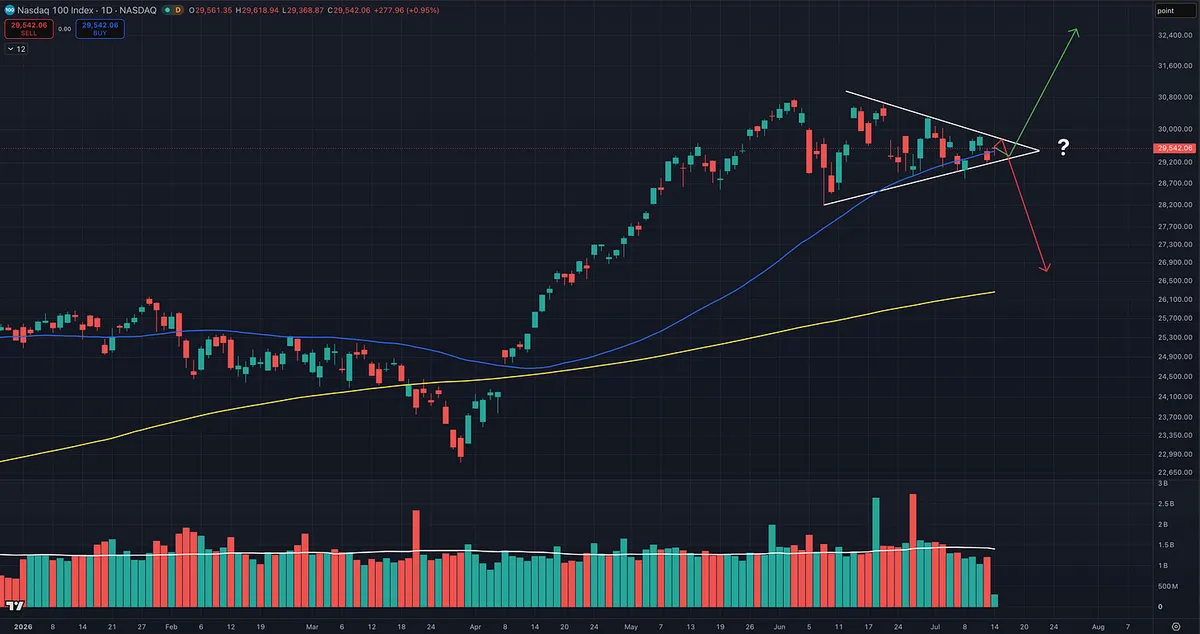
Place Your Bets: Which Way Does the Nasdaq 100 Break?

Let’s have a little fun. I know trying to predict market direction like this doesn’t really matter, but let’s make a call anyway.

The Nasdaq 100 is coiling into a tight pennant, and it looks like we’re about to get an answer soon.

Breakout or breakdown?

Place your bets.

Which way does the Nasdaq 100 break from this pennant?

  • Higher

  • Lower

PollHigher · LowerVote on Substack →
View on Substack ↗

Nothing Lasts Forever. Don’t Fall in Love With Any Stock.

Some of the market’s biggest winners over the past year have now broken down. At least for the moment, their runs appear to be over.

AXTI delivered enormous gains over the last year, but it has now fallen below its 50-day moving average and is heading toward the 200-day. Its 10-day and 20-day lines are declining, and the 50-day is beginning to roll over.

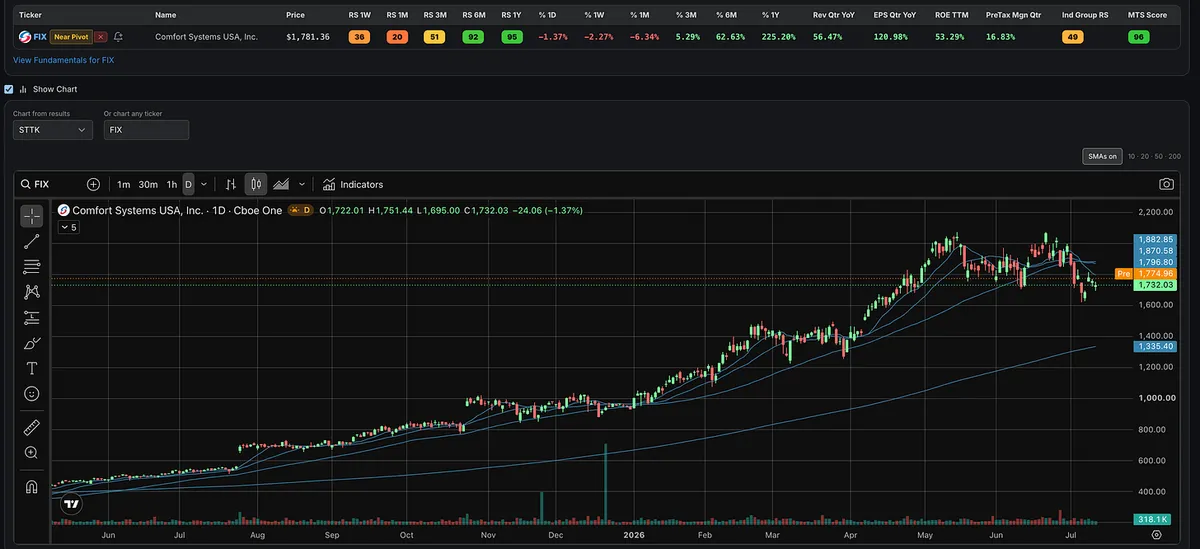
LITE, CIEN, VICR, AAOI, VIAV, TTMI, FIX, COHR, and several other former leaders have also broken down or suffered significant technical damage.

Many more are sitting in the danger zone near their 50-day moving averages. That includes the memory names SNDK, WDC, STX, and MU, along with other hot names from hot groups VPG, MBIS, MXL, LSCC, MRVL, TER, VSH, STM, ADI, INTC, TSM, LRCX, COHU, PDFS, and others.

The bottom line is that many of the stocks that have driven this market, particularly the memory, semiconductor, and telecom names, have either already broken down or are now testing a critical area around their 50-day lines.

I have not needed to share many new tickers from week to week because the same names I have discussed throughout the year continued to lead. There was no reason to constantly search for something new when the existing leaders were still working.

But nothing lasts forever.

Many of the stocks that worked all year are now either ending their runs or approaching a decisive point. Do not fall in love with any stock. Respect the price action and let the market tell you whether the trend is still intact.

View on Substack ↗

When the Screens Go Cold, Hit the Books

You can always find something moving in any market, but the quality of what is showing up on my screens has changed significantly from April, May, and even early June.

When you run the same screens every day, you can see the change in real time. The number of high-quality growth setups has narrowed, and the overall opportunity set is simply less attractive.

That does not mean there is nothing to trade. Some traders will always find something. For me, though, this is usually a signal to reduce activity, step back, study, refine my watch lists, and relax until the individual stocks on my screens begin improving again.

Time to hit the beach and hit the books.

View on Substack ↗

You Can Have 20 Years of Trading Experience and Still Be Blind to Market History

You can have 15 or 20 years of trading experience and still have spent your entire career inside one secular bull market.

You did not trade through 2008. You did not trade the dot-com collapse. You did not experience many of the bubbles, crashes, and violent market periods that came before.

That should humble every trader.

Even I almost fell for the idea that today’s leaders, with their huge price moves and high ADRs, were somehow different from the past.

They are not.

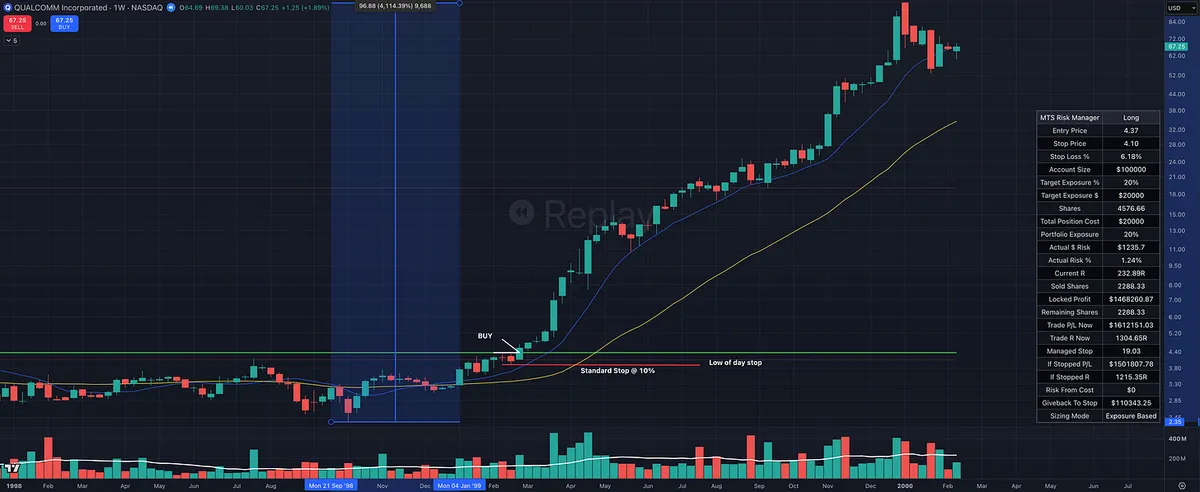
Pull up Qualcomm from 1999 and early 2000. The volatility was just as extreme, if not more.

That is why William O’Neil’s work remains so foundational.

The tickers change. The market does not, because human nature does not.

View on Substack ↗

What’s More Important: The Stock or the Market?

Should you study the market...

Or should you study individual stocks?

You've probably heard both arguments.

"If the market is weak, don't fight it. Most stocks will go down."

True.

But you've also heard this:

"The leading stocks will often break down before the indexes do, and they'll often recover before the indexes confirm a new uptrend."

Also true.

So which one should you focus on?

Both!

Because this isn't an either/or decision.

Think about it.

The market indexes are nothing more than collections of individual stocks. If enough leading stocks begin breaking down, eventually the indexes will reflect it.

But the opposite is also true.

Even the strongest stock with outstanding fundamentals, accelerating earnings, and excellent price action will often struggle if the overall market and its industry group come under heavy selling pressure.

It's the trading version of the classic question:

What came first, the chicken or the egg?

There isn't a useful answer because they're connected.

That's exactly why William O'Neil included the M (Market Direction) in CAN SLIM.

  • Study the market.

  • Study the industry groups.

  • Study the leading stocks.

Each tells you something the others cannot.

The market tells you whether the tide is rising or falling.

The industry groups tell you where the money is moving.

The leading stocks tell you where institutions are placing their biggest bets.

And remember, while the indexes are made up of individual stocks, they don't always tell the whole story.

Sometimes a handful of mega-cap leaders can carry the indexes higher while most stocks quietly struggle. We saw exactly that during parts of 2023 with the Magnificent Seven.

Other times, the leading stocks that carried the market higher start breaking down before the indexes show real damage.

The surface can still look fine for a while.

But underneath, leadership is already changing.

That is often one of the first warnings that the market is weakening.

That's why serious traders don't just watch the indexes.

They watch what's happening beneath the surface too.

Because when you understand the market, the industry groups, and the individual stocks driving them, you see a much more complete picture.

You're seeing the market as it's actually unfolding.

There is no shortcut.

You have to study the market, the groups, and the stocks.

View on Substack ↗

America Is Still the Trade

O’Neil’s entire investing philosophy was built around the idea that America’s greatest stock market winners came from innovation, entrepreneurship, new industries, new products, and people willing to take risk.

He believed that for decades.

Warren Buffett has consistently believed it too.

And that is what I think is so important.

You are talking about two completely different types of investors.

O’Neil was a growth stock investor who studied America’s biggest winning stocks, new industries, new products, institutional demand, earnings growth, relative strength, and price action.

Buffett is a value investor who built his career around buying great businesses and holding them for the long term.

Different styles.

Different systems.

But both men understood the same bigger truth:

America still produces opportunity.

And I believe they were both right.

That belief in American business, American innovation, and American entrepreneurship still matters today.

From railroads to autos, from airplanes to computers, from semiconductors to the internet, and now into AI, robotics, software, energy, medical technology, and whatever comes next, America has continued to create massive opportunities for investors and entrepreneurs.

That does not mean America has no problems.

Of course it has problems.

Debt is a problem. Taxes are a problem. Political dysfunction is a problem. Inflation, regulation, division, and constant fear are all real issues.

But as traders and investors, we cannot let politics, emotion, or personal beliefs get in the way of making money.

I am looking at this the same way I look at stocks.

  • Where is the leadership?

  • Where is the relative strength?

  • Where is the innovation?

  • Where are the biggest winners still being created?

For those of you reading this outside the United States, this is not a political statement or some “America is better than everyone else” speech.

This is about capital allocation.

If I lived in another country, I would still want my capital invested wherever I believed the best risk/reward opportunity existed. If another market became the best place to invest, I would invest there too.

But for now, the long-term trend is still clear.

America is still the place where many of the world’s biggest companies, biggest innovations, and biggest wealth-building opportunities are being created.

This is the same lesson I teach with individual stocks.

Follow the trend.

Do not argue with the market.

Do not let your opinions get in the way of what is actually happening.

“The trend is your friend until it ends when it bends.”

- Ed Seykota

And right now, betting against American innovation, American business, and American entrepreneurship still looks like a lower-probability bet to me.

The American dream may look different than it used to.

It may be harder for some people than it should be.

But American opportunity is still alive.

The question is whether you are going to complain about the problems or position yourself to benefit from the opportunities that still exist.

View on Substack ↗

The Weekend Is Over. Find the Strength Before the Open.

Time to get to work.

Before diving into individual stock screening, you need to know two things:

Where is strength actually showing up?

And what type of market environment are we in?

This week’s Big Picture Market Pulse breaks down the rotation that’s happening.

Growth and technology have cooled.

Value, health care, biotech, financials, industrials, and several forgotten areas are showing relative strength.

The bull market is still alive, but leadership has changed.

Before building your watchlist for the week, understand where money is flowing and where leadership is fading.

That is exactly what this week’s report covers.

https://tradingmomentum.substack.com/p/a-tale-of-two-tapes-growth-stocks

On SubstackBig Picture Market Pulse | July 5, 2026: A Tale of Two Tapes: Growth Stocks Cool While the Bull Market Rotates
View on Substack ↗

A Tale of Two Markets

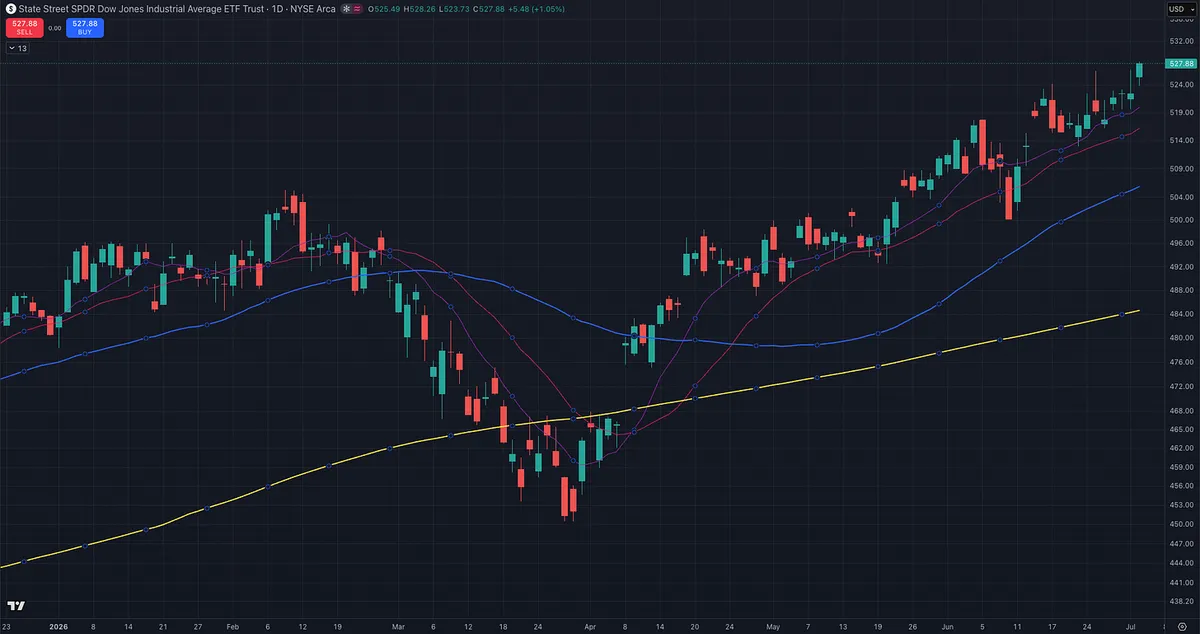
We definitely have two different tapes happening at the same time.

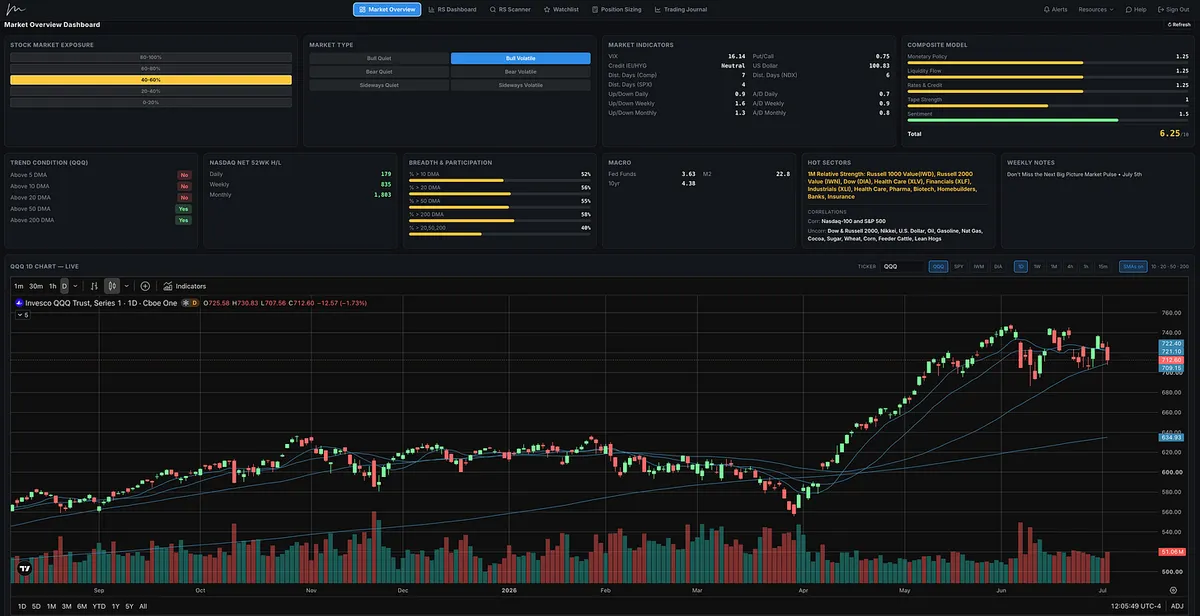
The Dow pushed to all-time highs yesterday, while the Nasdaq-100 dropped about 1.6% and moved back down toward the 50-day.

That is the story right now.

Under the surface, leadership has changed.

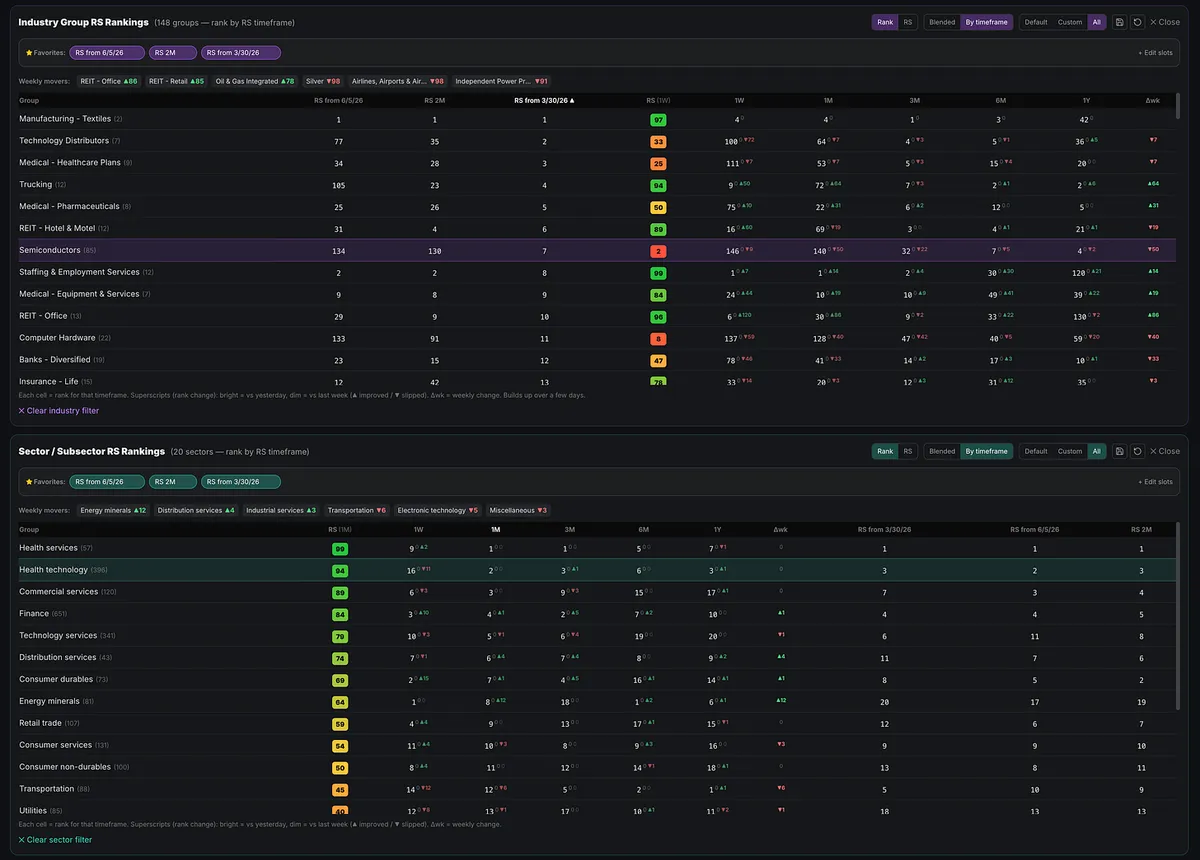
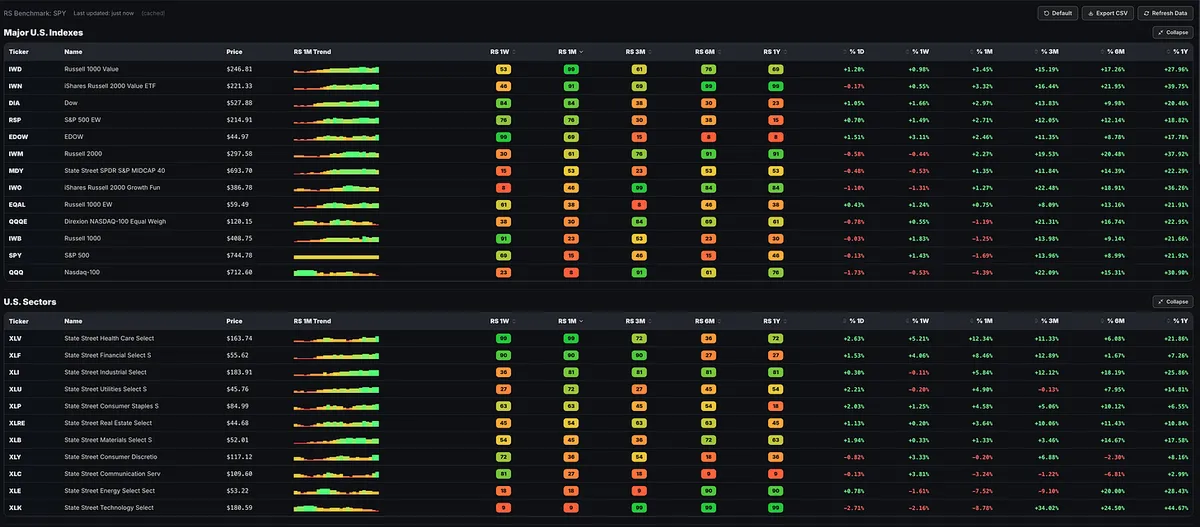
Over the last month, the strongest major indexes have been the Russell 1000 Value, Russell 2000 Value, and the Dow. The leading sectors have been healthcare, financials, and industrials.

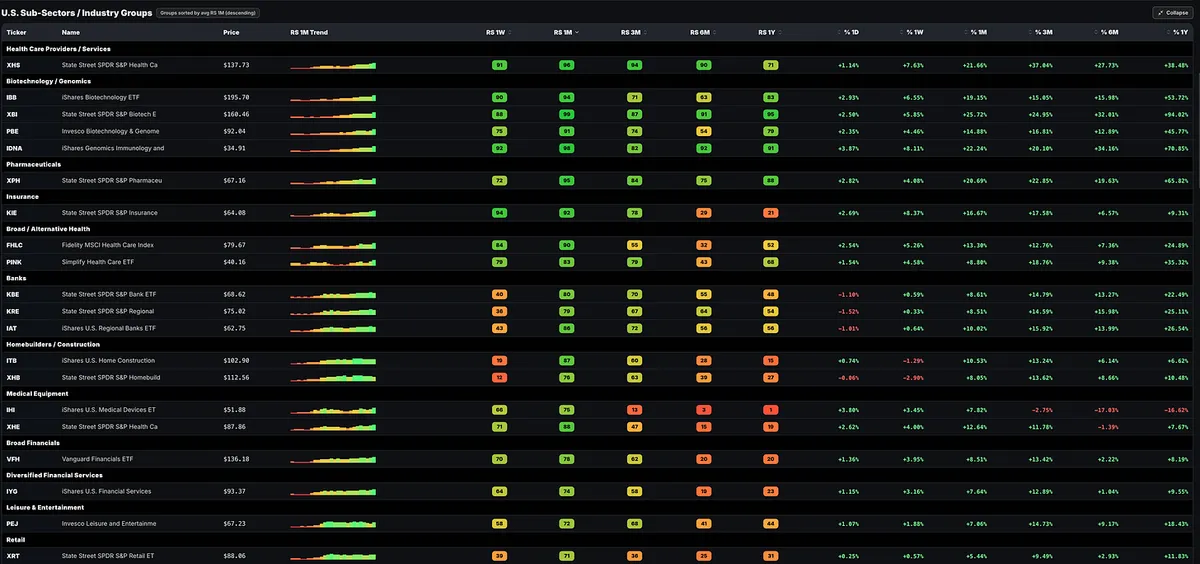
When you look at the sub-sectors and industry groups, the strength is showing up in areas like biotech, pharmaceuticals, insurance, banks, homebuilders, medical equipment, and healthcare services.

That is a very different tape than the one we saw off the lows into early June, when technology, semiconductors, cybersecurity, software, and computer hardware were leading the market higher.

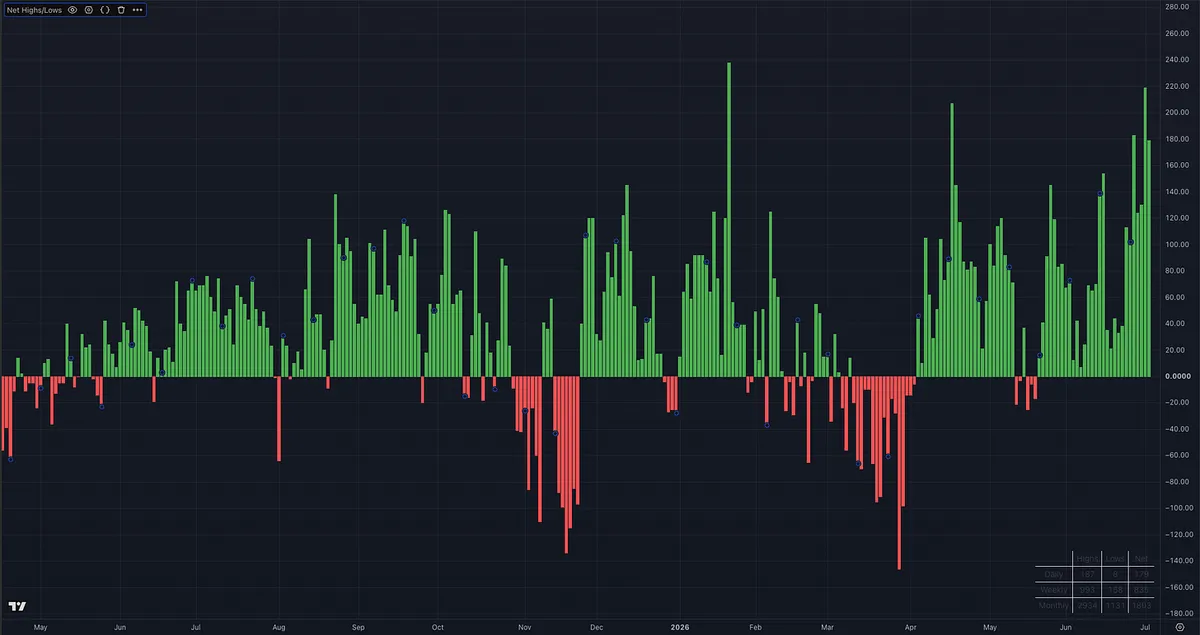
The rotation is not just an opinion either. You can see it in the new highs versus new lows data.

Over the last five trading days, we had 835 more new highs than new lows. Over the last month, that number is over 1,800. That is one of the strongest readings we have seen since the March lows!

Bottom line: the market is not dead.

Leadership is rotating.

The areas that sat out while tech and semiconductors made a massive move are now starting to participate. Under the surface, there is still a lot of strength, but it is showing up in different places.

This is why only watching one index, or only watching your own individual stocks, can be misleading.

Each weekend, when the market is closed, we zoom out and review the bigger picture. That is also why Module 3 of the Momentum Trading Strategy Course focuses heavily on market environment, sector rotation, relative strength, and top-down analysis.

Nothing is perfect in trading, but you are far more likely to catch changes in trend when you combine both top-down and bottom-up analysis.

Individual stock performance tells us a lot.

But so does zooming out and studying the market, sectors, industry groups, breadth, leadership, and key market indicators. Enjoy the long weekend, but before the market opens on Monday, take some time to zoom out.

View on Substack ↗

Know Your Trading Environment

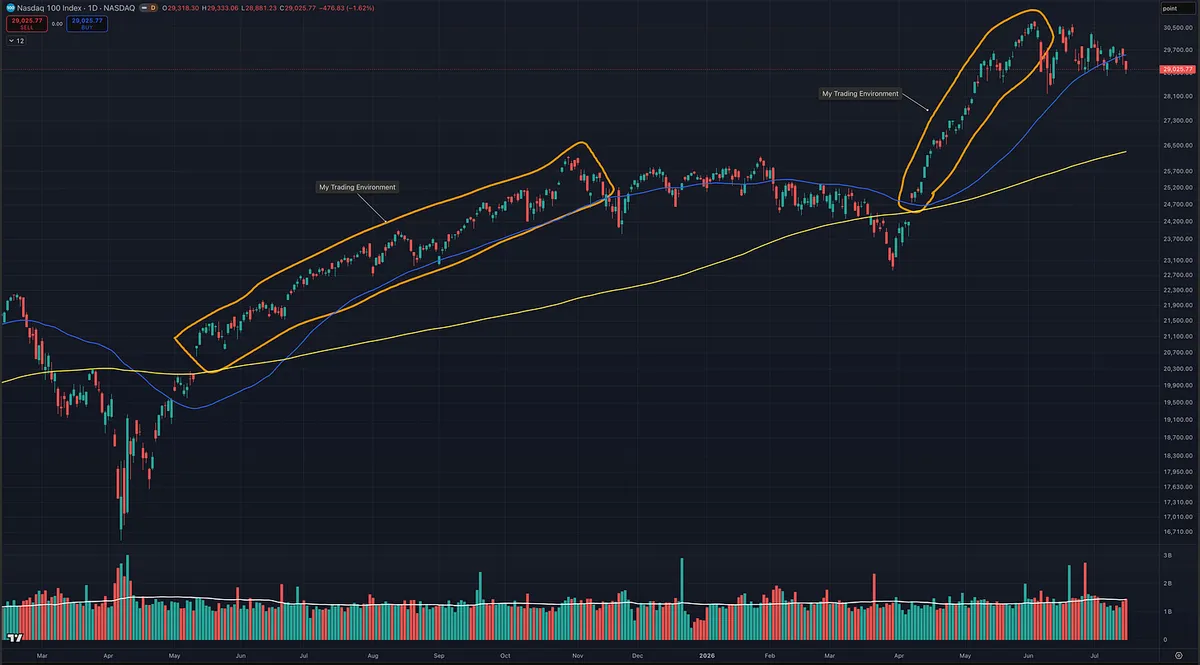
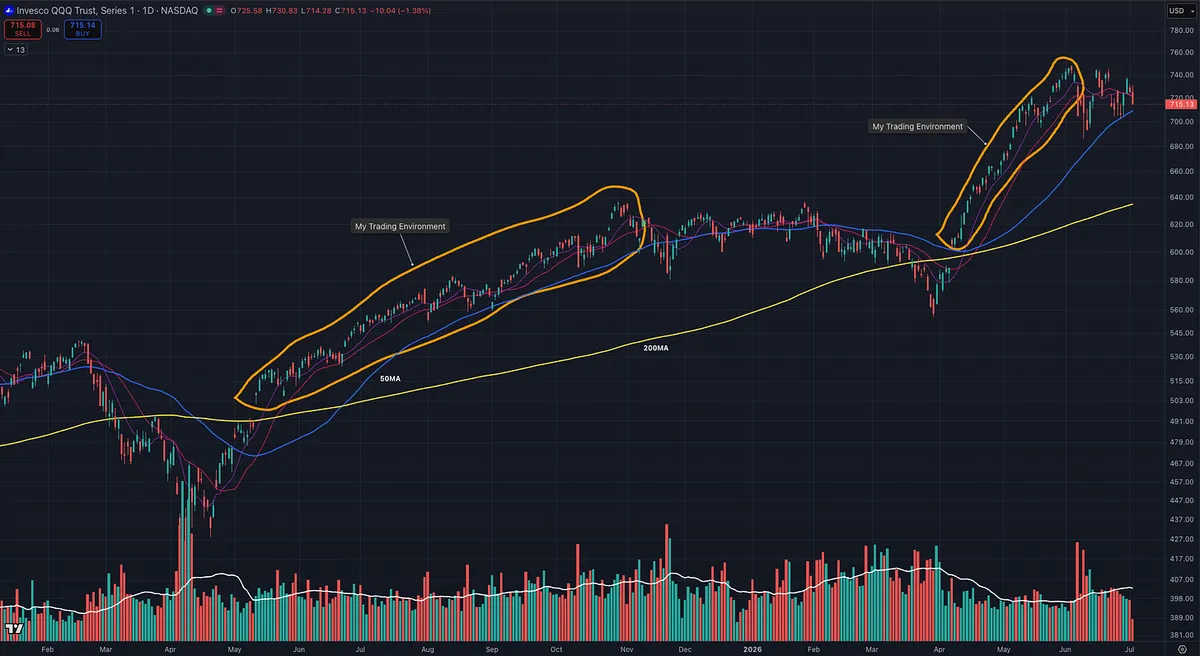
Currently, this is not my ideal type of market.

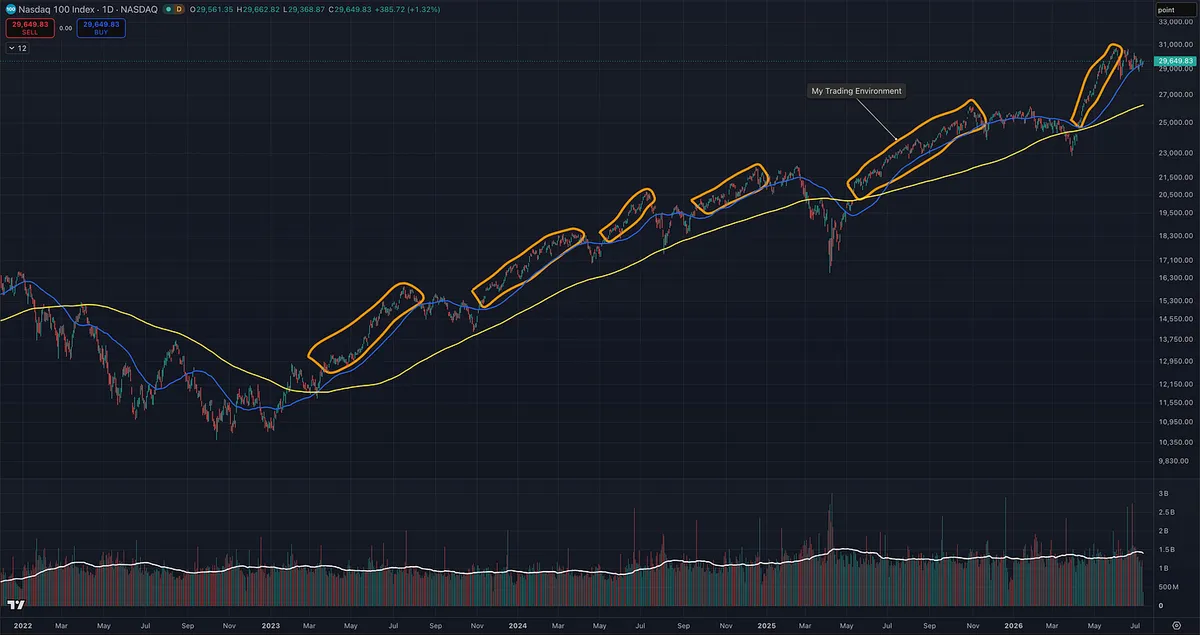
On the chart attached, I circled the type of market environment I like to see and where I tend to perform my best.

What I look for is price riding above the 10-day and 20-day moving averages, with the moving averages stacked in the right order:

10-day above the 20-day

20-day above the 50-day

50-day above the 200-day

Price should also be making a clear series of higher highs and higher lows. That is what you want to see in a strong uptrend.

When the market is riding the 10/20-day higher like that, breakouts and pullbacks tend to work much better. Individual stock setups follow through, pullbacks are more orderly, and it becomes easier to stay in positions or add to names that are already working.

But when price starts to chop, make lower highs, lower lows, or some combination of both, the environment changes. That is when I usually start to see individual stocks break down, stop acting right, or become much harder to manage from a risk standpoint.

In that type of tape, the best decision is usually to cut back, reduce new trades, lock in some profits, and only hold the strongest names that are still acting right.

Know your trading environment.

View on Substack ↗

Is the Momentum Trade Back?

I had someone ask if the momentum trade is back.

My answer is that momentum is improving again, but I would not call it fully back yet.

Today we got back above the short-term moving averages, the 10-day and 20-day, which is good. But realistically, we could still reject near the highs again like we did last week and quickly be back in the danger zone.

Since the big down day on June 5th, there has been a clear character change. The tape has been more volatile, choppy, and whippy. This is not the same easy market we had from the April follow-through day into early June.

With that being said, some select growth stocks are acting very well. Ideally, I want to see the indexes and individual leaders moving together, but many times the best stocks start to lead before the market fully confirms.

The key is this: if the market breaks out cleanly, a lot of these leaders could keep working. But if the market rolls back over, many of the names acting well right now will likely get pulled back with it.

So yes, there are opportunities again, but the environment is more difficult.

I also would not be surprised if this turns into another false rally attempt toward new highs. In this type of environment, the pros are usually moving stops to breakeven faster, keeping exposure a little lighter, and being prepared to take more small losses.

The easy environment is likely over for now. I doubt we will see the same smooth trend higher that we had from April into early June. But I could be wrong.

The way I play this is that if my individual stocks are working, I keep trading and look to increase exposure and size. If I start taking more losses, I cut back, reduce trade frequency, and reduce size.

I also try to get my stops to breakeven as quickly as possible, or I sell some into strength sooner and keep the original stop in place. That way, I have financed the risk on the trade, so I am no longer in a position where I can take a loss.

I can then afford to take more flat trades without damaging my account. Sure, the downside is smaller wins if we get follow-through, but that is okay. In these environments, I focus on protecting what I have.

Then, if the market keeps moving higher and breaks out to new highs, that helps clear overhead supply and I can look to add to my winning positions.

This is where individual stock performance determines whether momentum is truly “back again.”

View on Substack ↗

The Nasdaq Setup I’d Love to See

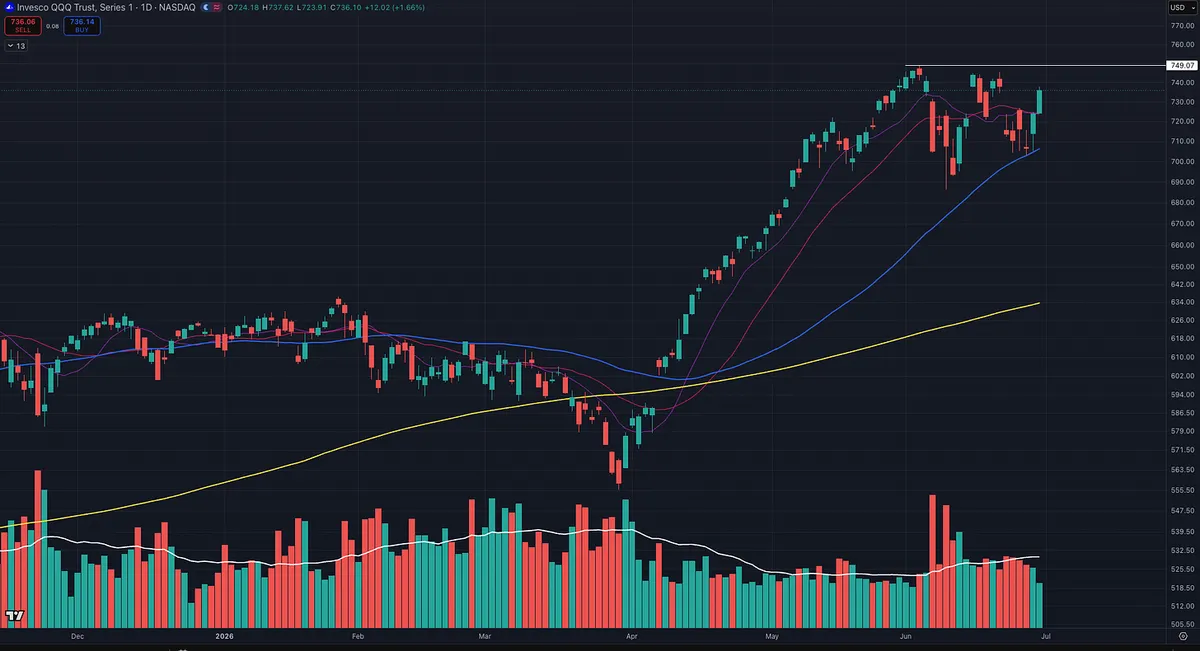
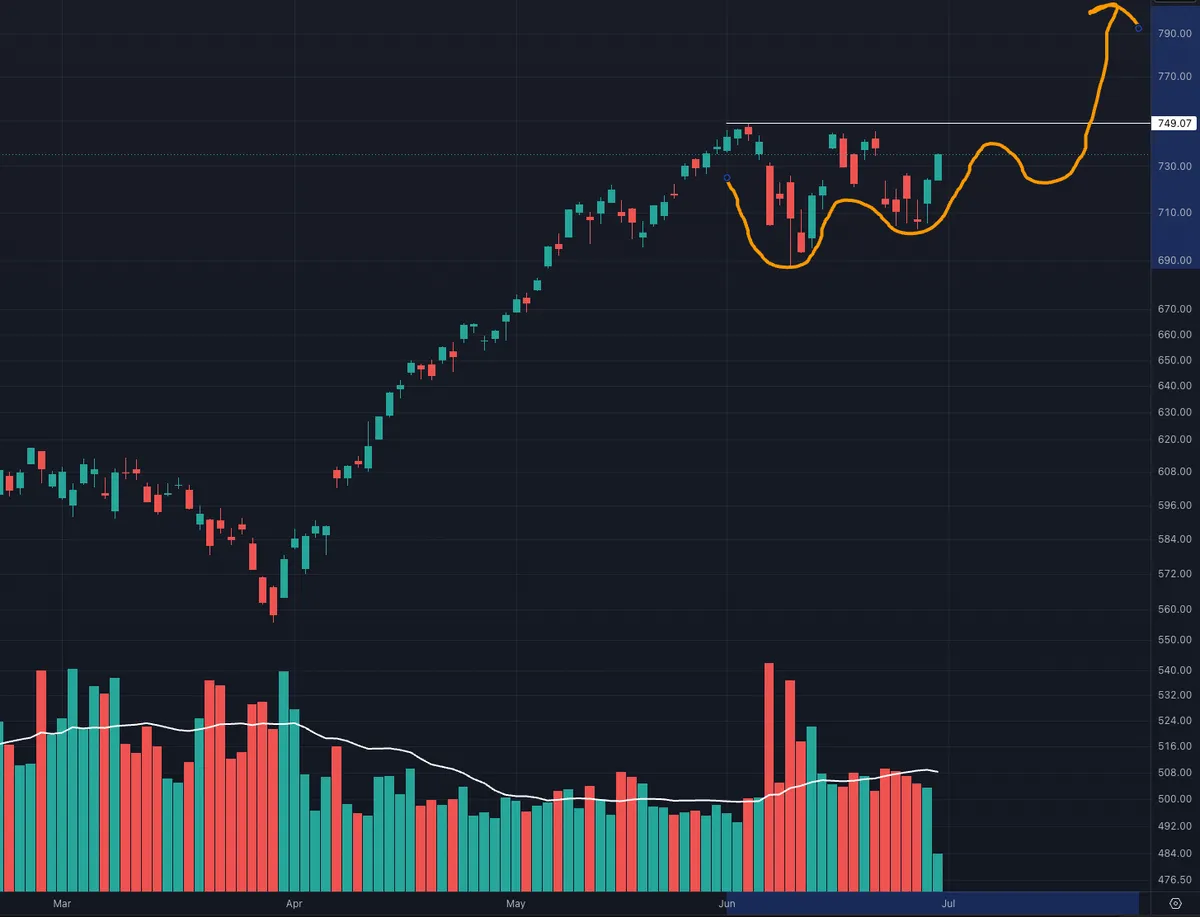
Markets will do what markets will do. With that being said, I would love to see the Nasdaq tighten up and show some VCP-type action before making its next leg higher.

The Nasdaq is now working back toward its prior highs, but the better setup, in my view, would be a little tightening on the right side before breaking out to new highs.

The best breakouts usually come after volatility contracts, selling pressure dries up, and price gets quiet near resistance. That tells you supply is being absorbed.

A few tight days, or even a short and controlled pullback near the prior high, would be great. Then, ideally, I’d like to see a powerful move through new highs on good volume.

View on Substack ↗

Rotation Beneath the Surface

Tech, AI, and many of the prior growth leaders are taking a breather after a powerful move.

But the market internals are not showing money aggressively leaving equities.

Up volume is still outpacing down volume across the daily, weekly, and monthly timeframes. Nasdaq net 52-week highs remain positive. And more than 50% of stocks are still above their 50-day and 200-day moving averages.

At the same time, relative strength is showing up in healthcare providers, pharma, biotech, homebuilders, banks, insurance, and broader financials.

If this were a major risk-off shift, we would expect down volume to take control, new lows to expand, and leadership to narrow into only classic defensive areas.

So far, that is not what the evidence is showing.

Short-term breadth has cooled, and tech is clearly digesting. But the bigger picture still looks more like rotation beneath the surface than money leaving the market in fear.

As long as the major indexes hold key support, up volume remains constructive, new highs continue to outpace new lows, and leadership keeps expanding into other groups, this looks more like a healthy pause inside an uptrend than the start of a major defensive unwind.

View on Substack ↗

Pullback or Something More?

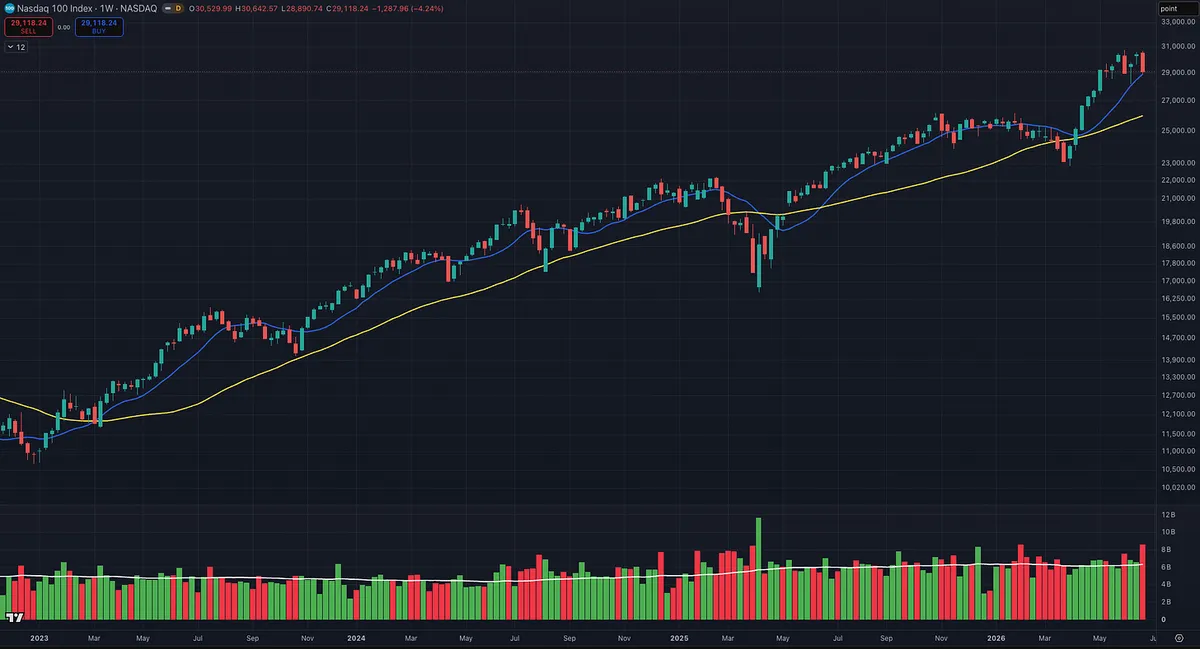
When you zoom out, we are still in a bull market and in a Stage 2 uptrend.

But after the powerful run we have had off the lows, some type of pullback, reset, or longer consolidation should not surprise anyone.

Markets do not move straight up forever.

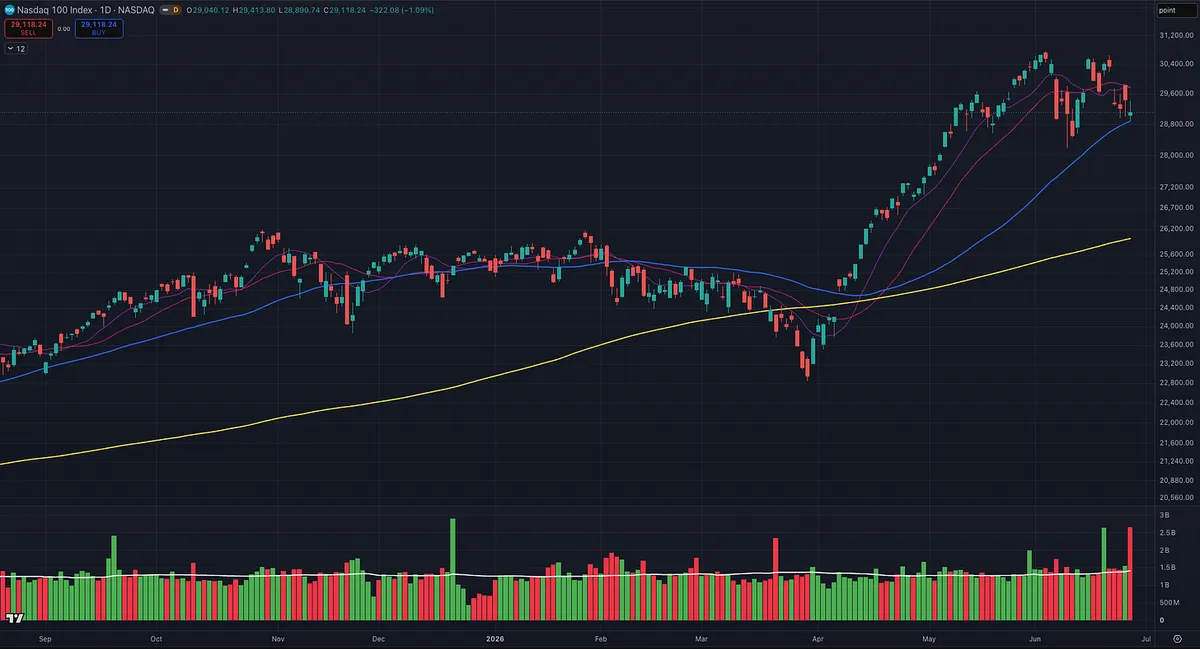
The first dip looked normal. Then price bounced, failed to reclaim the prior high, and came back down toward the rising 50-day area.

That changes the short-term read.

Now the question is whether this turns into a constructive sideways consolidation, or whether selling pressure expands into something more serious.

This is where O’Neil’s framework helps.

In a bull market, constructive pullbacks and handles tend to stay controlled. They usually remain in the 8% to 12% zone. Once price action becomes much wider, looser, and more erratic, the risk starts to increase.

So far, this still looks normal.

The longer-term trend remains intact. Price is still above the 200-day. The correction has not yet turned wide and disorderly.

But it is not an all-clear signal either.

The market still has to prove support.

  • Do sellers dry up?

  • Does price tighten up?

  • Do buyers step back in?

  • Can the Nasdaq reclaim the shorter-term moving averages?

Ideally, we could benefit from some VCP-type action from here. A few contractions, tighter price action, lighter volume on the pullbacks, and then a stronger move back through the shorter-term moving averages would be good.

But the real read is not just the index.

It is what is happening beneath the surface.

  • Are leading stocks still acting right?

  • Are breakouts working or failing?

  • Is institutional demand still showing up?

That is where O’Neil would focus.

And none of this came out of nowhere.

We have been seeing these changes take place over the last few weeks in the Big Picture work. The rotation, the change of character on June 5th, the failed bounce, and the test of key moving averages were all signs that the tape was changing.

The question is whether you were paying attention, or whether you had your head buried in the sand.

For now, I would call this a normal bull-market pullback that is trying to turn into a constructive consolidation.

The next move will tell us a lot.

View on Substack ↗

M = Market Direction

“If you’re wrong about the direction of the general market, and

that direction is down, three out of four of your stocks will plummet along

with the market averages, and you will certainly lose money big time, as

many people did in 2000 and again in 2008.” -William O’Neil

View on Substack ↗

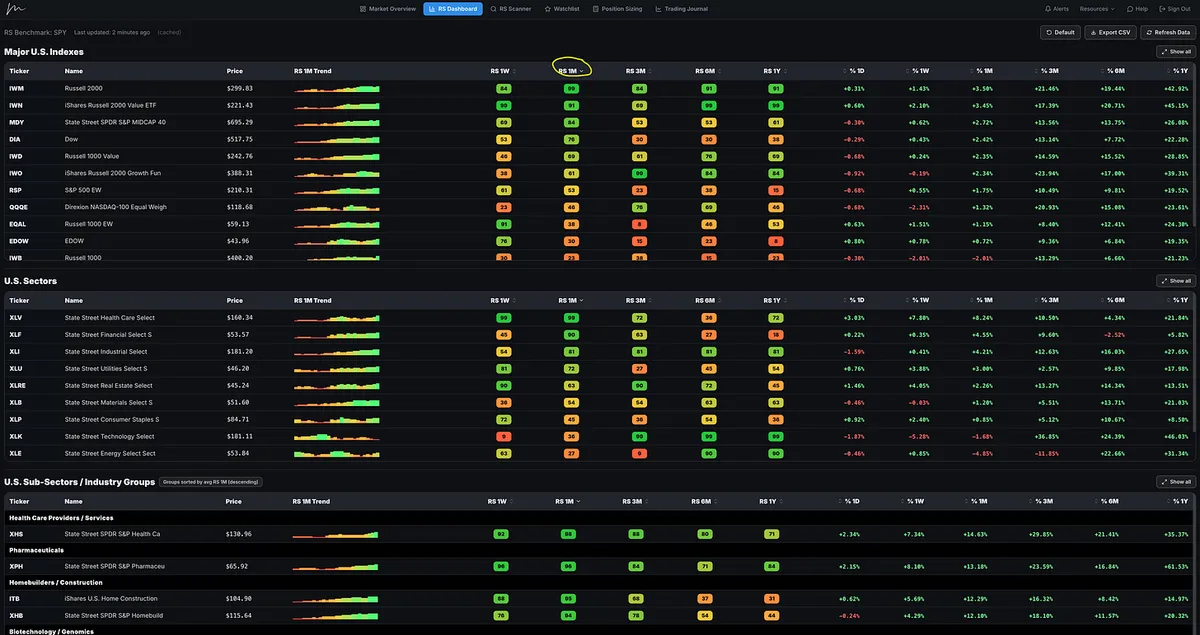
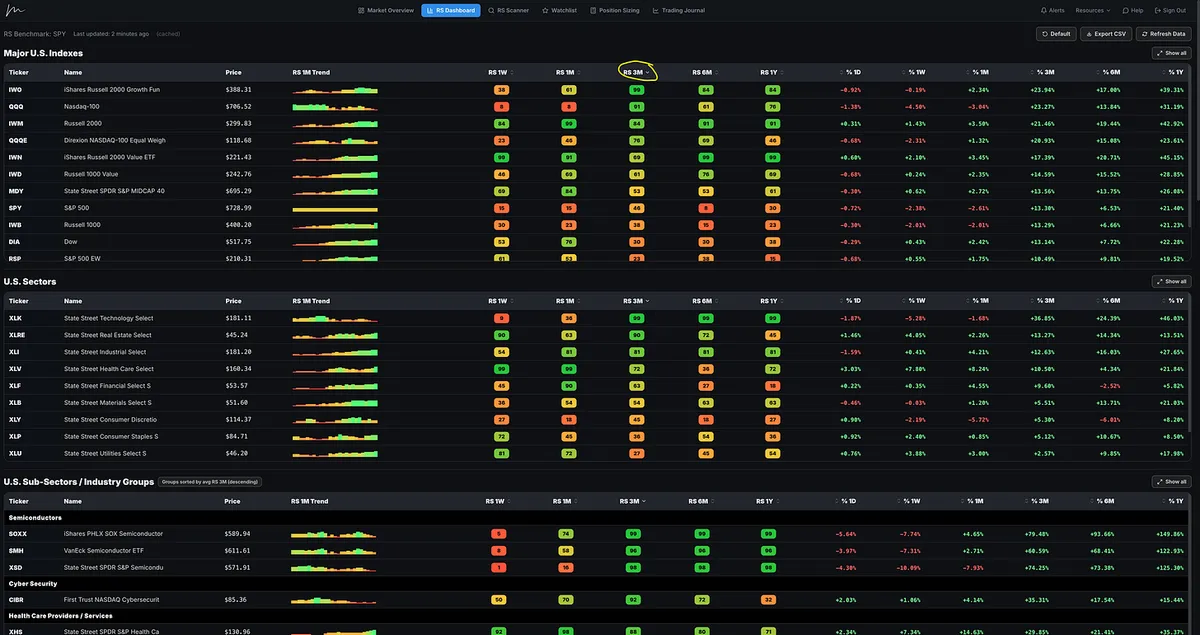
Big Shift in Relative Strength

Big change in relative strength over the last few weeks.

For weeks/months, the clear leadership across the major indexes has been the Nasdaq 100, Nasdaq 100 equal weight, Russell 2000 growth, and IWM.

Sector leadership has also been obvious: XLK technology has dominated, with semiconductors leading this Stage 2 uptrend since the March 30th lows. That strength has been followed by other tech-related groups like computer hardware, electrical equipment, software, and other growth areas.

But this week, the shift is much clearer.

Now the leadership is coming from:

• IWM, Russell 2000

• IWN, Russell 2000 Value

• MDY, S&P 400 Mid Caps

• DIA, Dow Jones

On the sector side, XLV healthcare is leading, followed by financials, industrials, and utilities.

Under the surface, the strength is showing up in healthcare providers, pharmaceuticals, homebuilders, biotech, insurance, and banks.

This has been building for a few weeks, but this week is the clearest rotation we’ve seen.

Make sure to dive into the next Big Picture Market Pulse before the market opens Monday.

It should be out soon.