
Trading articles/Stage Analysis: How to Spot Stage 3 in Real Time
Sep 25, 2026 · Momentum Trading Strategy
Stage Analysis: How to Spot Stage 3 in Real Time
Recognize a developing Stage 3 using Stan Weinstein’s framework, with real chart examples, warning signs, and lessons for protecting your gains
Originally published on Substack.
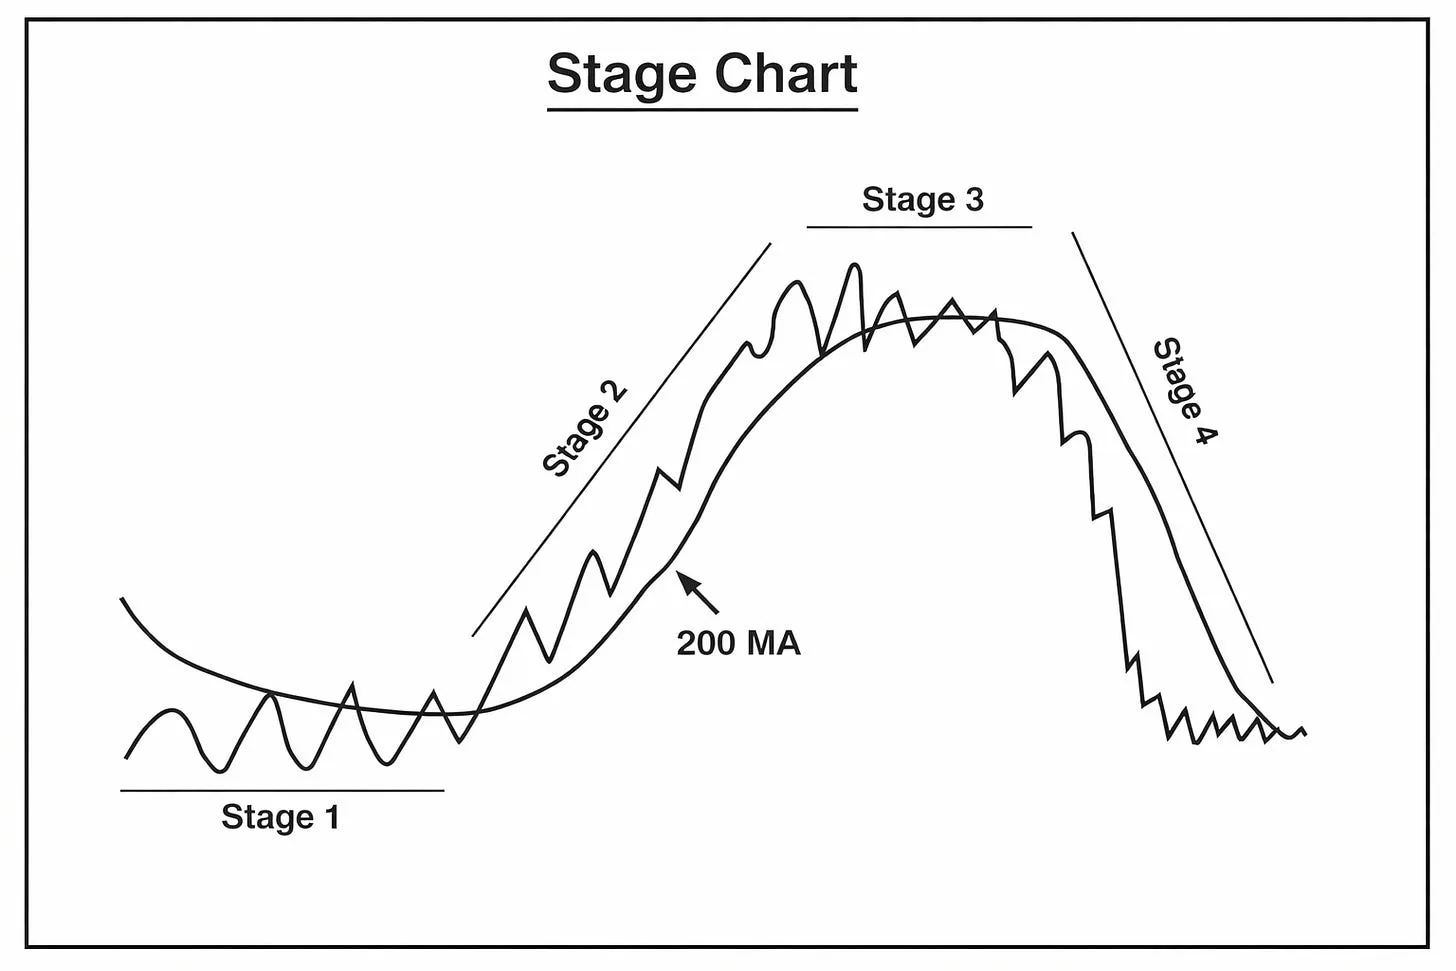
Can you recognize Stage 3 while it is developing, or does it only become obvious in hindsight?
That question is why I created this video. Stan Weinstein and Mark Minervini describe observable changes in price behavior that help us recognize a developing top while the outcome is still uncertain. Learning to identify those changes is an essential part of managing risk and protecting gains.
You should not expect to identify Stage 3 at the exact moment it begins. An initial pullback may look normal, and it takes time for heavier selling, wider price swings, weaker recoveries, and changes in moving average behavior to establish a clearer pattern. That delay does not mean recognition is only possible after the fact. As the evidence accumulates, we can recognize that the character of the uptrend has changed and adjust our approach accordingly.
In this video, I apply Stan Weinstein’s stage analysis across the major indexes, sectors, industry groups, and individual stocks. We briefly review all four stages: Stage 1 basing, Stage 2 advancing, Stage 3 topping, and Stage 4 declining. The main focus is recognizing the transition from an orderly Stage 2 advance into the increasingly unstable conditions associated with a developing Stage 3.
Using chart replay in MTS Velocity, I walk through examples involving the Nasdaq 100, technology sector XLK, semiconductors SOXX, and leading stocks including Micron (MU), SanDisk (SNDK), AXT (AXTI), AMD, and Western Digital (WDC). We examine what was visible as the price action unfolded and how the warning signs became clearer over time. Comparing these charts also shows why a stock, its industry group, and the broader market can begin deteriorating at different points.
Throughout the walkthrough, I cover:
- Healthy pullbacks versus developing topping behavior: How the character of price action changes as an uptrend loses its consistency.
- Distribution and abnormal selling: What heavy-volume declines and clusters of distribution days can reveal.
- Moving averages and trend structure: How flattening averages, weaker recoveries, and breaks of support contribute to the assessment.
- Leading stocks and failed breakouts: What your positions and recent purchases may be telling you about changing conditions.
- Daily and weekly charts: Why the timeframe matters when evaluating a potential stage transition.
- Progressive exposure: How I adjust new buying and position size as trading conditions improve or deteriorate.
Recognizing a developing Stage 3 does not mean knowing that Stage 4 will follow. A potential top can resolve into another Stage 2 advance, and the evidence may strengthen or weaken as new price action develops. We can still make informed decisions about exposure, stops, and profit protection while that outcome remains uncertain.
Weinstein’s framework is the foundation, supported by William O’Neil’s emphasis on distribution and leading stocks, Mark Minervini’s observations about changing price behavior, and a brief discussion of Dr. Van Tharp’s market types. The purpose is to help you recognize these conditions on the charts you review every day. As you watch the examples unfold, ask yourself: When did the evidence become strong enough to change how you would trade?
Ready to Learn More?
If you want to build on what we covered in this video, the Momentum Trading Strategy Course is included with All-Access. We go deeper into stage analysis, stock selection, entry timing, position sizing, and sell rules so you can apply these concepts within a structured trading process.
 Momentum Trading Strategy: The 100-Year Playbook Behind the Biggest Winning StocksMost people approach the stock market backwards.Mar 5, 2026 · Read on Substack →
More in Strategy & Tactics
All Strategy & Tactics articles →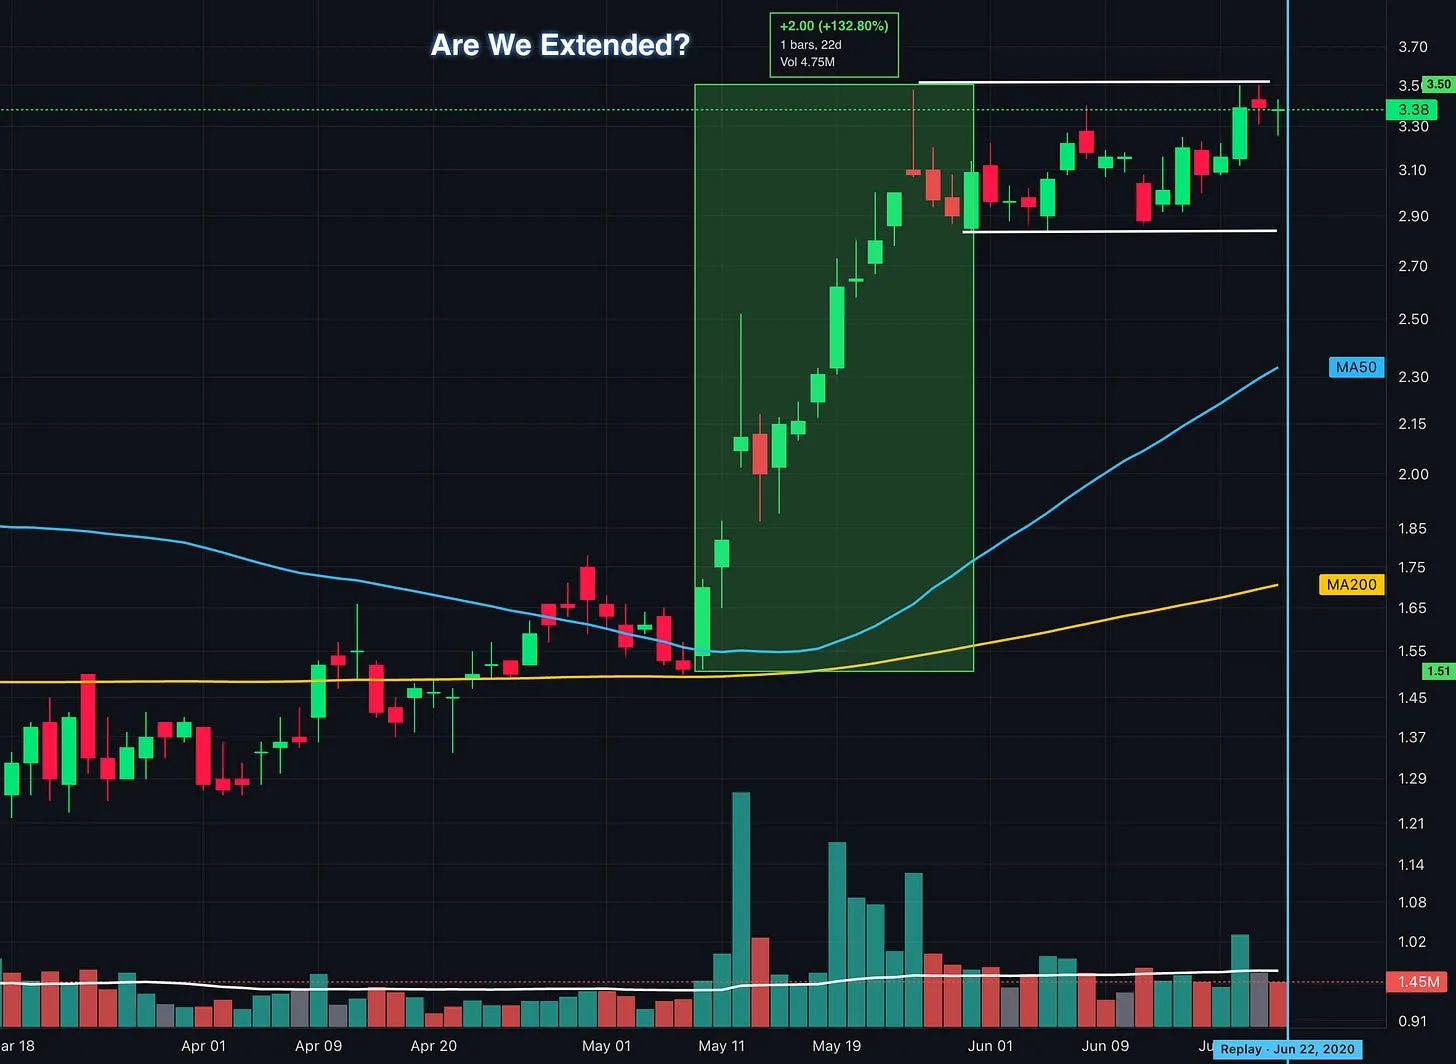
Oct 8, 2026 · Strategy & Tactics
Up 100% and Still Buyable? What Traders Get Wrong About Extended Stocks
How to identify proper buy points, avoid chasing stock breakouts, and manage entry risk using lessons from William O’Neil, Mark Minervini, David Ryan, and Dan Zanger.
- Momentum Trading
- VCP
- position trading
- Growth Stock Trading
- David Ryan
- Flag Pattern
- chart patterns
- Cup and Handle
Sep 27, 2026 · Strategy & Tactics
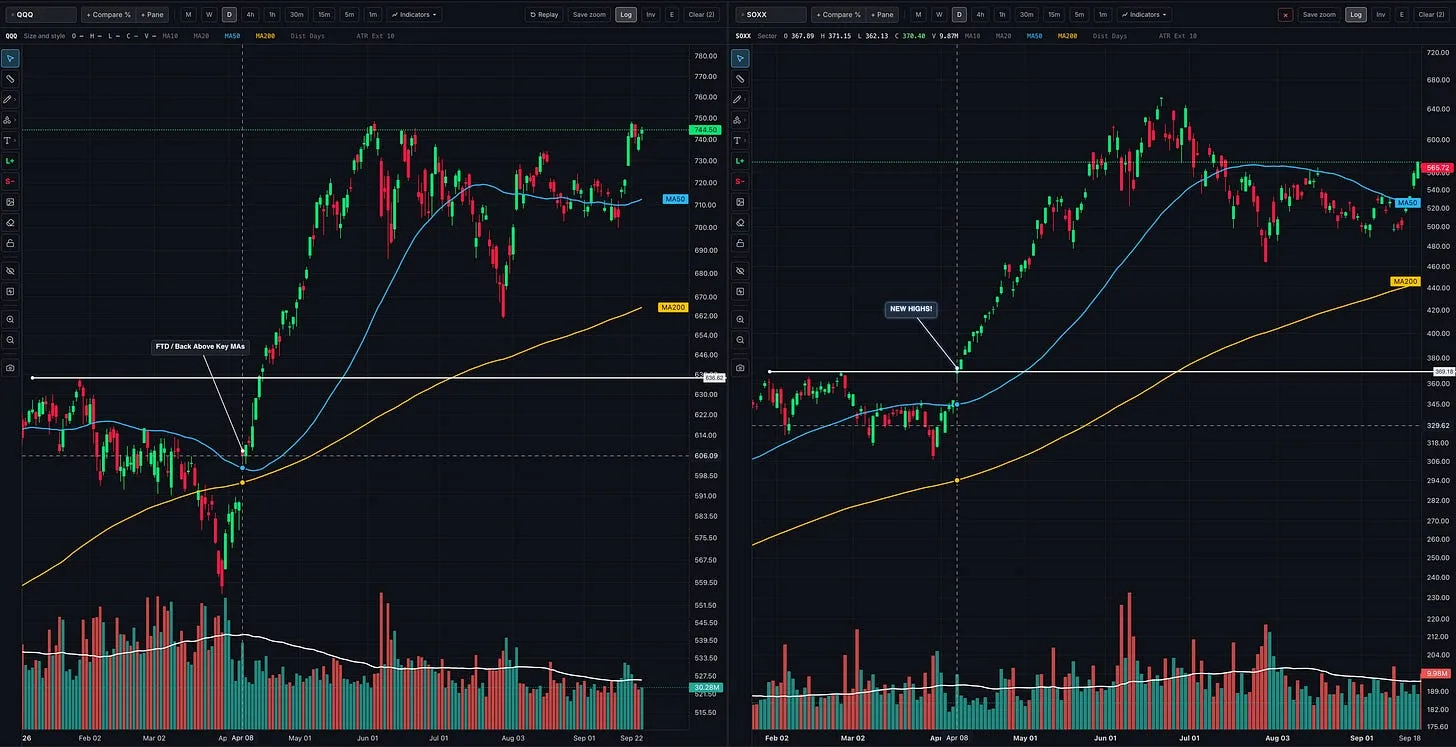
Should You Follow Leading Stocks or Wait for Market Confirmation?
How to read the market, industry groups, and individual stocks together so you can recognize opportunities, build exposure, and respond when conditions change
- growth stocks
- CANSLIM
- Trading
- position trading
- Stan Weinstein
- William O'Neil
- Momentum Trading Strategy
- Trade stocks
Sep 9, 2026 · Strategy & Tactics
100+ Years of Winning Stocks: The Patterns That Keep Repeating
A decade-by-decade video walkthrough of the trends, setups, and buy points behind some of history’s biggest stock market winners.
- how to make money in stocks
- Momentum Trading
- technical analysis
- position trading
- Growth Stock Trading
- biggest winning stocks
- William O'Neil
- Cup with handle