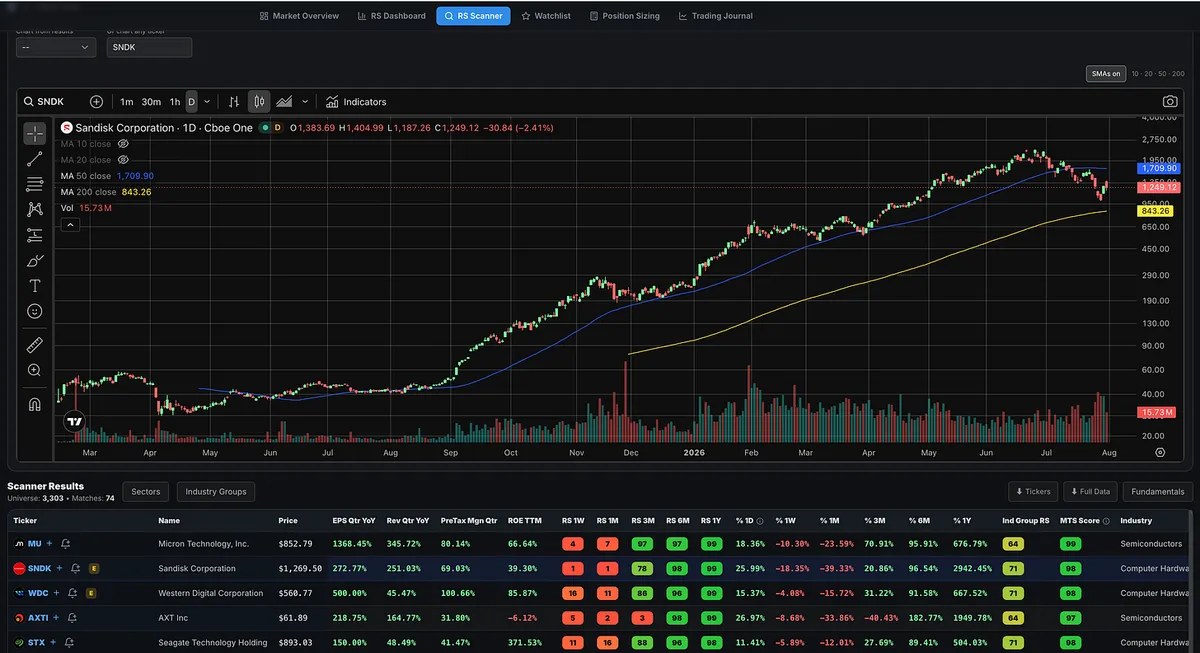
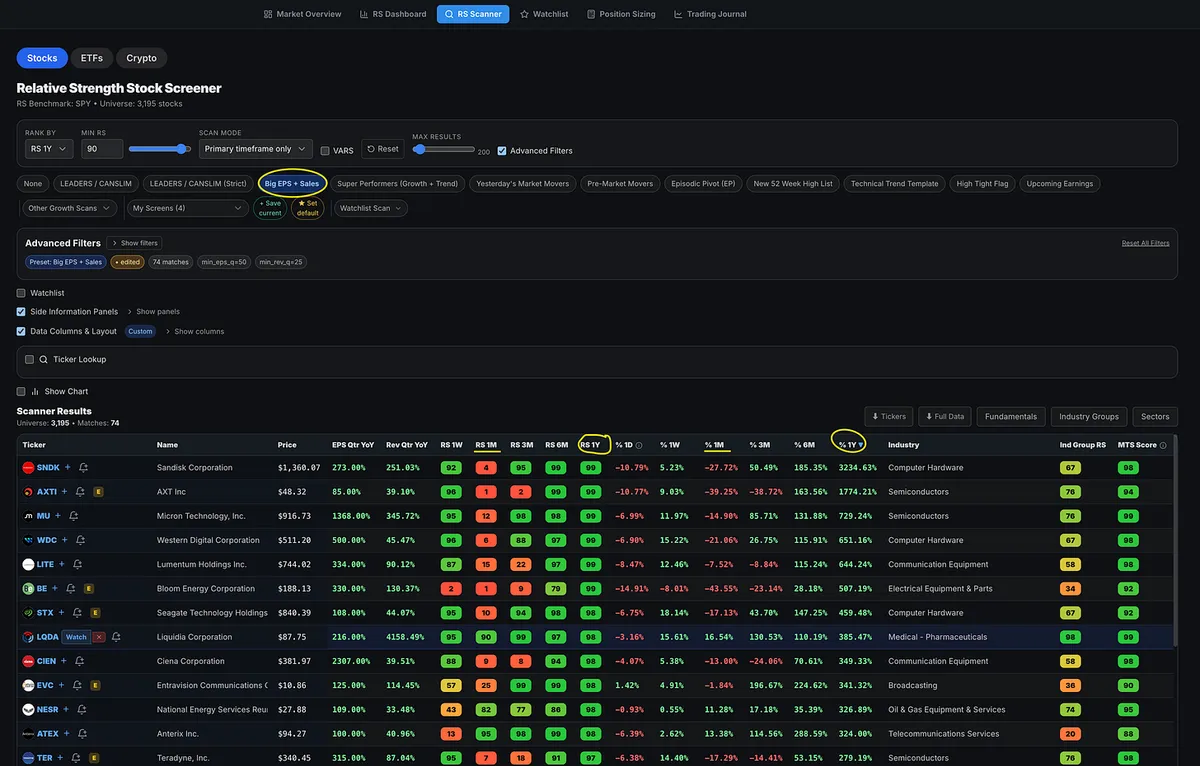
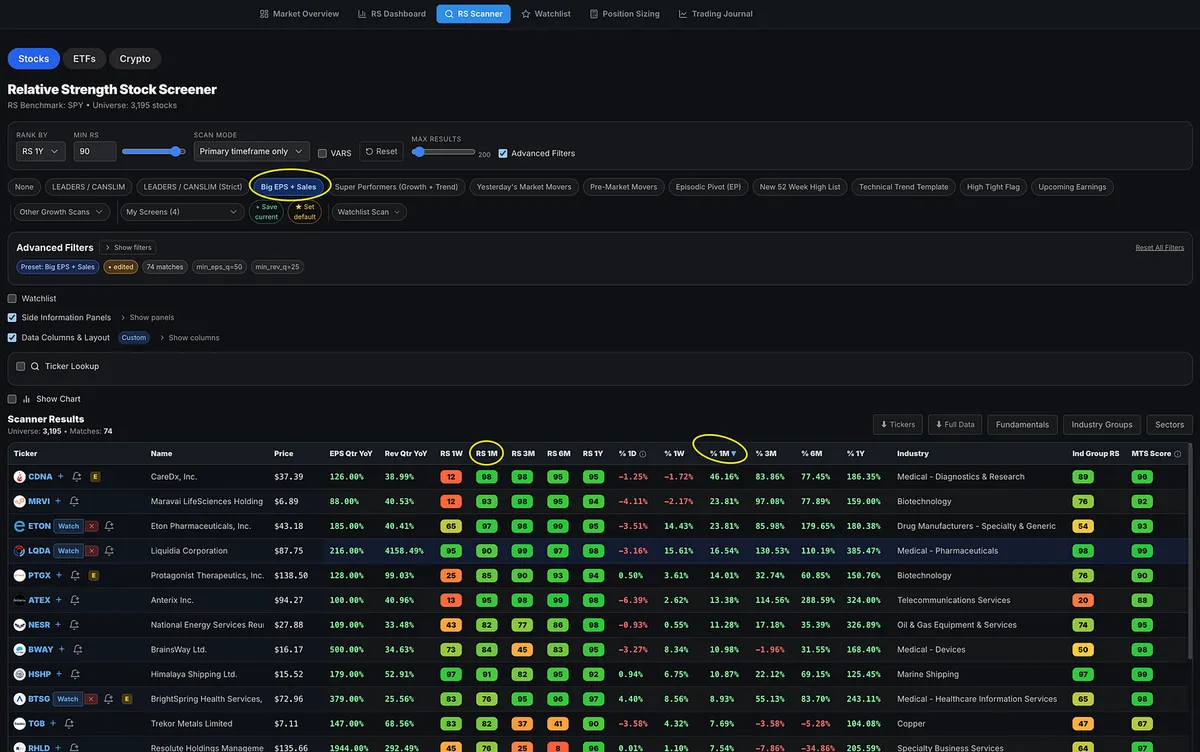
Three New Research Panels Are Now Live
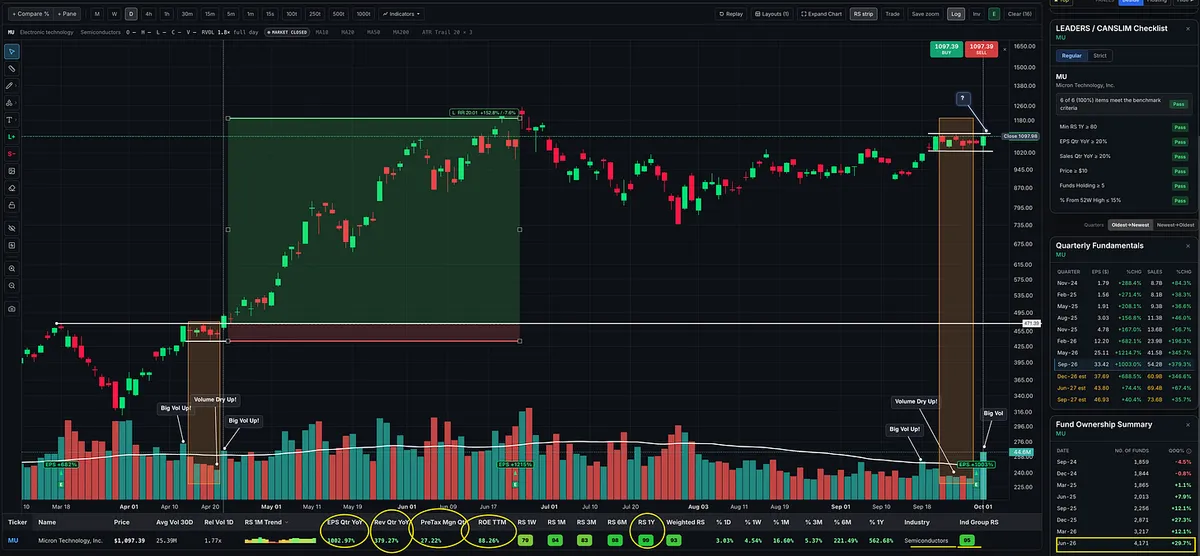
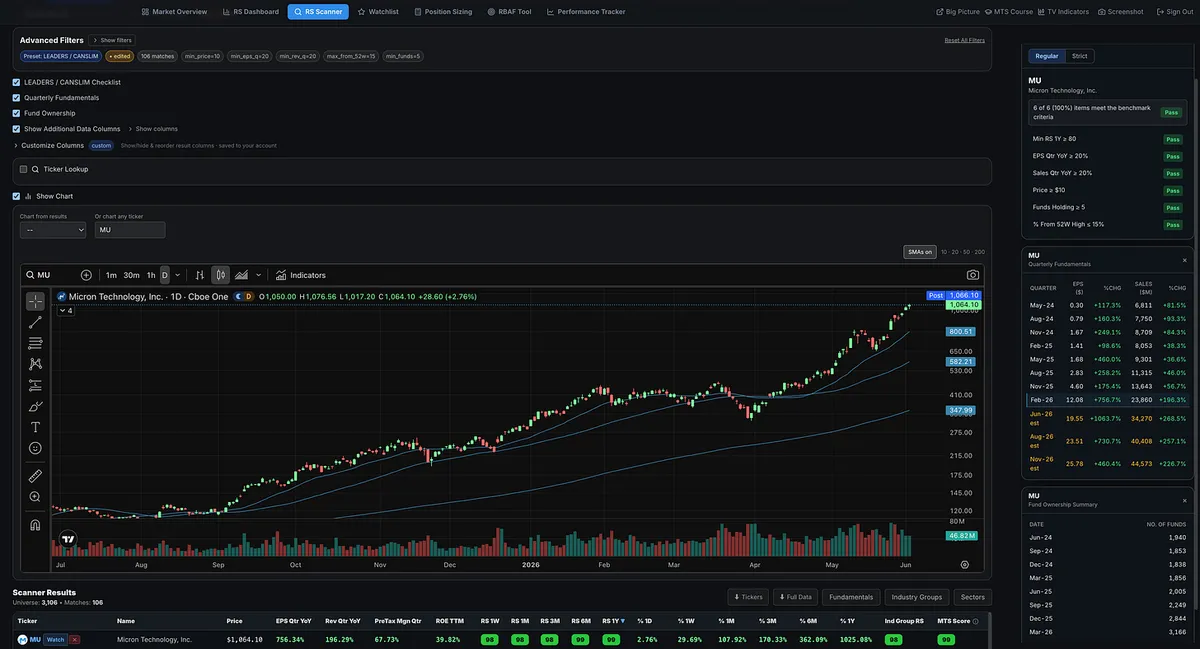
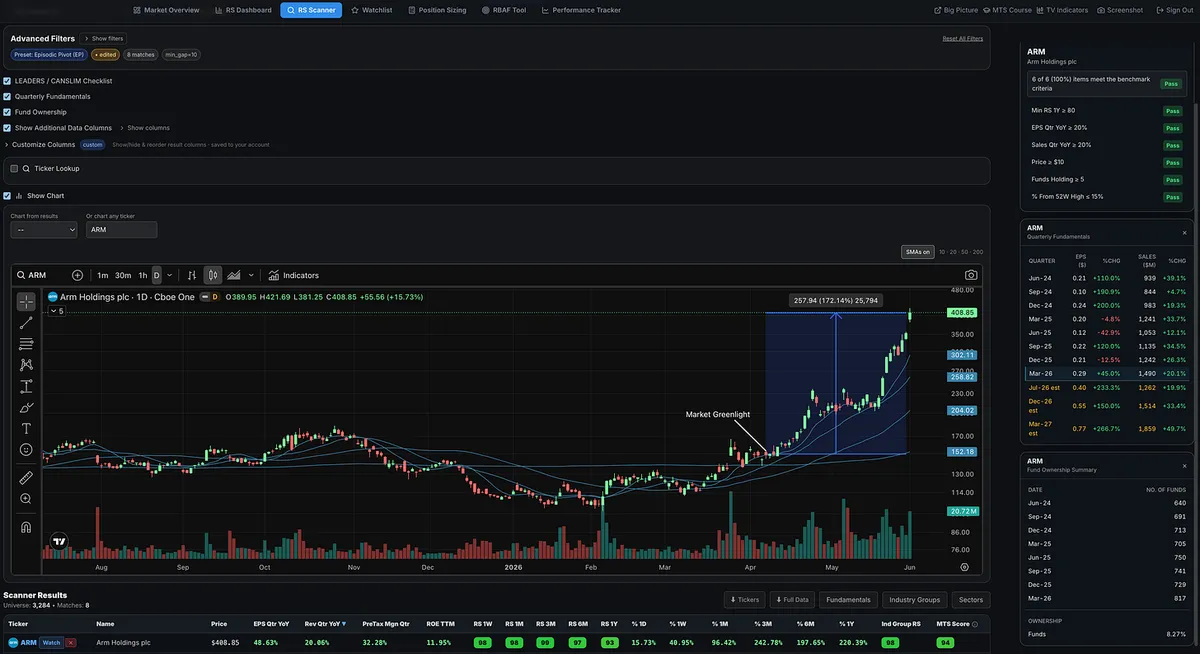
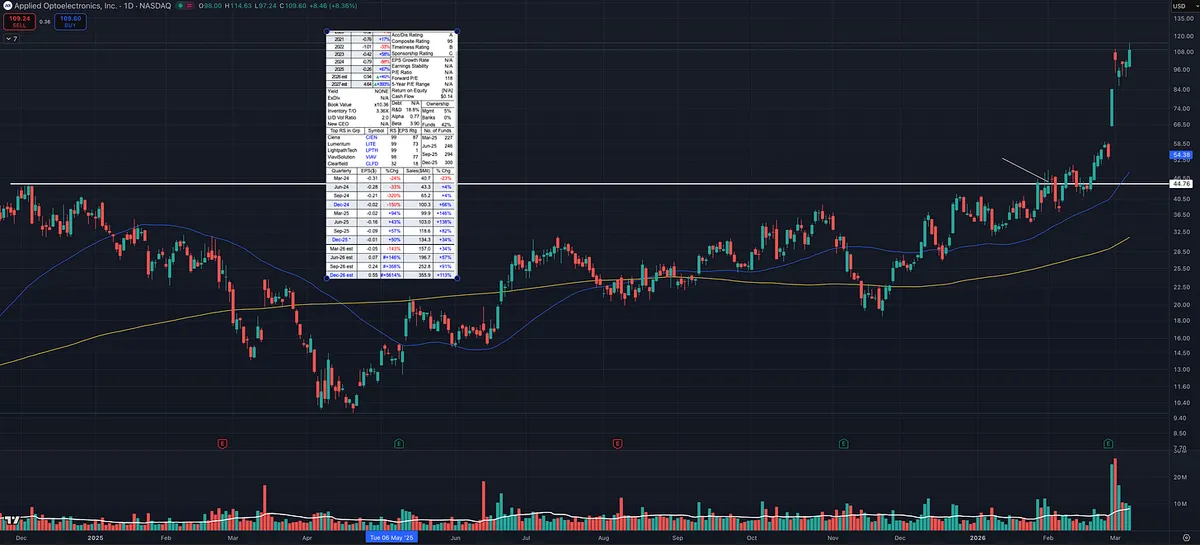
We added three new side panels to the Momentum Trading Strategy software this week: Historical RS, Institutional Sponsorship, and Surprises & Revisions.
Each panel is designed to provide an additional layer of research beyond the headline earnings, sales, relative strength, and fund ownership numbers you already see in the scanner.
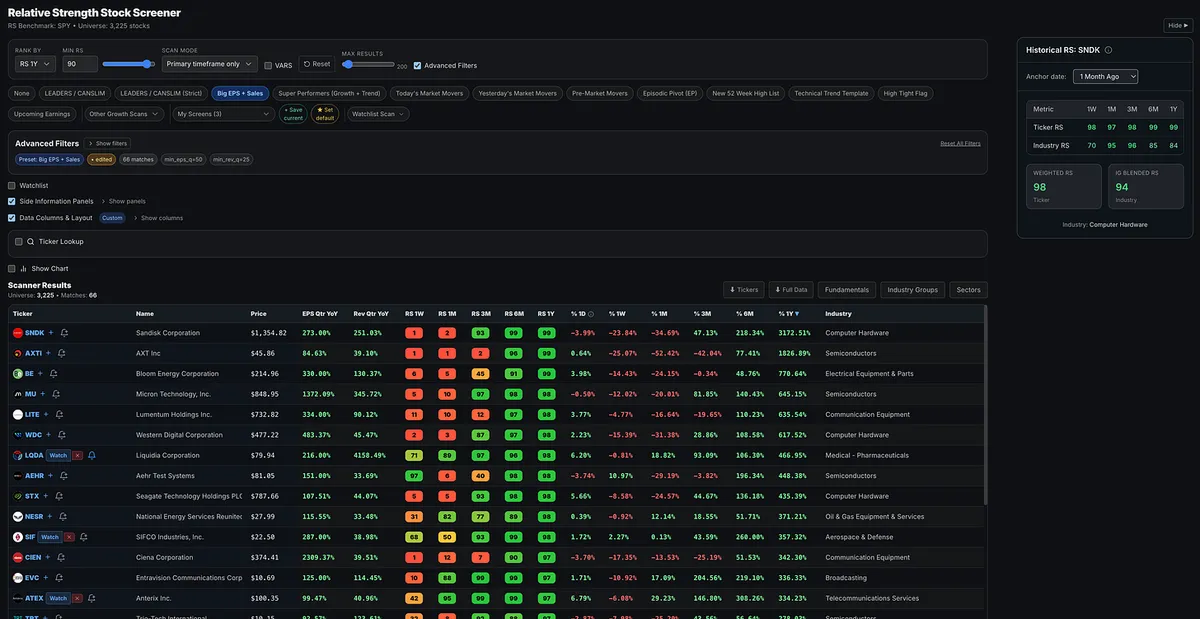
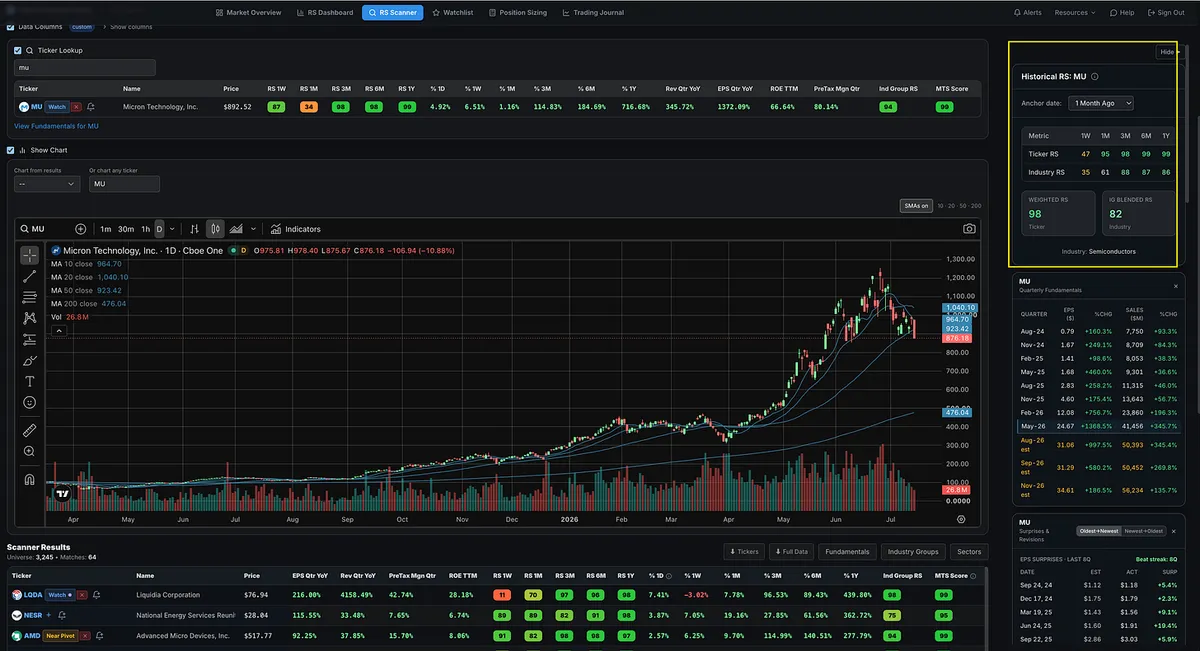
Historical RS
The Relative Strength readings currently displayed in the software show a stock’s performance ending today.
For example, the one-month RS measures relative performance over the month ending today. The three-month RS measures the three months ending today, and the same applies to the one-week, six-month, and one-year readings.
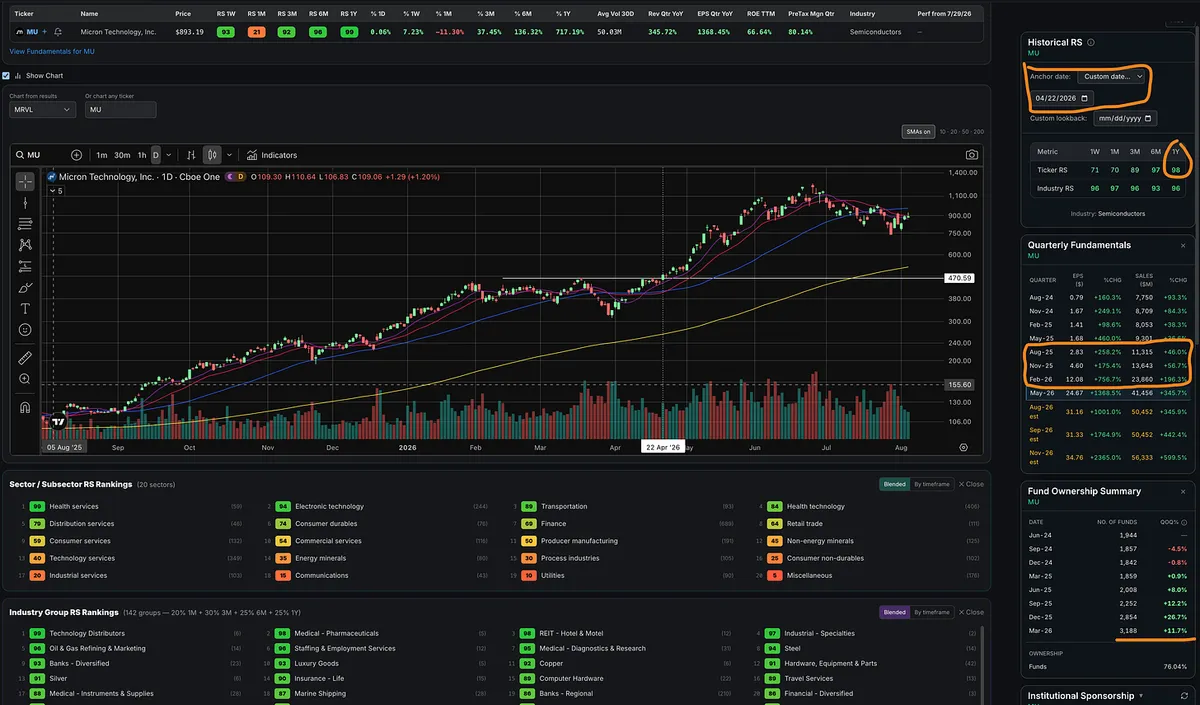
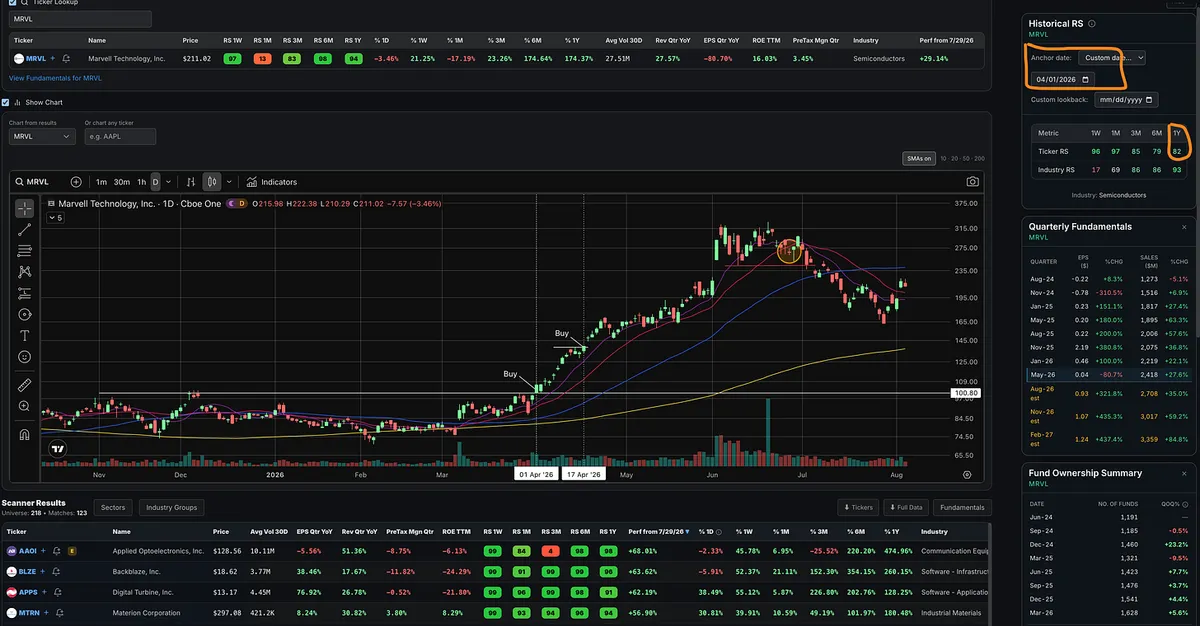
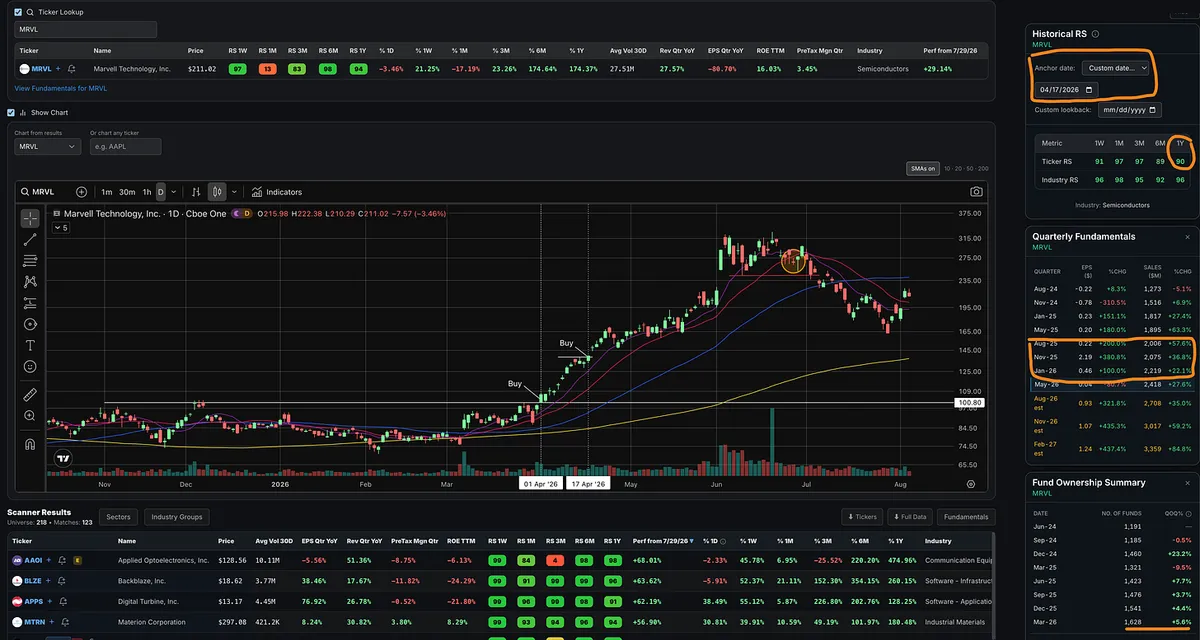
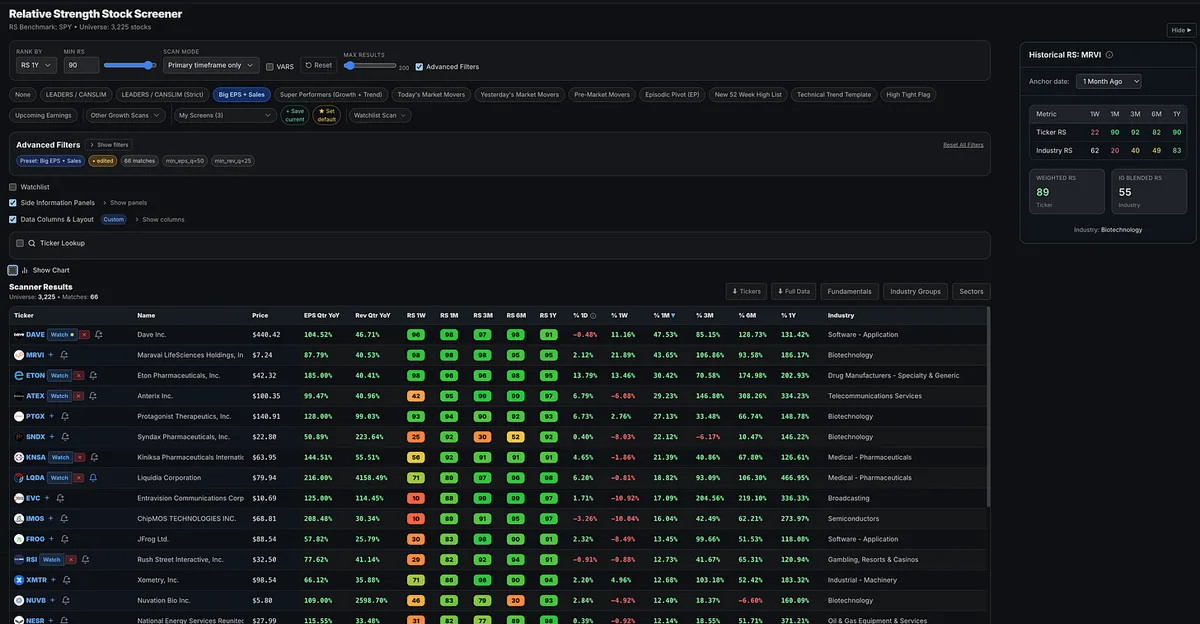
The new Historical RS panel allows you to change the anchor date and see what those readings looked like at an earlier point in time.
For example, you can select one year ago and see what the stock’s one-month, three-month, six-month, and one-year RS readings were as of that date. You could also go back six months and see what the three-month RS looked like at that specific point.
The panel also displays the stock’s Weighted RS score, its Industry Group Blended RS score, and the company’s industry.
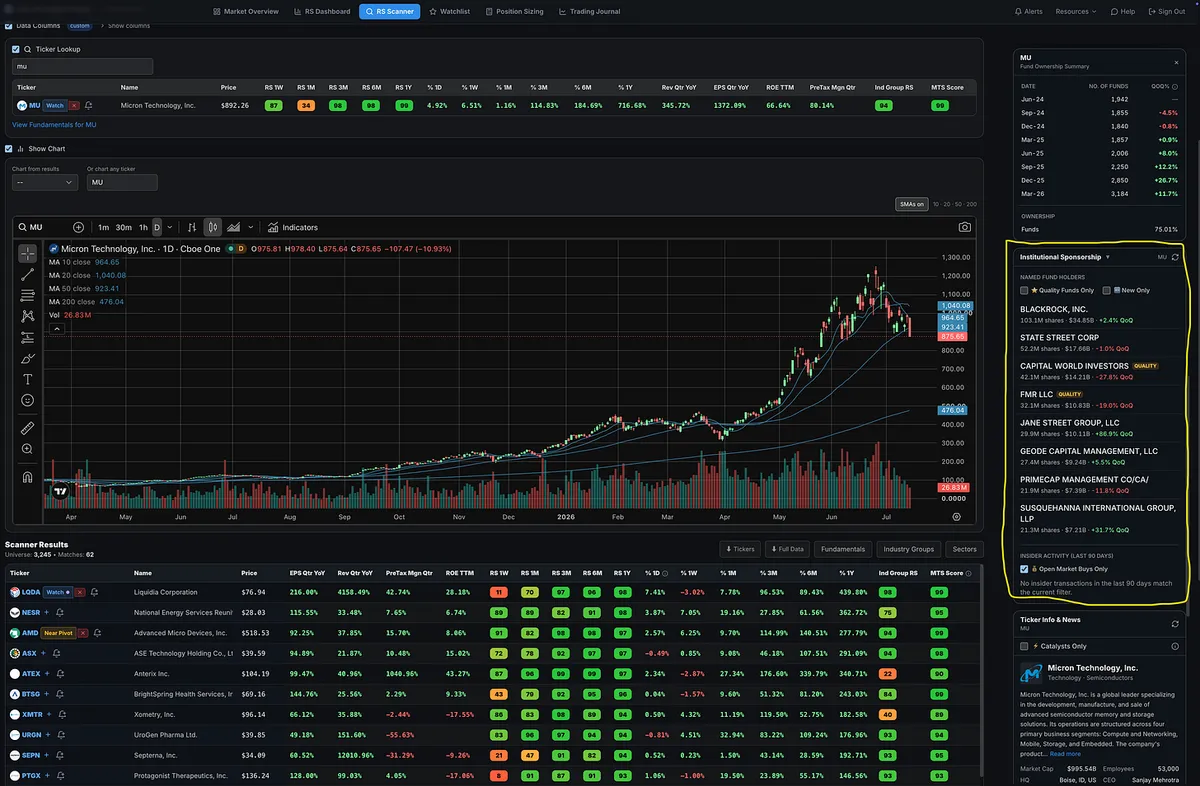
Institutional Sponsorship
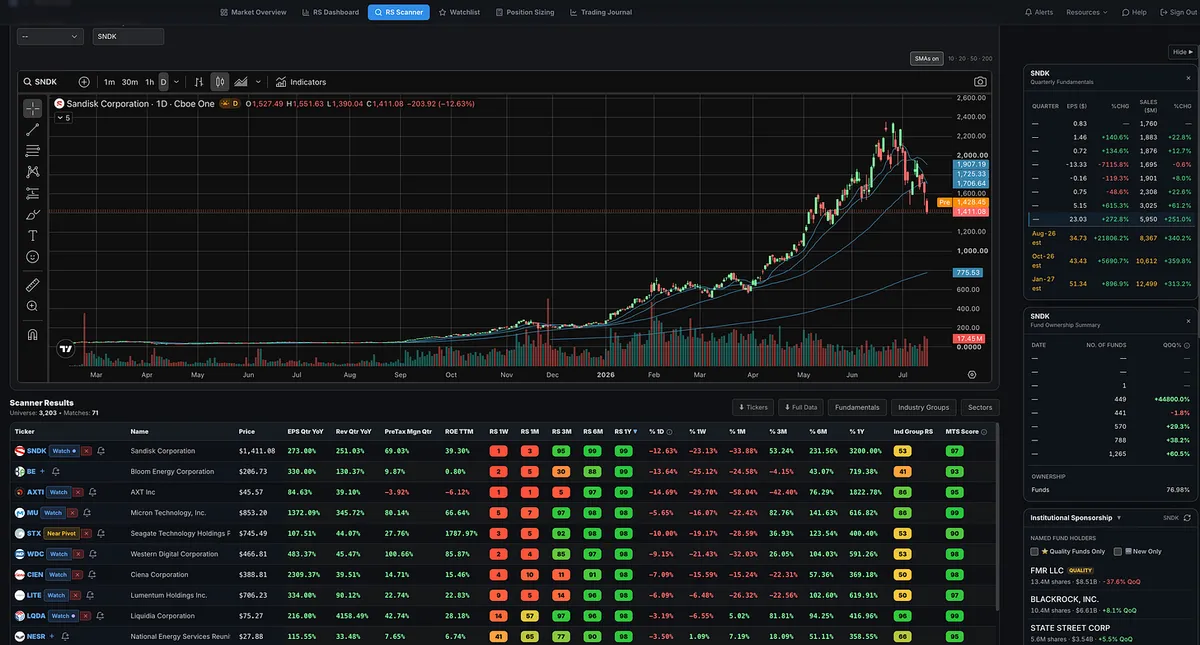
We already displayed quarterly fund ownership, including the number of funds holding a stock and the quarter-over-quarter percentage change.
That allows you to see whether institutional ownership has been increasing or decreasing over several quarters.
The new Institutional Sponsorship panel takes the research one level deeper by showing the specific institutions involved in the stock.
O’Neil explained that it is not enough to know how many institutions own a company. Investors should also examine which institutions are involved, whether better-performing funds are participating, whether those funds have recently established positions, and whether the overall number of sponsors is increasing.
The panel gives you a clearer view of who is behind the ownership numbers and provides a starting point for evaluating the quality of that sponsorship.
A recognizable fund name does not automatically make the sponsorship high quality, but seeing the specific institutions involved gives you considerably more information than the fund count alone.
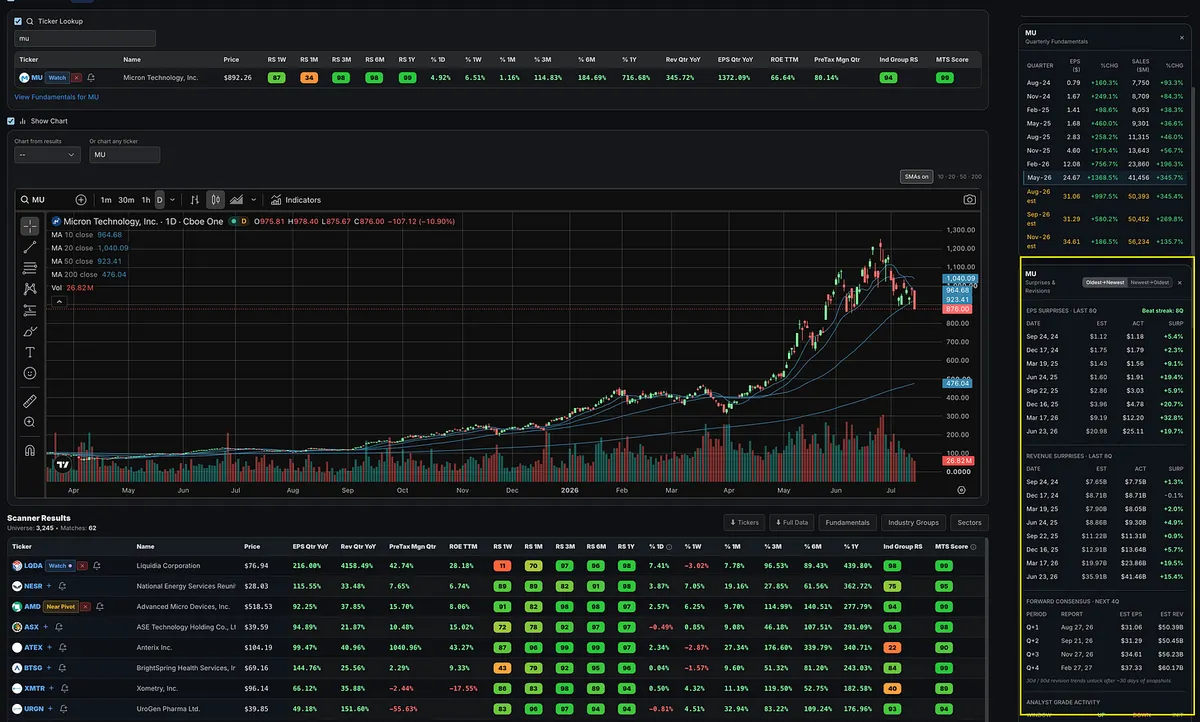
Surprises & Revisions
Strong quarterly earnings and sales growth remain the primary fundamental numbers we care about.
However, O’Neil also discussed the value of tracking earnings surprises and changes in analyst estimates as a secondary layer of research.
The new Surprises & Revisions panel displays earnings surprises, sales surprises, estimate revisions, and recent analyst upgrade and downgrade activity.
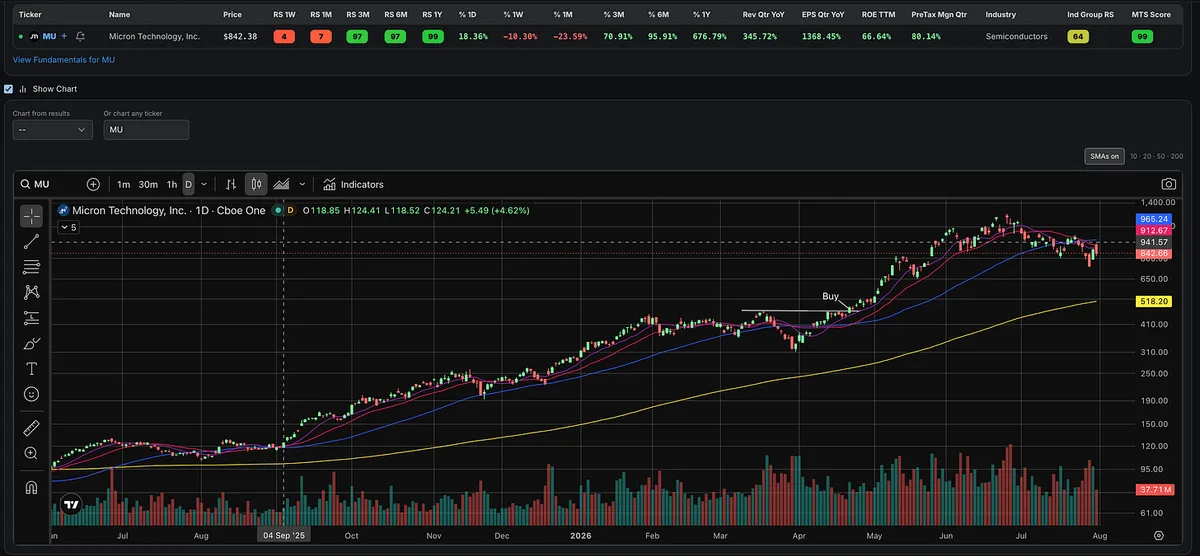
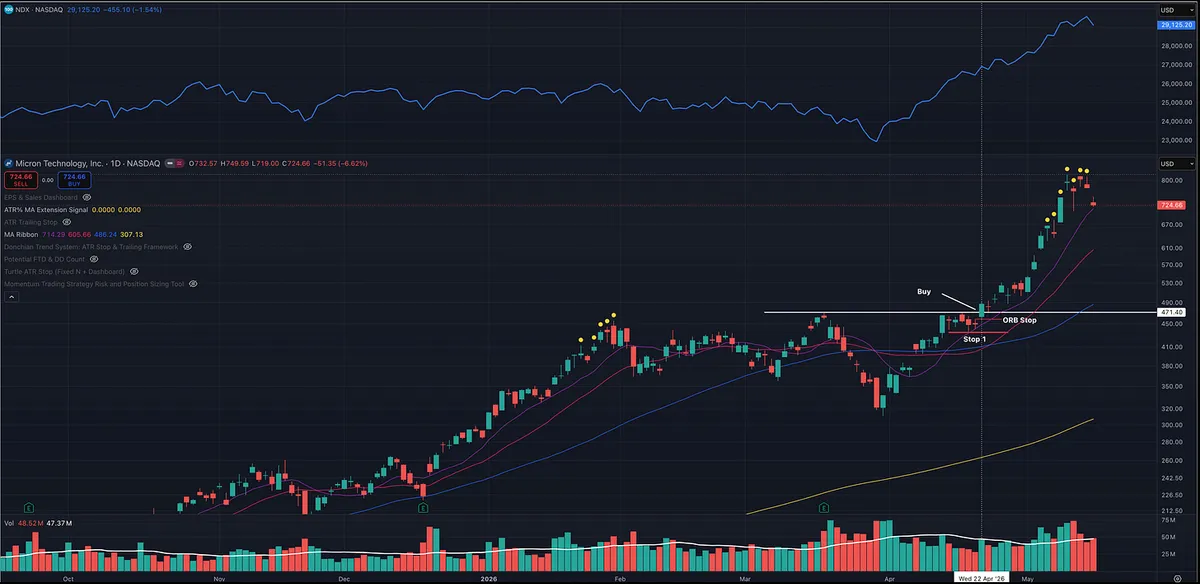
Some of the market’s strongest growth stocks can repeatedly report results well above expectations while analysts continue raising their future estimates. We saw this in names such as MU and SNDK during their strongest periods of earnings and sales growth.
That combination can help identify a company whose business is improving faster than the market originally expected.
Analyst upgrades and downgrades are also included because an unexpected change in opinion can sometimes act as a short-term news catalyst. However, these ratings should never be treated as standalone buy or sell signals. O’Neil repeatedly warned against blindly following analyst recommendations.
These panels do not replace the primary work of studying the chart, earnings and sales growth, price action, market direction, industry-group leadership, and the primary CAN SLIM criteria.
They simply give you more ways to dig beneath the surface and better understand the companies you are researching.