
Trading articles/How I Find the Biggest Winning Stocks in the Market
Jun 3, 2026 · Momentum Trading Strategy
How I Find the Biggest Winning Stocks in the Market
The screening process I use to identify explosive growth stocks capable of advancing 100%, 200%, 300%, 1000% or more.
Originally published on Substack.
“The 500 best performing stocks during the 1953–1985 period had an average relative strength of 87 before their major price increase actually began.”
- William O’Neil
Every year, traders spend thousands of hours searching for the next big winner.
They scroll social media looking for stock tips. They jump between charts hoping something stands out. They chase news headlines, analyst upgrades, and hot stories. Yet despite all of that effort, most never catch the stocks that go on to become the market’s biggest winners.
The irony is that many of those stocks were not hiding.
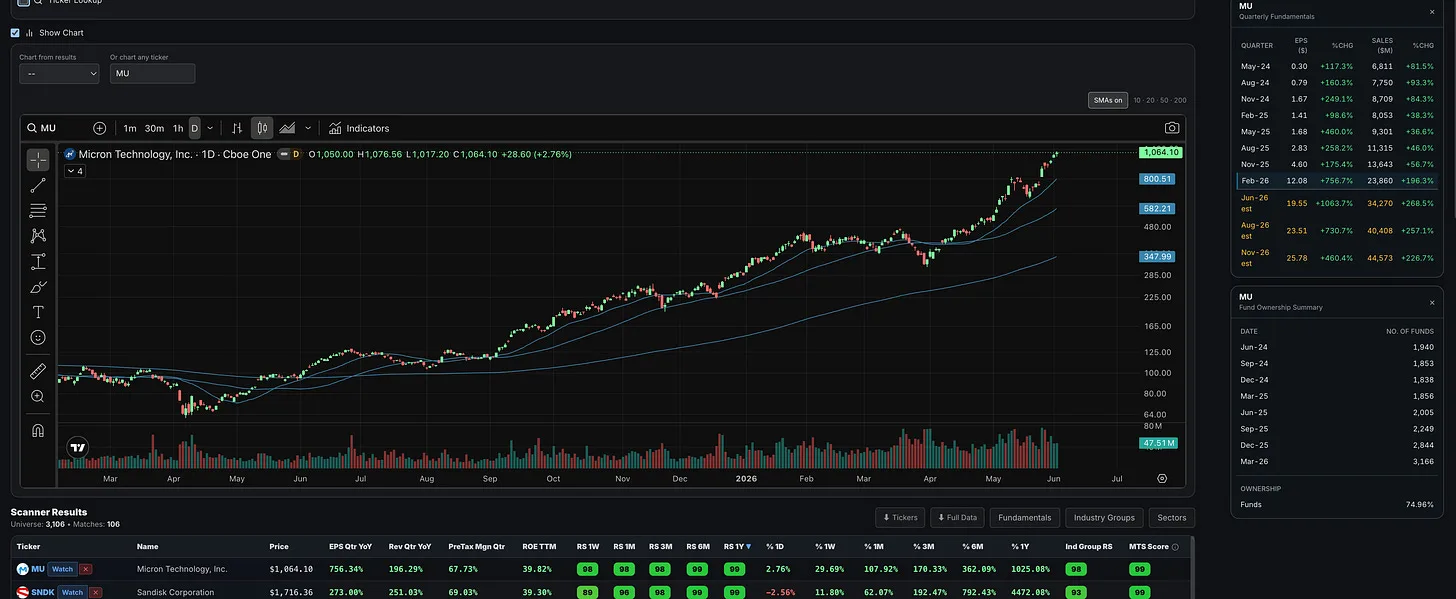
Before Micron (MU) advanced more than 160%, before SanDisk (SNDK) gained more than 250%, before Dell (DELL) climbed over 200%, and before stocks like AAOI and AXTI nearly tripled, they were already displaying many of the same characteristics that have appeared in market leaders for decades.
Strong earnings growth. Strong sales growth. High return on equity. Expanding margins. Rising institutional sponsorship. Powerful relative strength. Leadership within strong industry groups.
These characteristics are not new. They are the same traits found in many of the greatest winning stocks studied by William O’Neil and other legendary growth investors.
The challenge is not finding the information. The challenge is knowing where to look and having a process that consistently narrows thousands of stocks into a manageable list of potential leaders.
In this article, I will walk through the exact screening process I use to identify explosive growth stocks with the potential to advance 100%, 300%, 1000% or more. It is the same process I use every week to build watchlists, identify emerging leadership, and focus my attention on the strongest stocks in the strongest areas of the market.
Step 1: Eliminate Most of the Market
One of the biggest mistakes traders make is trying to analyze every stock available. The first objective is not finding winners. The first objective is eliminating the vast majority of stocks that are unlikely to become winners.
My base universe excludes OTC stocks and most penny stocks. I focus on companies listed on the major exchanges where institutional investors are most active.
The base universe I use includes:
• Minimum stock price: $5
• Minimum market capitalization: $100 million
• Minimum 30-day average volume: $100,000
• Major exchanges only
This immediately reduces the investable universe from thousands upon thousands of securities to approximately 3,200 stocks. Every screen I run starts from this universe.
Step 2: Run a Basic CAN SLIM Leadership Screen
Once the universe is defined, I begin looking for companies displaying characteristics commonly found among historical market leaders.
One of my favorite screens is a simple CAN SLIM-inspired leadership screen.
The criteria include:
• Stock price above $10
• Quarterly EPS growth greater than 20%
• Quarterly revenue growth greater than 20%
• Within 15% of the 52-week high
• Minimum of five institutional funds
• Relative Strength Rating of 80 or higher
This single screen can reduce a universe of more than 3,000 stocks down to roughly 100 names.
From there, I sort by Relative Strength and begin reviewing the strongest stocks first. This simple process has consistently surfaced many of the market’s leading names, including several of my biggest winners.
Step 3: Add Quality Filters
Growth alone is not enough.
Many companies can produce temporary earnings growth, but the best leaders often combine growth with operational excellence and profitability.
To improve the quality of the list, I frequently add:
• Return on Equity greater than 15%
• Or Pre-Tax Margins greater than 15% to 20% (industry specific)
These filters help identify companies that are not only growing but doing so efficiently. It is another way to narrow the list toward businesses that institutions are more likely to accumulate aggressively.
Step 4: Search for Big Earnings and Sales Growth
Another favorite screen focuses on exceptional growth.
For this scan, I often raise the requirements significantly:
• Quarterly EPS growth greater than 40% or 50%
• Quarterly sales growth greater than 20% to 50%
• Relative Strength Rating of 80 to 90
This screen focuses on finding companies experiencing significant business acceleration.
Many of the biggest stock market winners throughout history displayed explosive earnings and sales growth before their largest advances. Rather than predicting which companies may grow in the future, this screen focuses on identifying companies already demonstrating that growth today.
Step 5: Look for Episodic Pivots and Big Gap-Ups
Some of the most powerful stock moves begin with a major earnings gap.
These gaps often signal a sudden shift in institutional perception of a company’s future prospects.
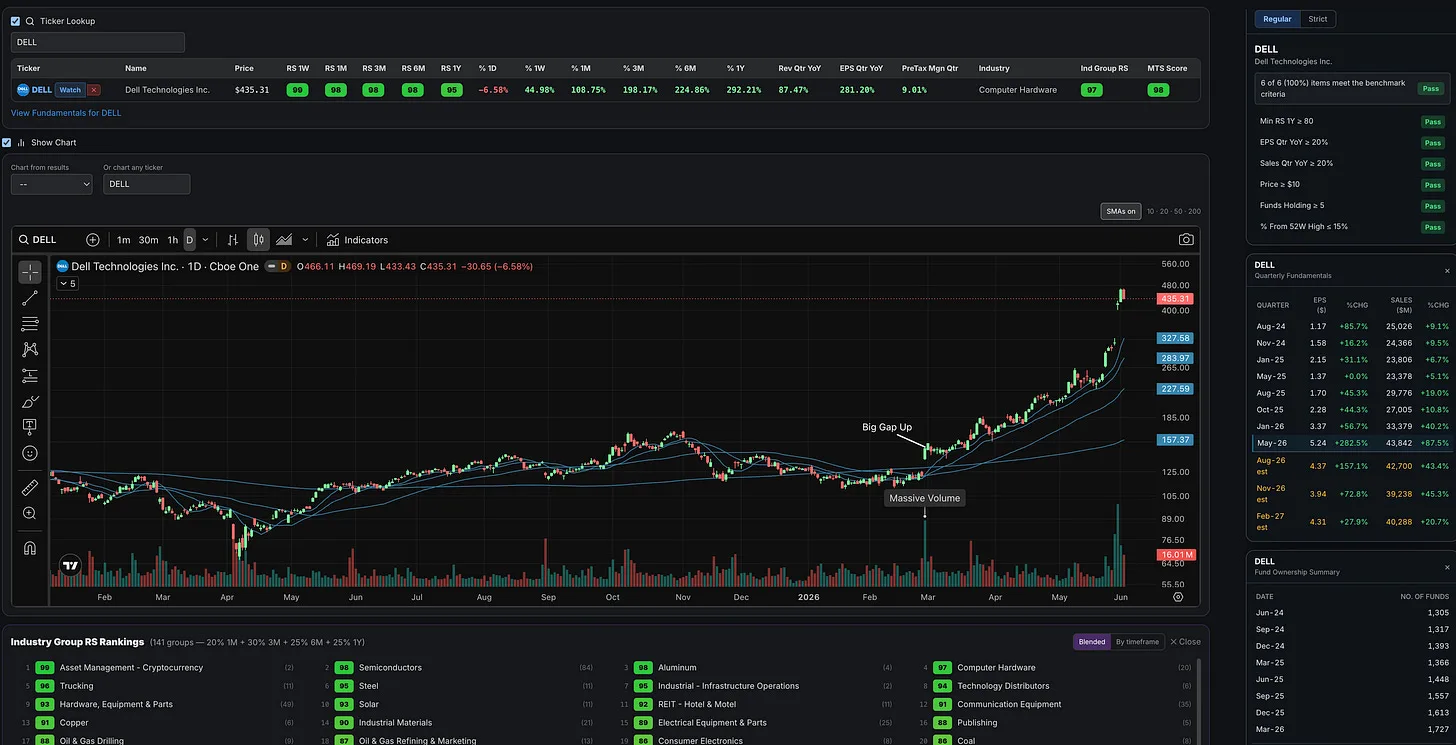
One of the screens I monitor identifies stocks that gapped up at least 10% during the previous trading session.
A recent example was Dell Technologies (DELL). Following a significant earnings-related gap higher on February 27, 2026, the stock initially advanced, then consolidated for roughly a week before beginning a much larger move. Since that signal appeared, the stock advanced more than 200%.
These types of gap-ups frequently become the starting point of some of the market’s strongest trends.
Step 6: Review Yesterday’s Biggest Movers and Pre-Market Movers
Every day, I review stocks that gained at least 5% during the previous session. On its own, this list can reveal emerging leadership, unusual demand, or a stock beginning to attract attention.
I also review pre-market movers each morning to see which stocks are attracting early interest before the regular session begins. Not every pre-market mover matters, but it helps me stay aware of where fresh demand may be showing up.
When the same names keep appearing on these lists, they get my attention.
Step 7: Follow the Trend
I also maintain a simple trend template screen.
The criteria are straightforward:
• Price above the 50-day moving average
• Price above the 200-day moving average
• 50-day moving average above the 200-day moving average
This keeps my focus on stocks already demonstrating leadership. I am not trying to find the cheapest stock in the market. I am trying to find stocks that are under accumulation and showing evidence of institutional demand.
From there, I sort by relative strength across multiple timeframes. This is something I do with nearly every screen I run. I do not only look at the one-year relative strength number. I compare shorter-term and longer-term relative strength to see whether a stock is gaining strength, losing momentum, or showing consistent leadership across the board.
When a stock has relative strength rankings of 90 to 95 or higher across multiple timeframes, that is even better. It tells me the stock is not just strong over one isolated period. It has been leading over the short term, intermediate term, and longer term. Those are the names I want to study closely because sustained relative strength is often a sign of persistent institutional demand.
A stock may have good one-year relative strength but very strong one-month or three-month relative strength. That can signal acceleration and may identify an emerging leader. On the other hand, a stock may still have a strong one-year relative strength ranking but weaker shorter-term relative strength. That can signal deceleration, which may represent either a normal pullback opportunity or the early stages of a weakening trend.
This is where fundamentals and price action must be viewed together. If relative strength is weakening while earnings and sales are also decelerating quarter after quarter, the weakness may be warning that the prior trend is coming to an end. If the stock is pulling back while the company continues to post strong or accelerating earnings and sales growth, the weakness may simply be creating a better entry opportunity inside a continuing leadership trend.
The goal is not just to find stocks in uptrends, but to understand whether leadership is consistent, strengthening, weakening, or simply pausing.
Step 8: Monitor New 52-Week Highs
Many traders spend their time searching for stocks that have fallen significantly.
I prefer looking at stocks making new highs.
History shows that some of the market’s greatest winners spent much of their advances making new highs repeatedly. While new highs can feel uncomfortable to many traders, they often signal strong demand and institutional sponsorship.
A dedicated review of new highs remains one of the simplest and most effective methods for discovering leadership.
Step 9: Focus on Leading Industry Groups
Perhaps the most important lesson I have learned is that winning stocks rarely emerge in isolation.
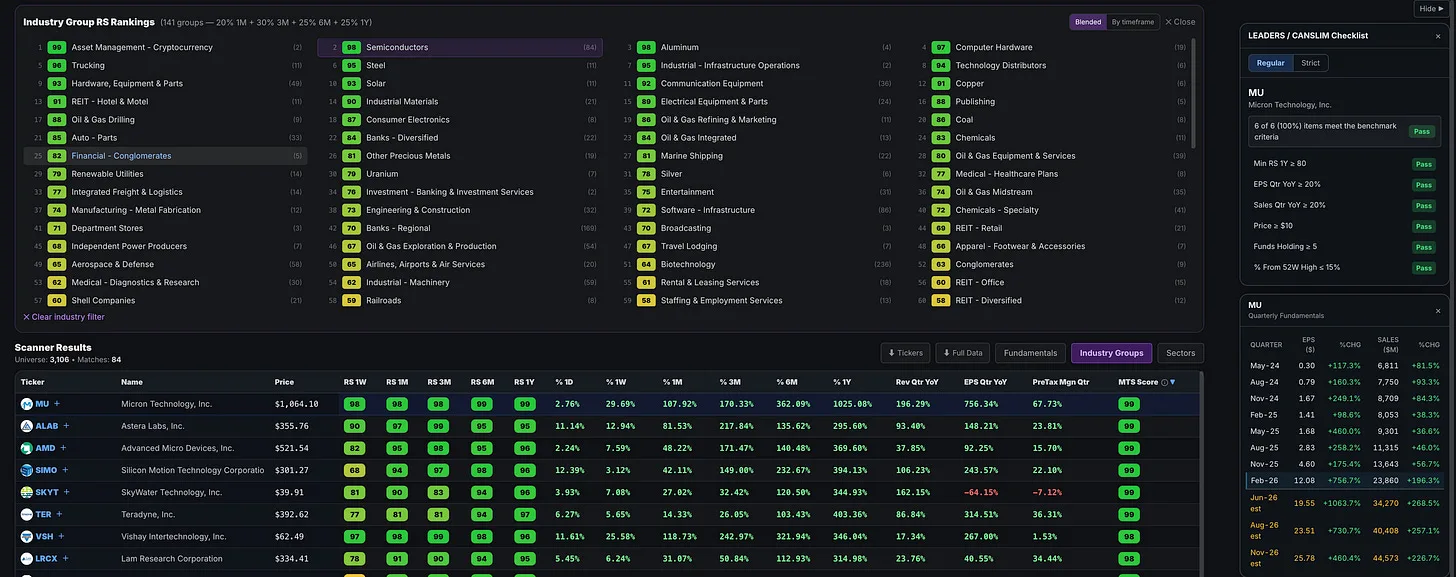
The strongest stocks tend to cluster inside the strongest industry groups. When I reviewed many of the biggest winners identified by my screens this year, a clear pattern emerged. The AI theme continued to dominate, with semiconductors, telecommunications equipment, computer hardware, and data storage driving many of the market’s largest winners.
Semiconductors were one of the clearest examples. AAOI gained more than 450%. AXTI gained nearly 550%. MU advanced roughly 260%. These were not random stocks moving independently. They were part of a broader area of the market attracting significant institutional attention.
The same pattern appeared in hardware-related groups. SNDK advanced roughly 600%, while STX and WDC each gained more than 200%. Telecommunications equipment also produced major winners, with LITE advancing roughly 200%, CIEN gaining about 180%, and VIAV climbing more than 200%.
This is only a small snapshot. When you look deeper, many of the biggest winners often come from just a few strong areas of the market. Institutional money tends to flow into themes and groups. When an industry group becomes a market leader, multiple stocks within that group often participate.
That is why I frequently identify the strongest industry groups first and then apply my leadership screens inside those groups. Instead of searching the entire market equally, I focus my attention where institutional capital is already flowing.
Step 10: Use the MTS Score
Throughout this article, I have discussed many of the fundamental and technical characteristics I look for when screening stocks. Strong earnings growth, strong sales growth, profitability, return on equity, relative strength, industry group strength, and price action all matter.
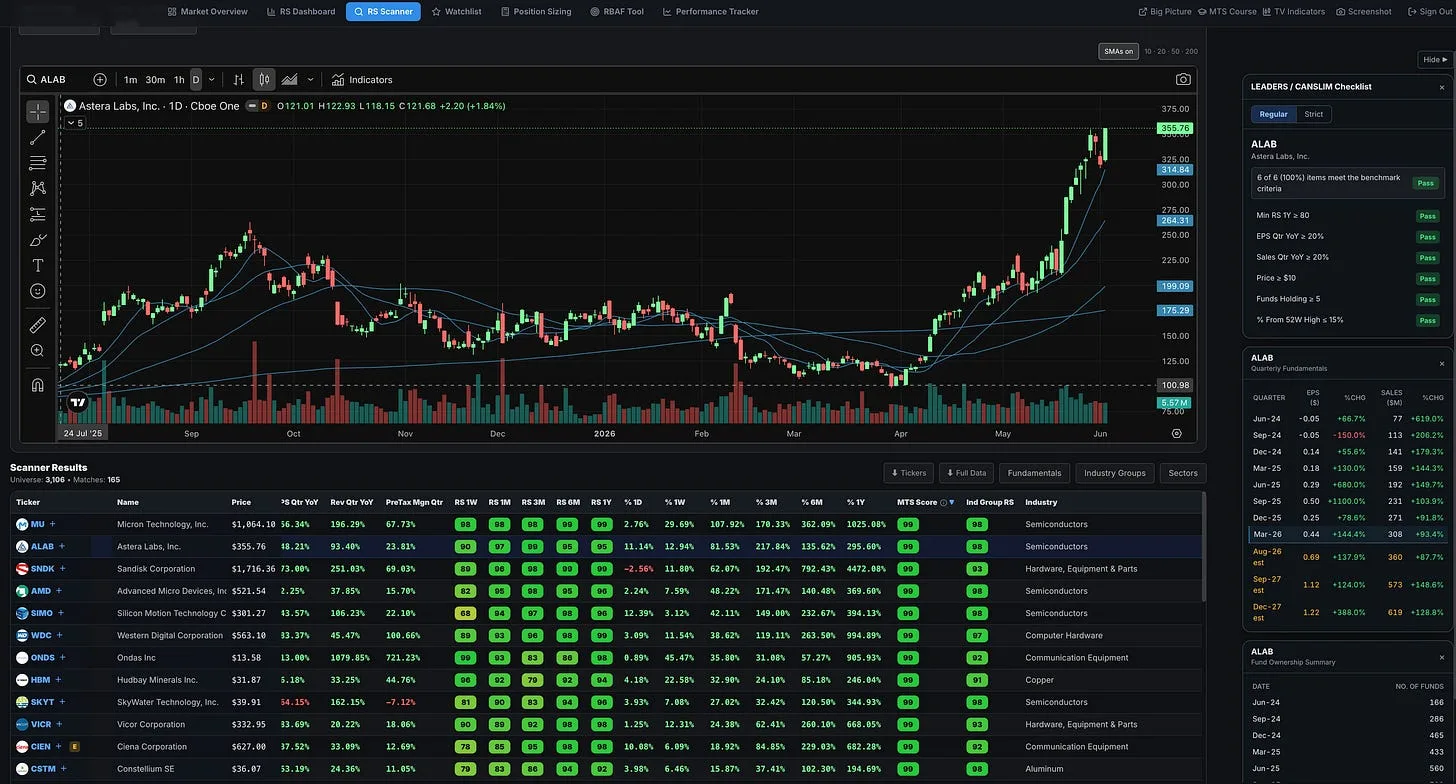
The MTS Score was built to bring many of those characteristics together into a single leadership rating.
This does not replace the individual screens discussed throughout this article. I still use those screens every week to discover new ideas, identify emerging themes, and study leadership from different angles. However, the MTS Score gives me another way to quickly identify stocks where many of those leadership characteristics are beginning to align.
One of the challenges with traditional screening is that it often relies on fixed numbers. A trader might screen for 20% earnings growth, 20% sales growth, 15% return on equity, or 15% pre-tax margins. Those filters can be extremely useful, but market environments are constantly changing. In one bull market, 30% earnings growth may place a company among the strongest stocks in the market. In another, it may barely stand out because dozens of companies are growing at 50%, 75%, or even 100%.
The MTS Score approaches the problem differently. Rather than focusing on whether a company meets a specific threshold, it ranks stocks against the entire market based on a combination of earnings strength, sales growth, profitability, relative strength, industry group leadership, and price action. This helps identify which companies are separating themselves from their peers right now, regardless of the current market environment.
In many ways, this is similar to the philosophy behind William O’Neil’s Composite Rating. Instead of relying on a single metric, it combines multiple leadership factors into one score designed to identify stocks exhibiting the characteristics that have historically appeared in many of the market’s biggest winners.
A high MTS Score does not guarantee a stock will become a major winner. However, it does tell me the stock is ranking highly across many of the same factors that have historically been associated with market leadership. When I see a stock with a high MTS Score, it immediately tells me that several important pieces of the puzzle may already be in place.
Like every other tool discussed in this article, the goal is to consistently focus my attention on the strongest stocks in the strongest areas of the market and let the market determine which ones become the next big winners.
A Common Misconception About Relative Strength
At this point, some readers may be thinking:
“If a stock already has a Relative Strength Rating of 95, 98, or 99, haven’t I already missed the move?”
This was not just a hypothetical concern. As I shared many of these setups in real time, several newer traders voiced this exact question.
In my experience, not necessarily.
One of the biggest misconceptions about relative strength is that a high rating means a stock is extended and can no longer be purchased. In reality, many of the market’s biggest winners maintain exceptionally high relative strength ratings for months while continuing to build bases, pull back to key moving averages, and create new entry opportunities.
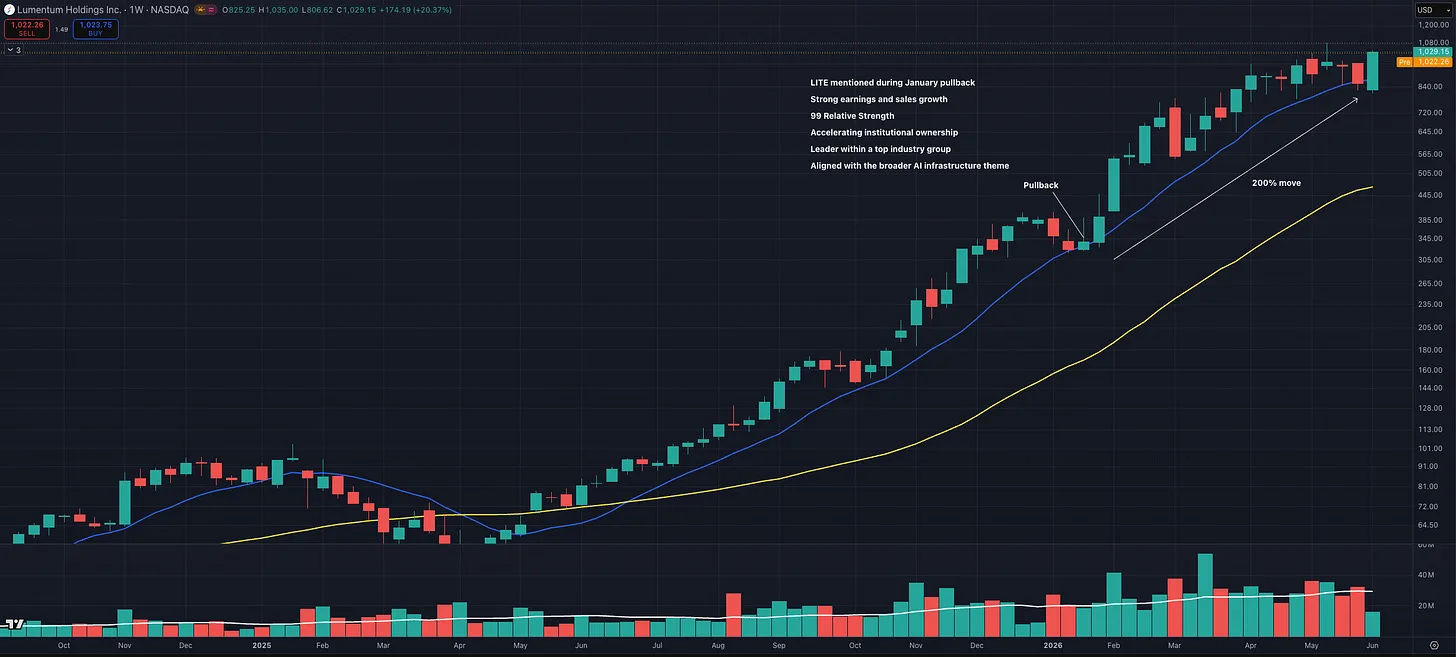
For example, Lumentum (LITE) carried a 99 Relative Strength Rating during a pullback to its 50-day moving average in January. After finding support, the stock went on to advance roughly another 200%.
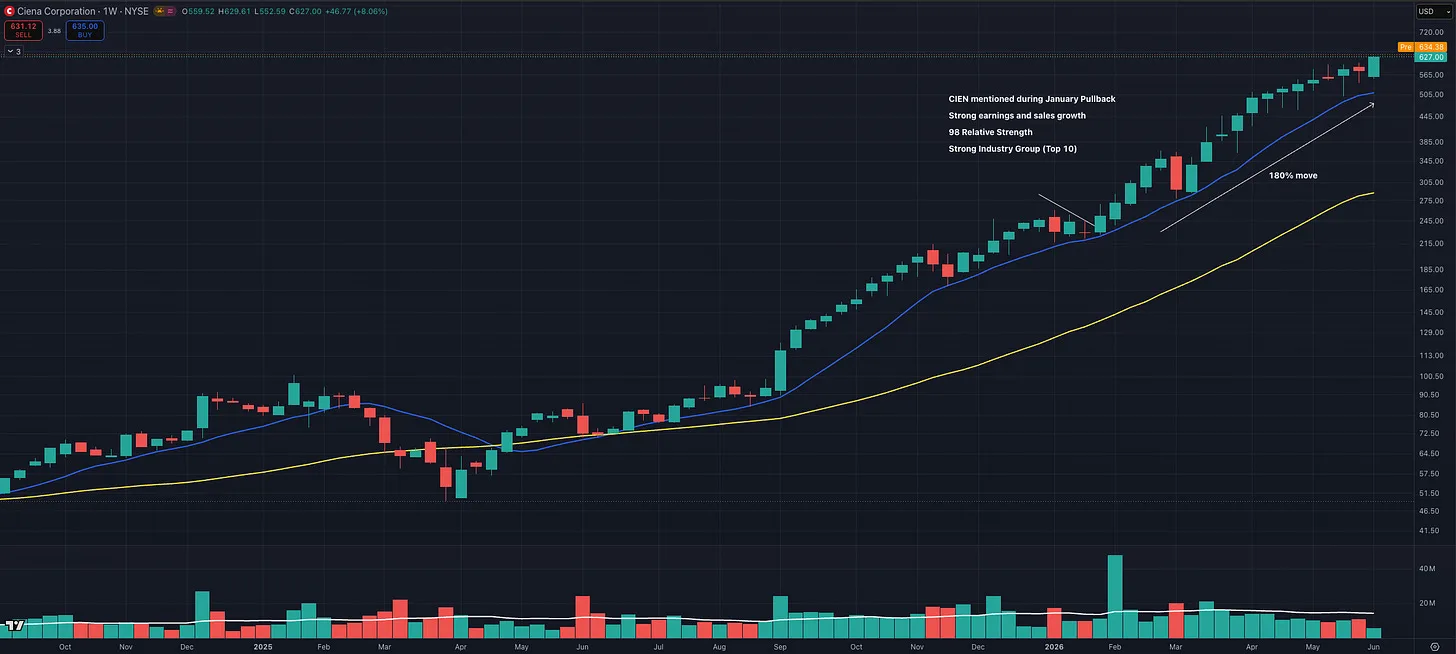
Ciena (CIEN) had a 98 Relative Strength Rating during its January pullback. The stock eventually resumed its uptrend, broke out to new highs, and advanced approximately 180%.
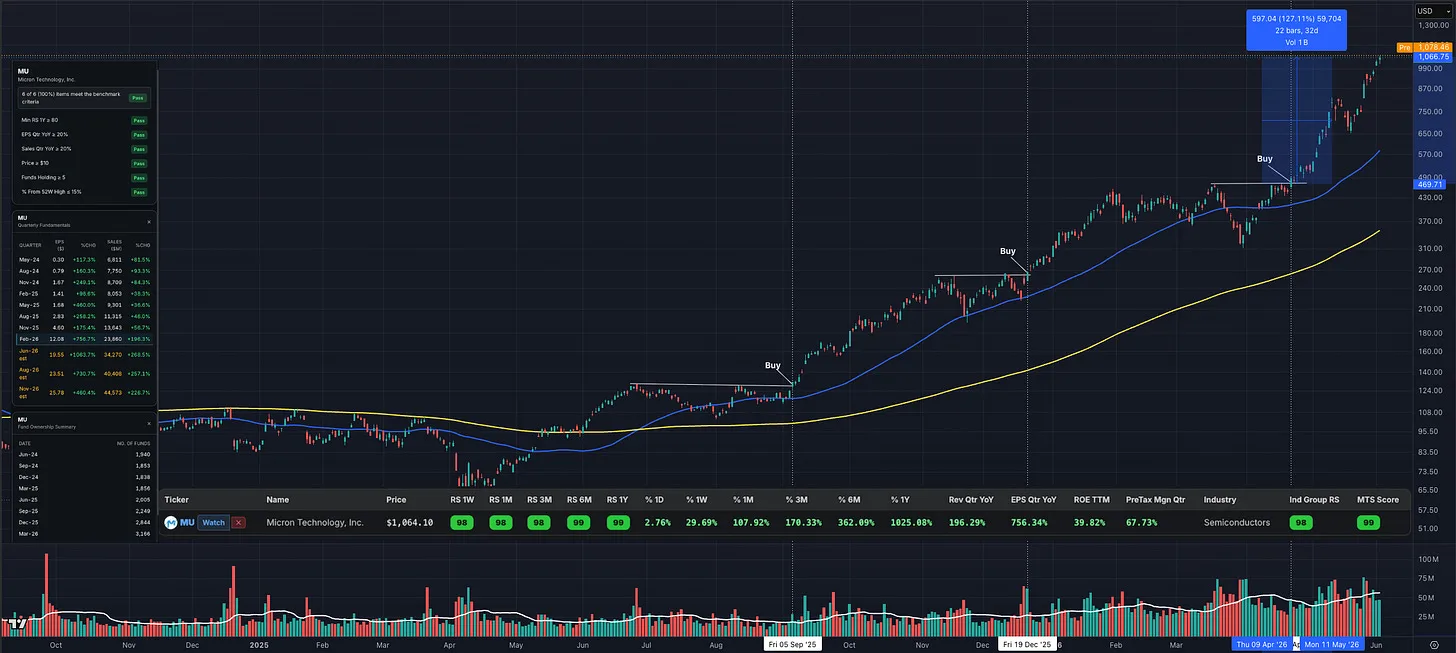
Micron (MU) is another example. It was one of the names we had been tracking for months before its April 22 buy point. The stock had already demonstrated exceptional relative strength, yet it still provided investors with ample time to recognize the setup, plan the trade, and participate in the move. Since that buy point, the stock has advanced more than 125%.
High relative strength does not necessarily mean a stock is too late. In many cases, it means the stock is doing exactly what future leaders tend to do: outperforming the market while building the next setup.
Rather than asking whether a Relative Strength Rating is too high, a better question is whether the stock is displaying constructive price action and creating a favorable risk-reward entry opportunity. Many of the market’s biggest winners had very high relative strength ratings long before their largest advances occurred.
The Goal Is Not Prediction
After everything discussed in this article, it is worth saying something simple: sometimes the best screen is still relative strength.
If I could only use one screen for the rest of my trading career, it would probably be relative strength. Many of the biggest winners are found by simply identifying the stocks that are already outperforming the rest of the market, then studying their price action, setups, and risk/reward from there. That is the foundation of what I teach in Module 5 of the Momentum Trading Strategy Course.
Many traders believe successful investing is about predicting the future. My experience has been the opposite.
I am not trying to predict which stocks will become the next major winners. I am screening for the characteristics that the biggest winners have historically displayed, then letting the market confirm the story through price action.
Those characteristics include strong earnings growth, strong sales growth, powerful relative strength, leadership inside strong industry groups, accelerating fund ownership, repeated new highs, and healthy price and volume action. These traits have appeared repeatedly throughout stock market history, and they continue to appear in today’s market.
When a stock works, I look for ways to add and give it room to continue working. When a stock fails, I cut the loss quickly and reallocate capital toward what is working or other opportunities. We do not to be right about every stock, but we strive to stay aligned with the stocks that are proving themselves and avoid getting trapped in the ones that are not.
Many of the big winners I have been involved with, including SNDK, LITE, MU, and others, were not obvious at the time. I did not know which ones would ultimately work out the best or produce the largest moves. I only knew they were displaying many of the same characteristics used by the great traders and investors I studied, and that those characteristics have continued to show up year after year in many of the market’s strongest stocks.
Trust the process.
If you want to learn more about how I screen for stocks, build watchlists, manage risk, and trade leading stocks, get access to the Momentum Trading Strategy Course: The 100-Year Playbook Behind the Biggest Winning Stocks.
More in Strategy & Tactics
All Strategy & Tactics articles →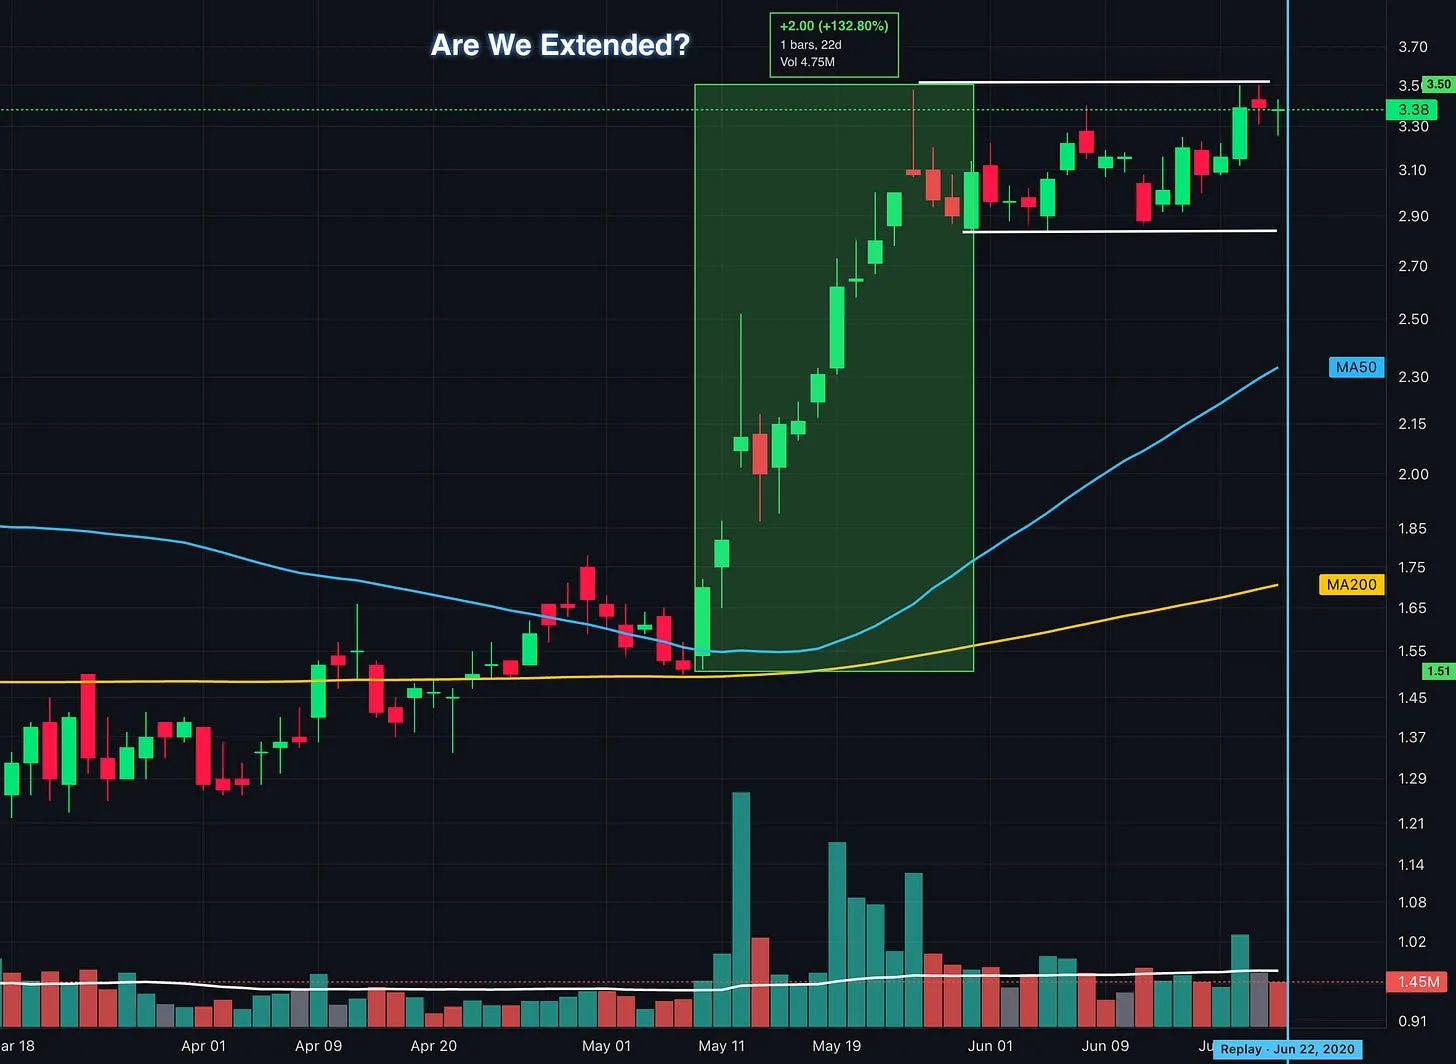
Oct 8, 2026 · Strategy & Tactics
Up 100% and Still Buyable? What Traders Get Wrong About Extended Stocks
How to identify proper buy points, avoid chasing stock breakouts, and manage entry risk using lessons from William O’Neil, Mark Minervini, David Ryan, and Dan Zanger.
- Momentum Trading
- VCP
- position trading
- Growth Stock Trading
- David Ryan
- Flag Pattern
- chart patterns
- Cup and Handle
Sep 27, 2026 · Strategy & Tactics
Should You Follow Leading Stocks or Wait for Market Confirmation?
How to read the market, industry groups, and individual stocks together so you can recognize opportunities, build exposure, and respond when conditions change
- growth stocks
- CANSLIM
- Trading
- position trading
- Stan Weinstein
- William O'Neil
- Momentum Trading Strategy
- Trade stocks
Sep 25, 2026 · Strategy & Tactics
Stage Analysis: How to Spot Stage 3 in Real Time
Recognize a developing Stage 3 using Stan Weinstein’s framework, with real chart examples, warning signs, and lessons for protecting your gains
- Momentum Trading
- Nasdaq
- technical analysis
- CANSLIM
- position trading
- Stan Weinstein
- QQQ
- Find True Market Leaders