What Is Relative Strength and Why Is It So Important?
Many new traders, or people unfamiliar with relative strength, confuse it with RSI.
They are completely different.
RSI is an oscillator. It moves between 0 and 100 and is often used by traders to identify overbought or oversold conditions.
Relative strength, popularized by William O’Neil and Investor’s Business Daily, is completely different.
It is not asking:
“Is this stock overbought?”
It is asking:
“Is this stock outperforming the market and outperforming almost everything else?”
That is a much more important question.
William O’Neil said it best:
“I rarely pay attention to overbought/oversold indicators.”
And many Market Wizards have expressed a similar idea in one way or another.
The strongest growth stocks can stay “overbought” for long periods of time.
That is often what they do when they are under real accumulation.
They get strong.
They stay strong.
They keep making new highs.
And while everyone else is worried that the stock is “overbought,” the real leaders keep leading.
So that is why we do NOT care about RSI.
That is why relative strength is so valuable.
A true RS Rating is not just telling you whether a stock is moving up.
It is telling you how that stock is performing compared to a benchmark index, usually the S&P 500, and then how it ranks against all the other stocks in the market.
A 99 RS Rating means the stock is beating the market and outperforming almost everything else. It is in the top 1%.
A 90 RS Rating means it is in the top 10%.
A 50 RS Rating means it is roughly middle of the pack.
A low RS Rating means the stock is lagging badly.
Remember, as growth stock investors and momentum traders, we are:
Not looking for cheap.
Not looking for oversold.
We are looking for leadership.
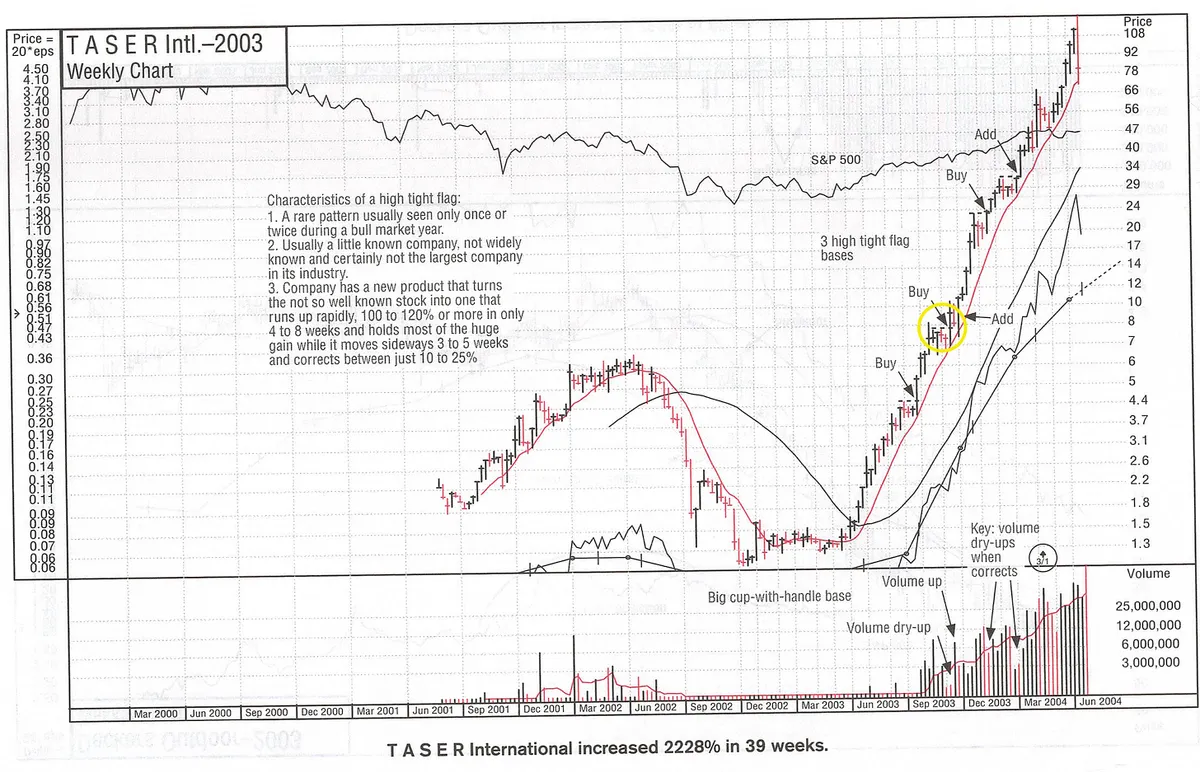
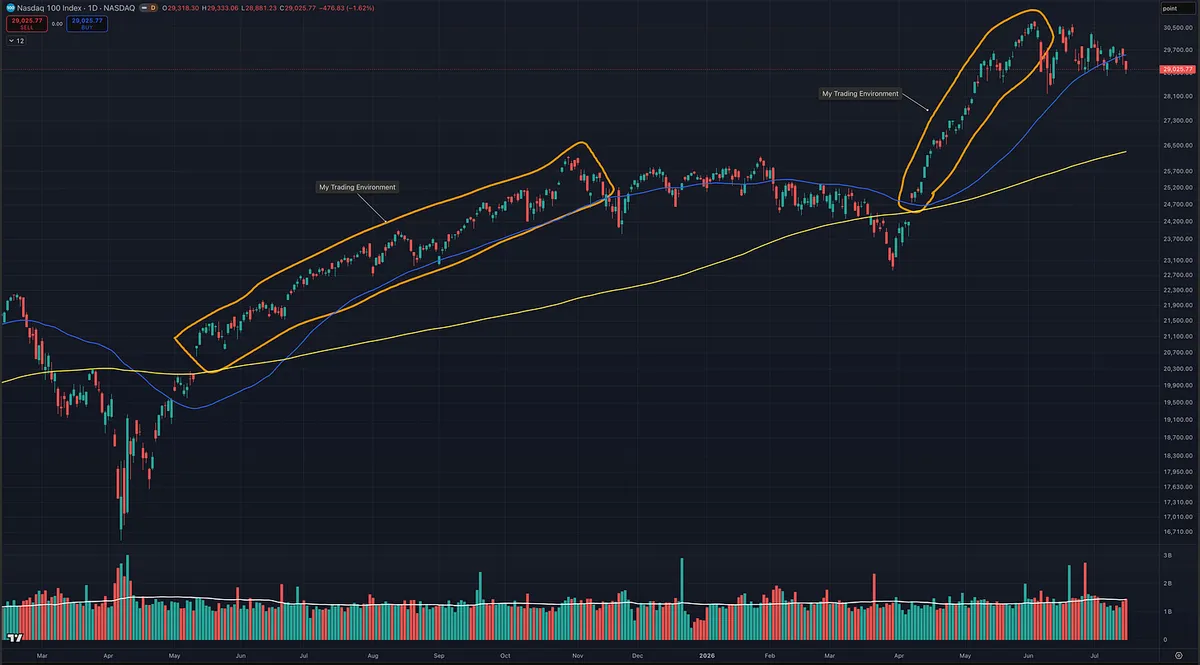
The biggest winning stocks usually show strong relative strength before and during their major advances.
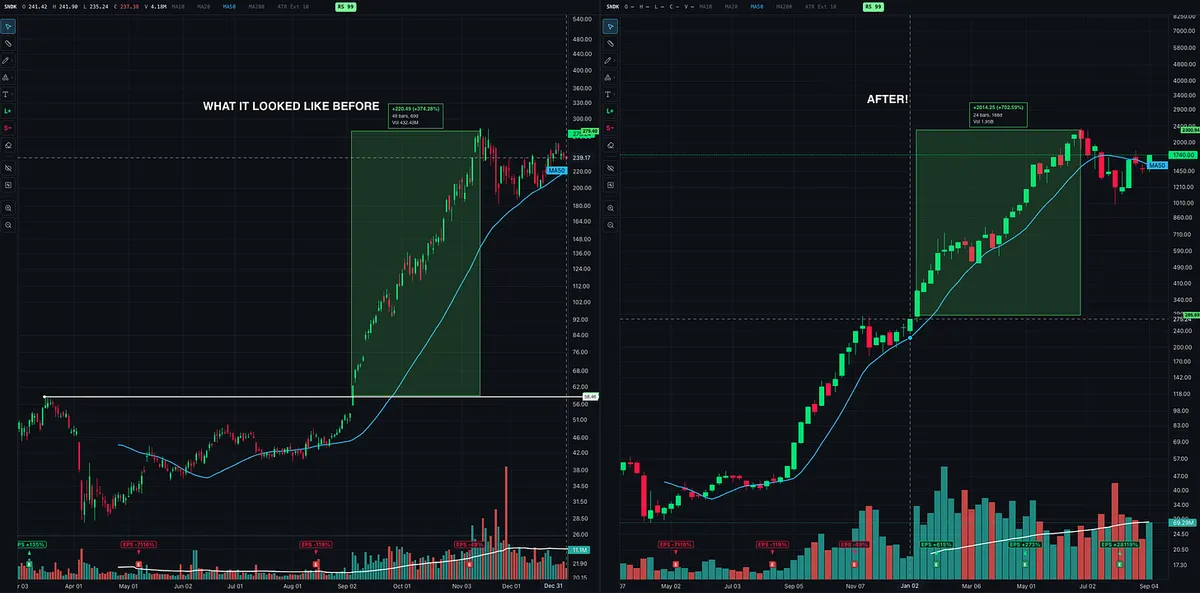
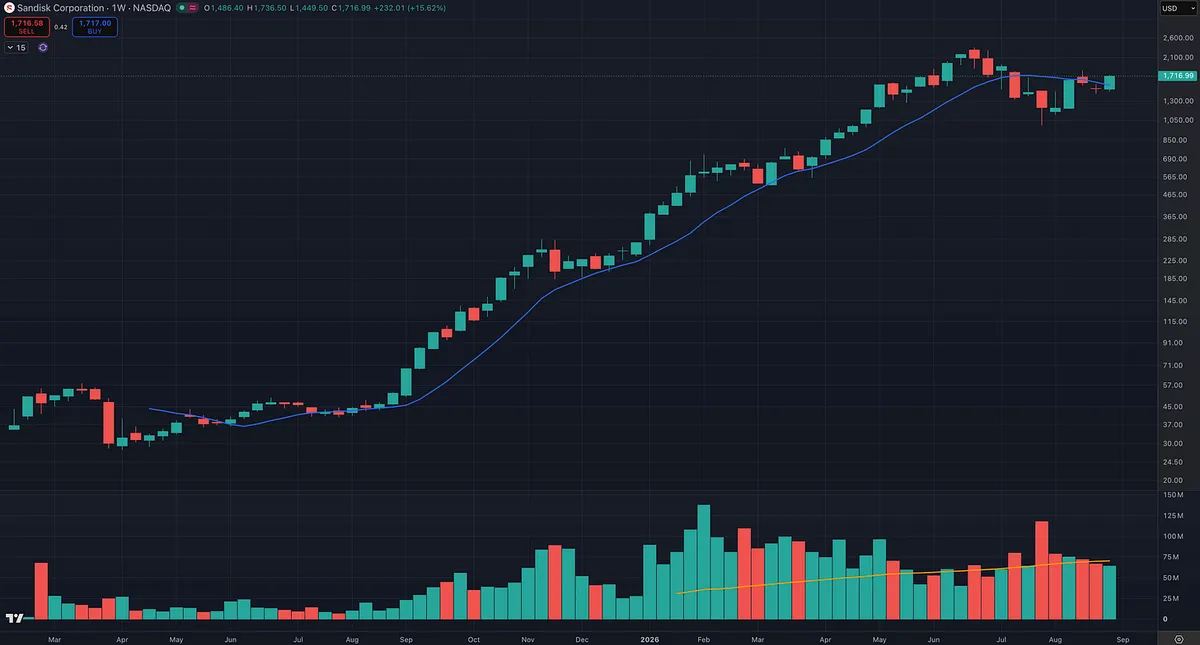
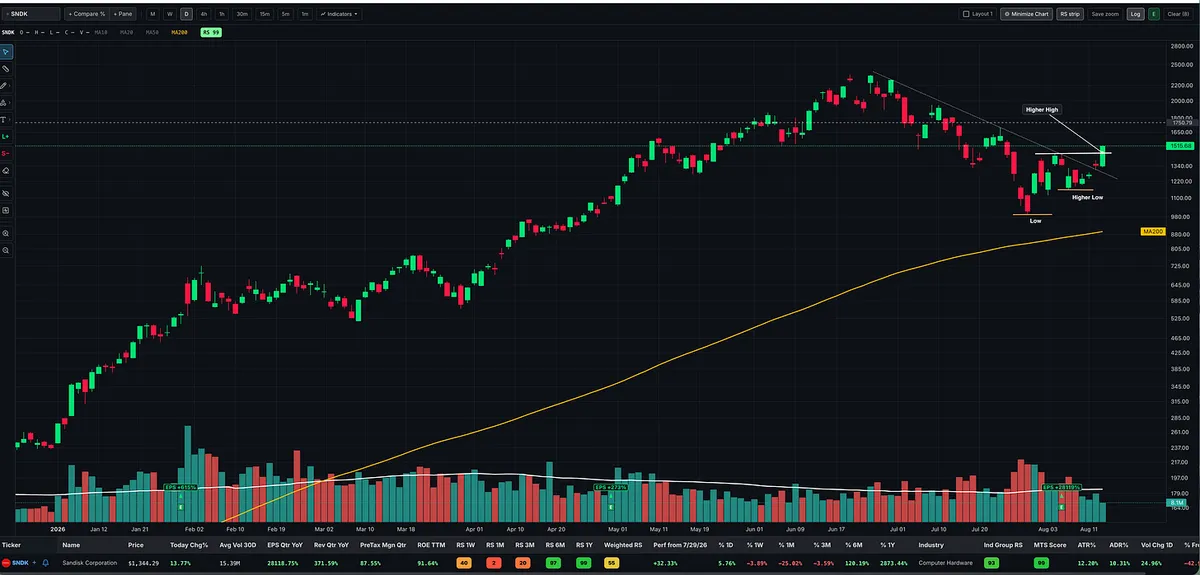
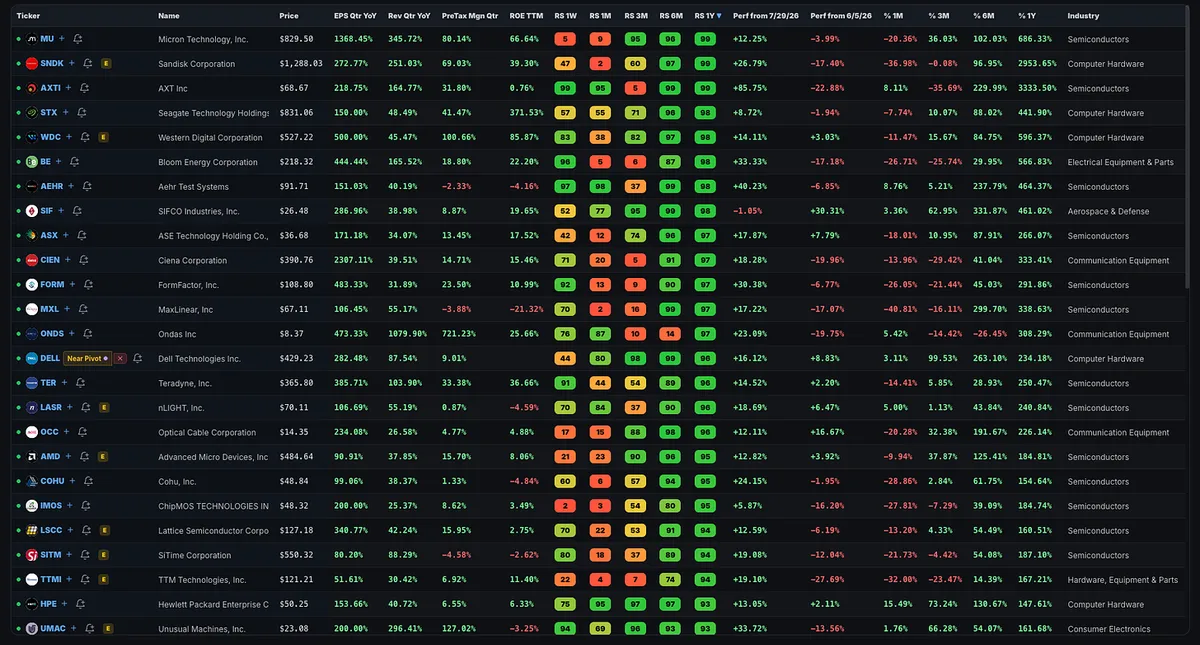
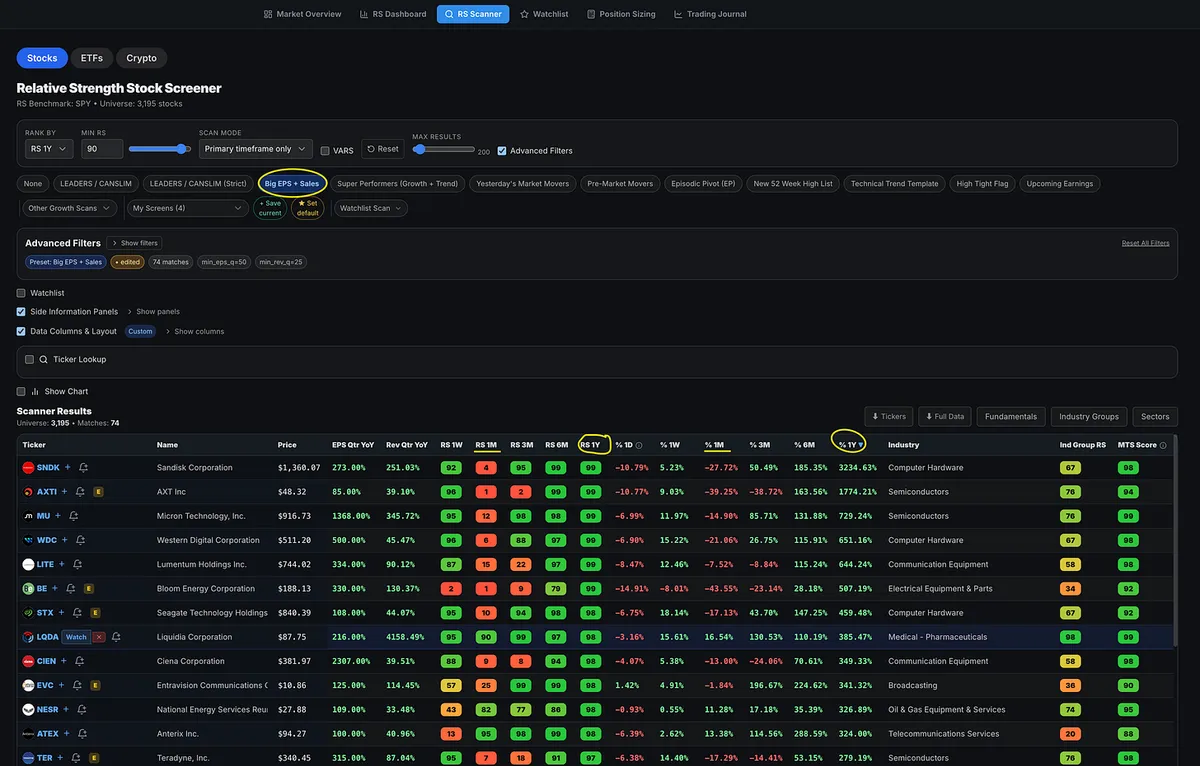
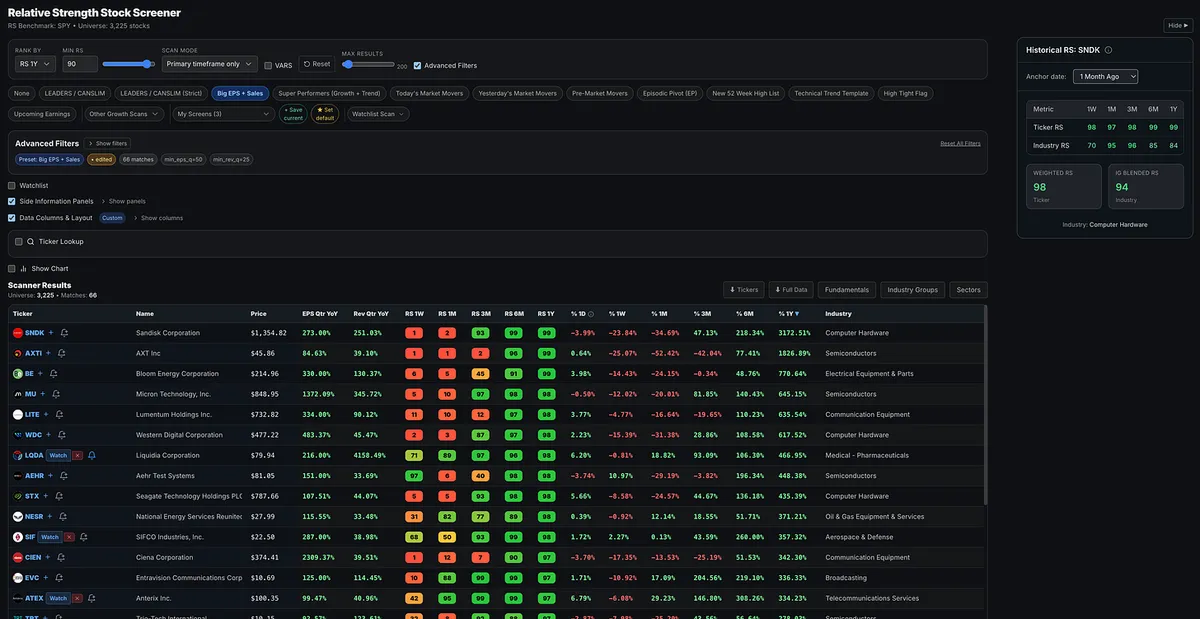
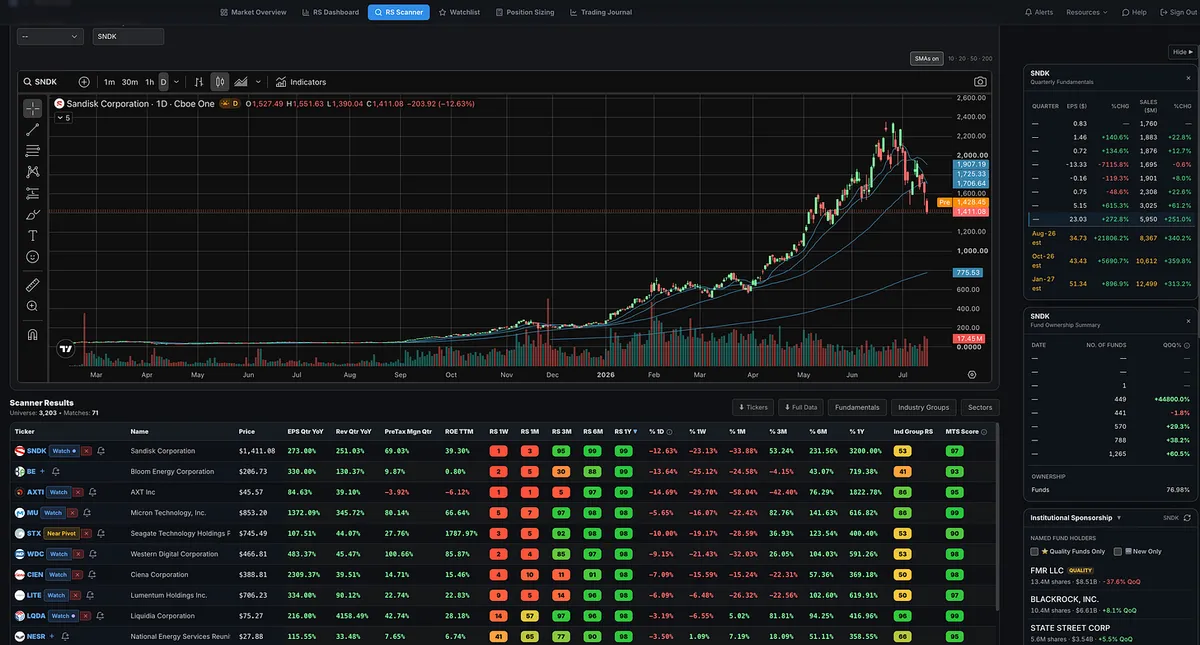
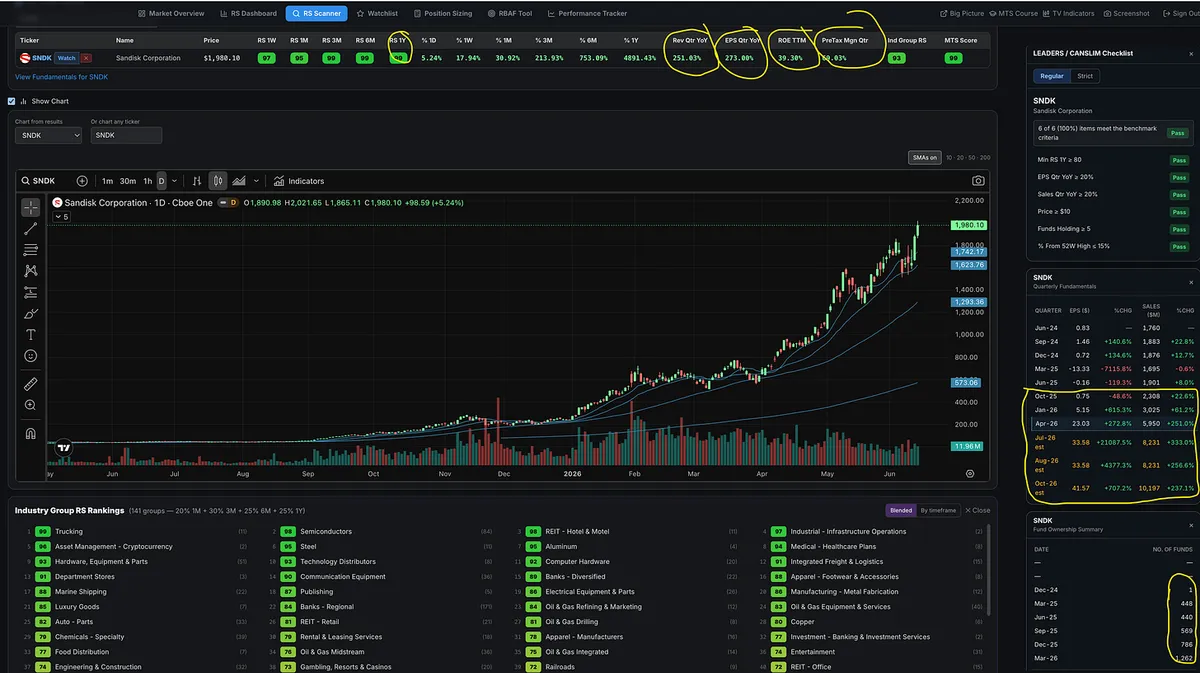
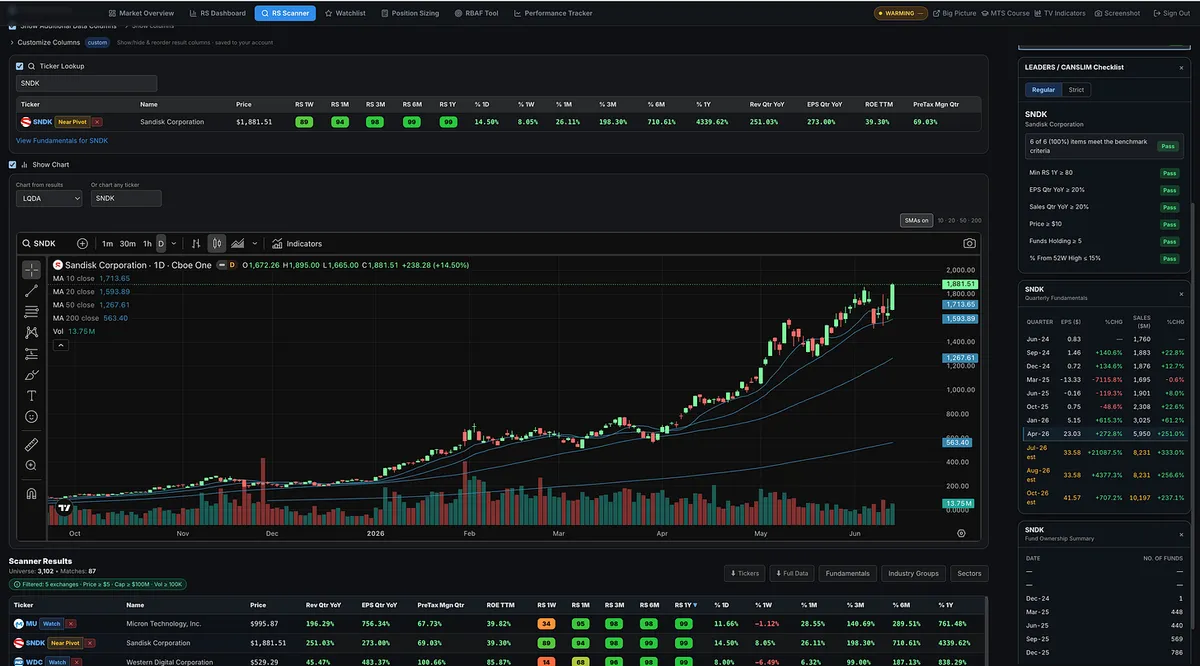
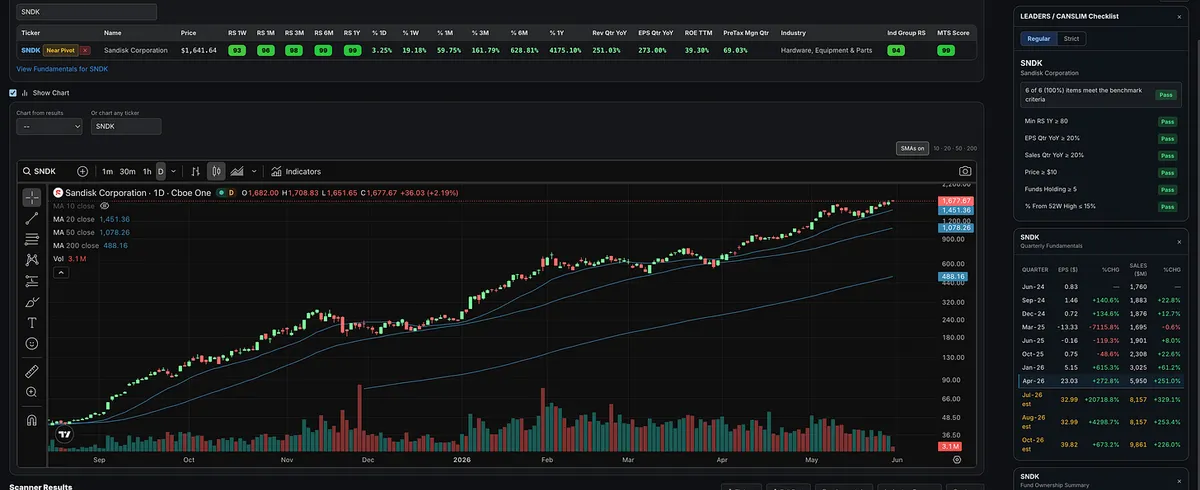
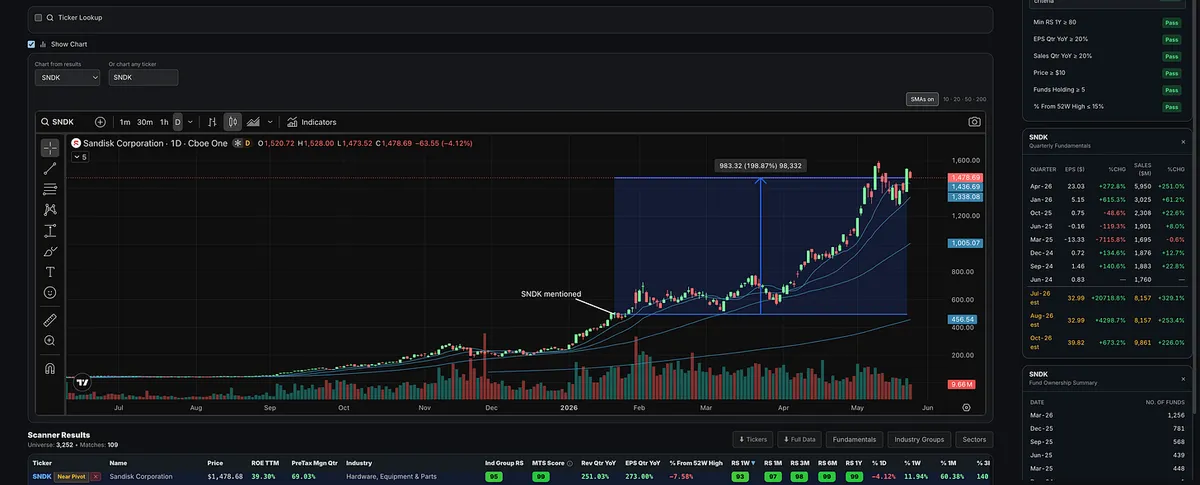
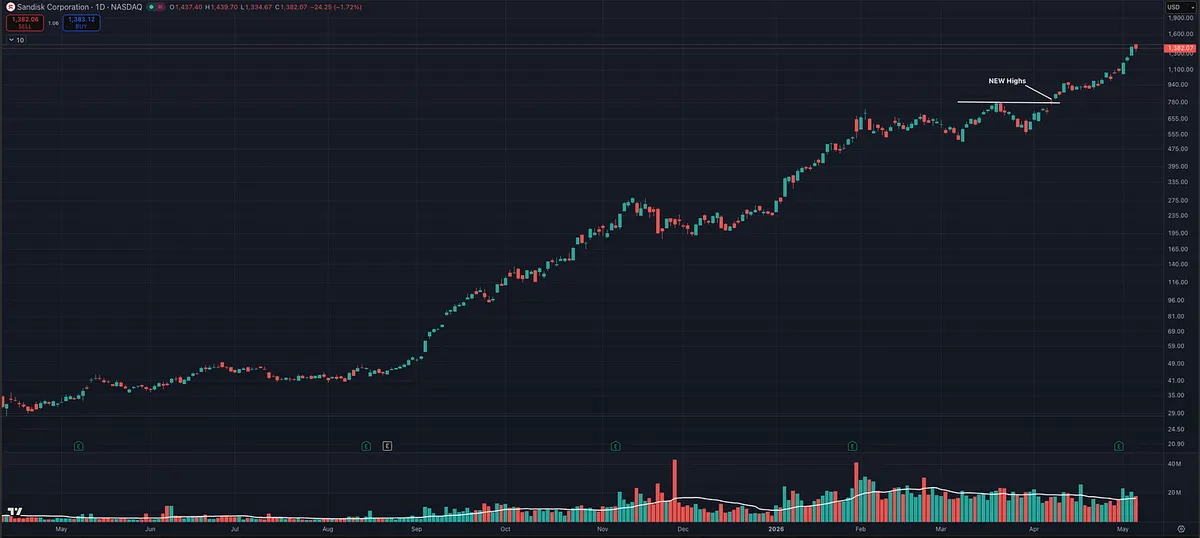
A stock can have an RS Rating of 80, 90, or 99 and still move hundreds or even thousands of percent. SNDK had a 99 RS Rating at the start of the year and moved another 300%.
They hold up better during market pullbacks.
They recover faster.
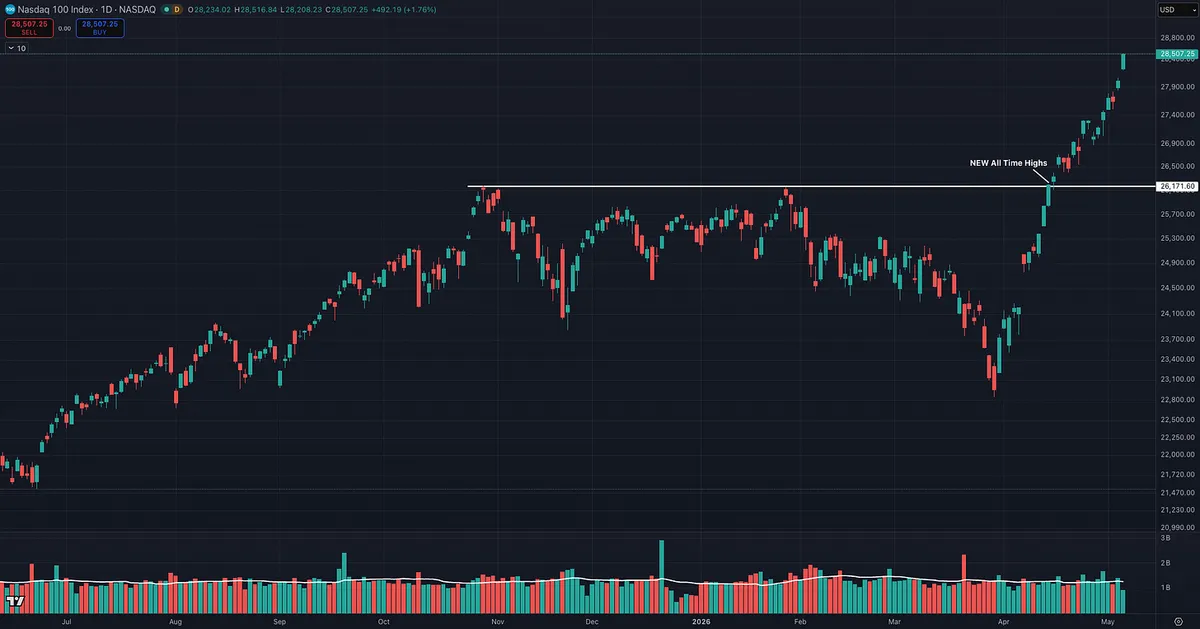
They push toward new highs while weaker stocks are still stuck below resistance.
RSI does not tell you that.
Relative strength does.
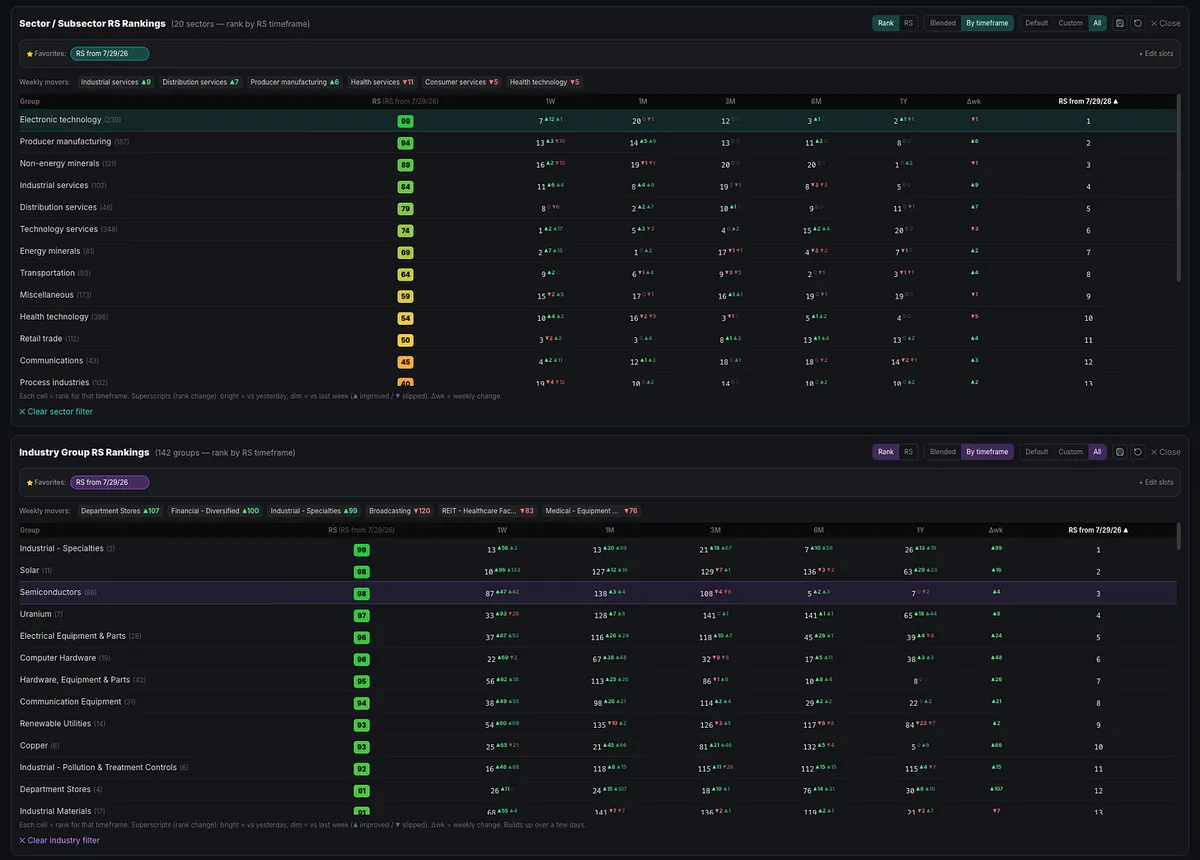
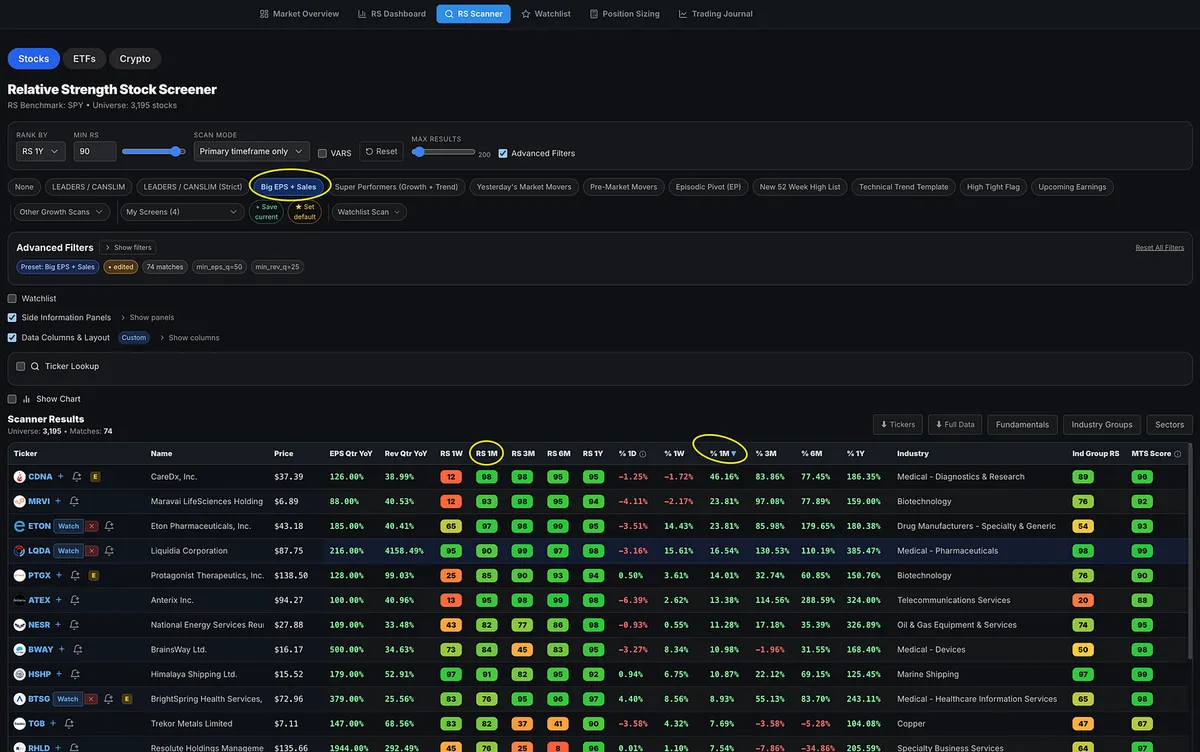
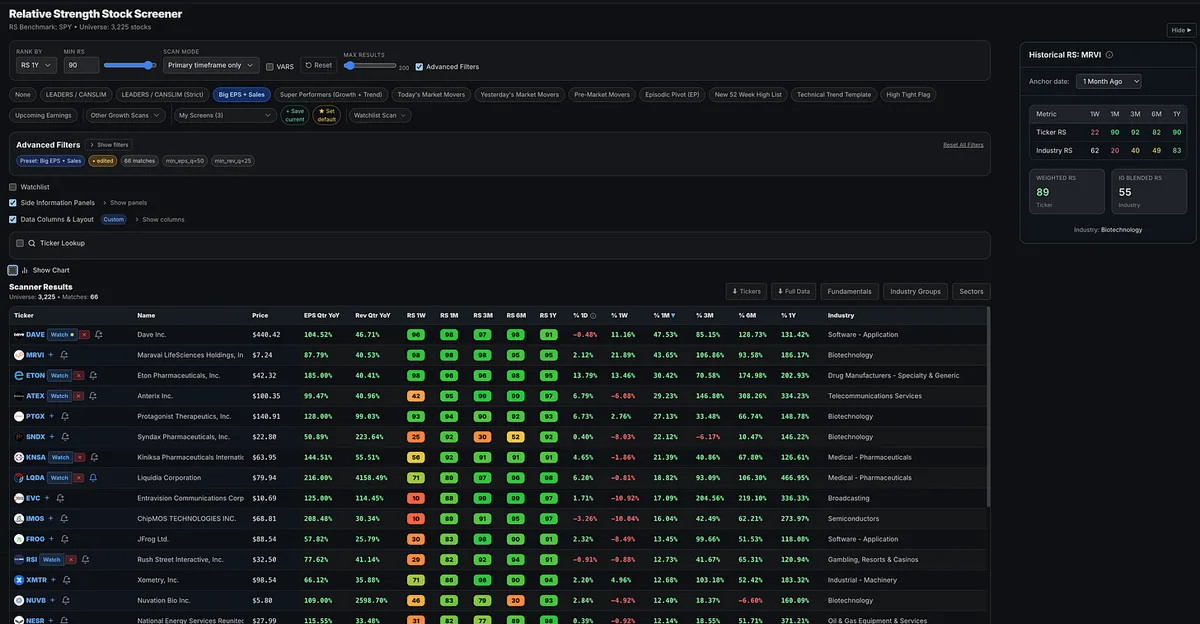
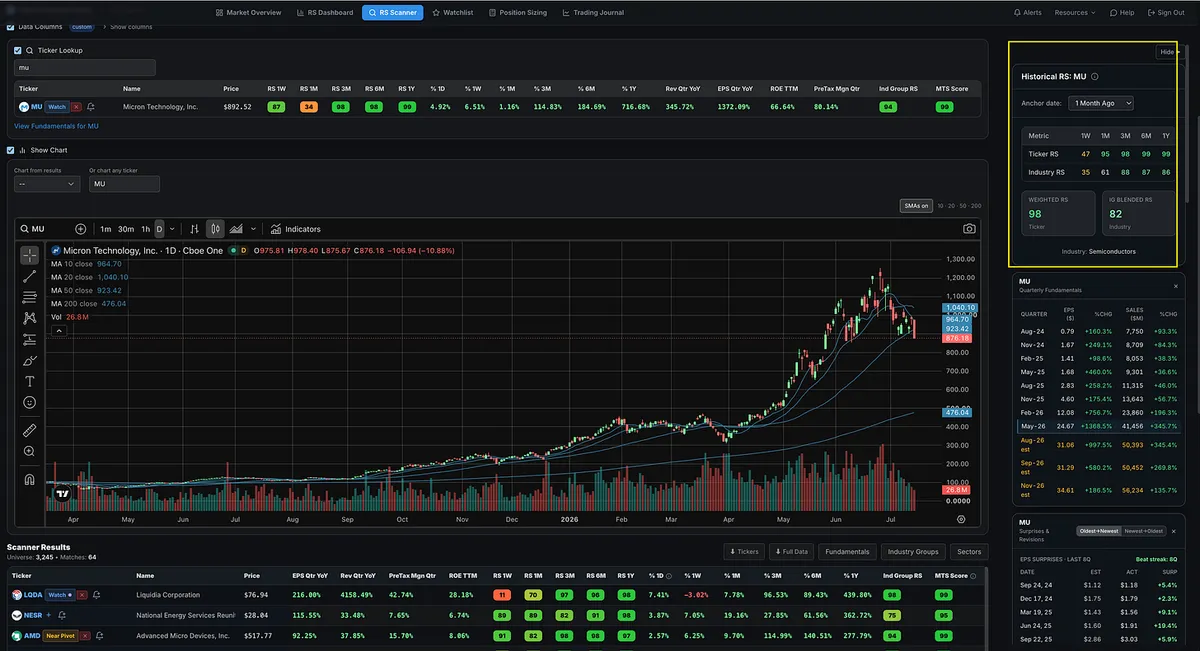
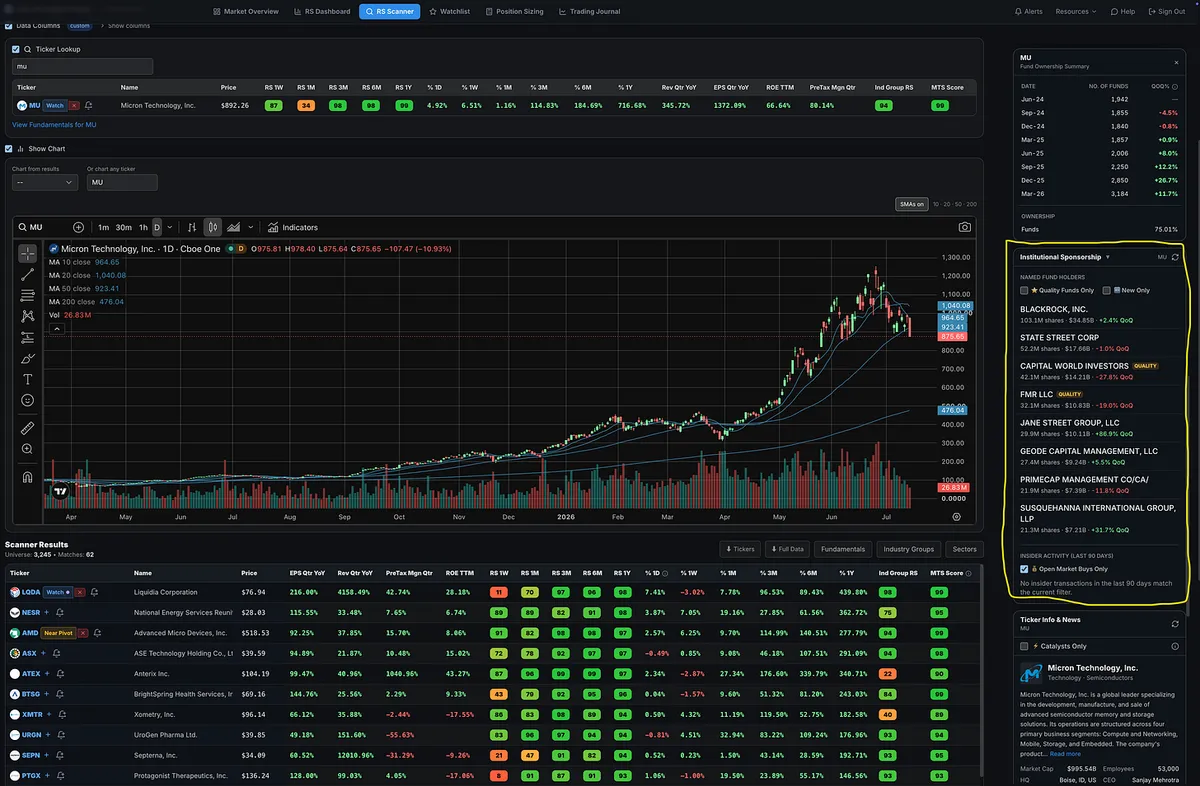
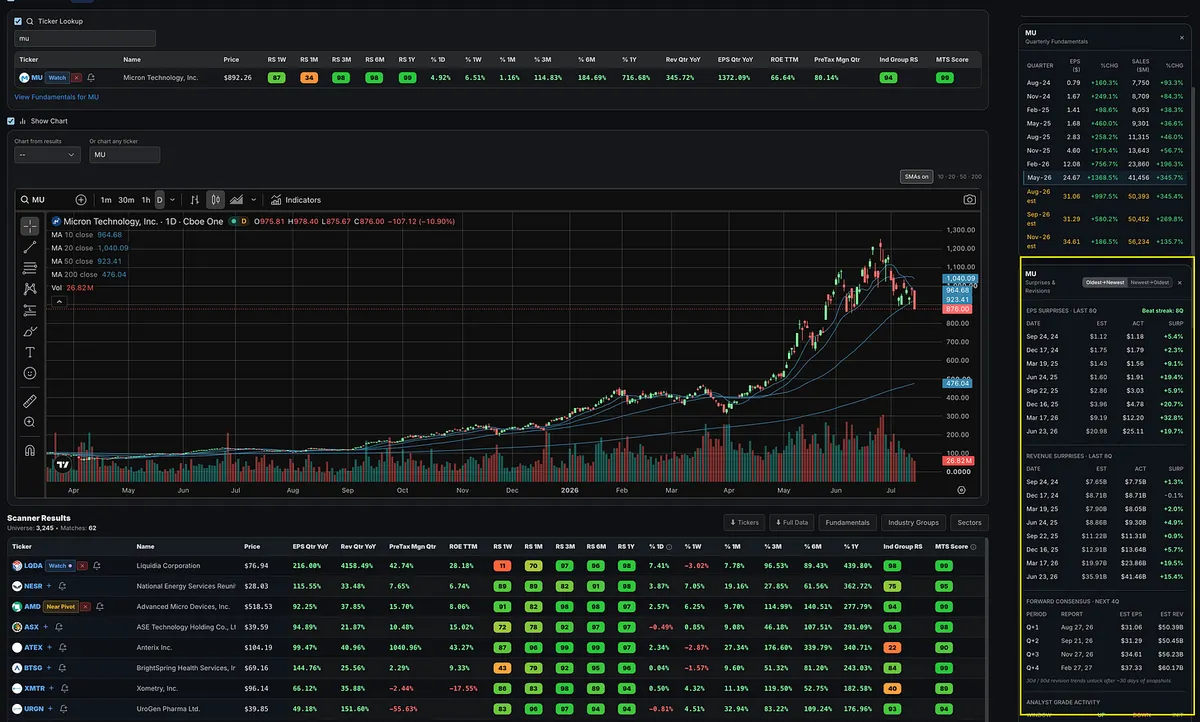
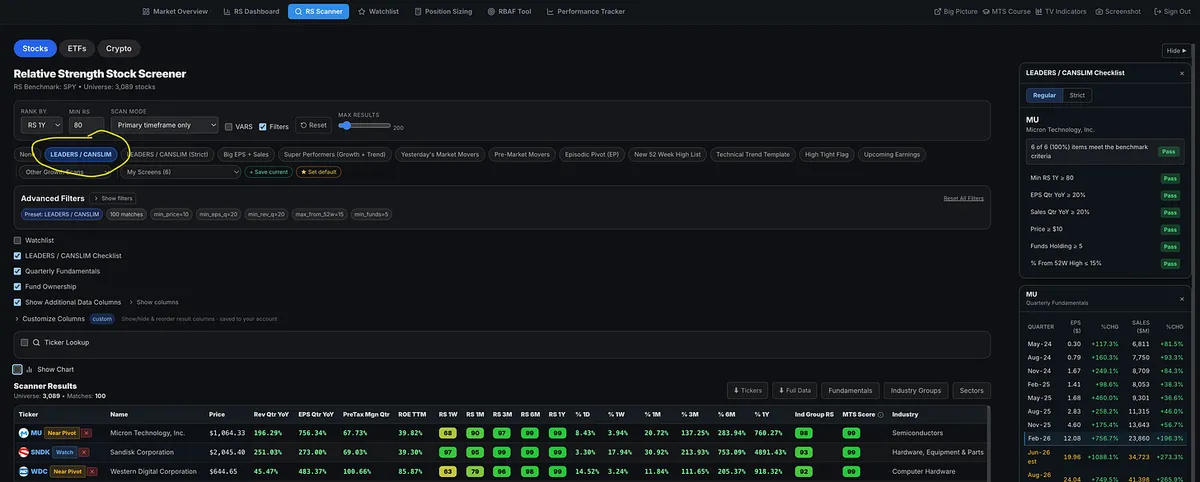
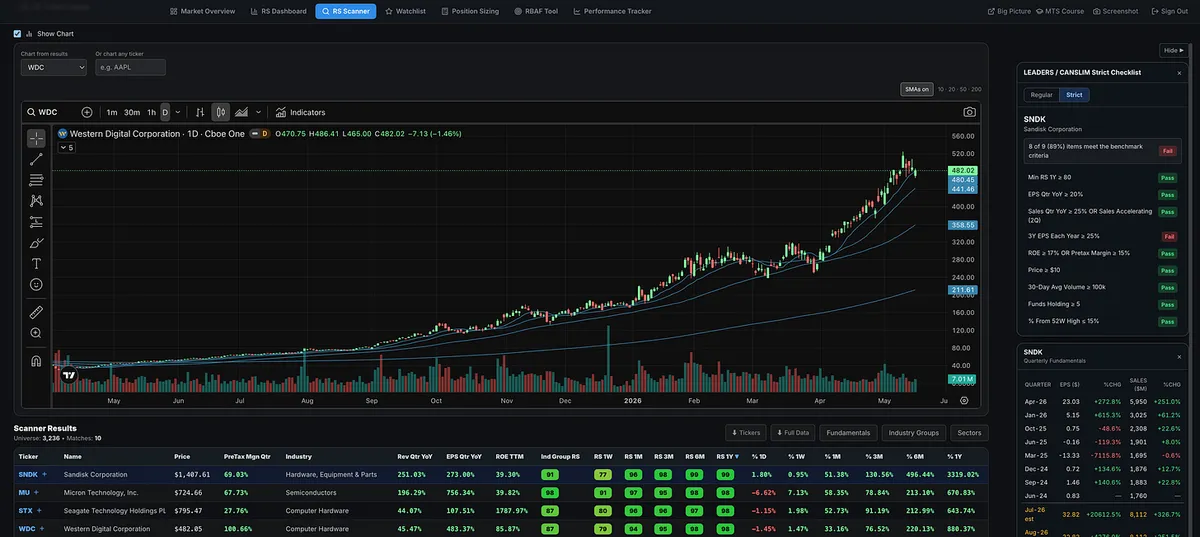
Inside the Momentum Trading Strategy Software, I break relative strength down across multiple timeframes, including 1 week, 1 month, 3 months, 6 months, and 1 year.
We also have functionality to set a minimum RS level across all timeframes, see what is accelerating and getting stronger, and see what is decelerating and losing strength.
That way, you are not stuck looking at one blended number.
You can see whether a stock is showing short-term strength, intermediate-term leadership, long-term leadership, or all three.
The goal is:
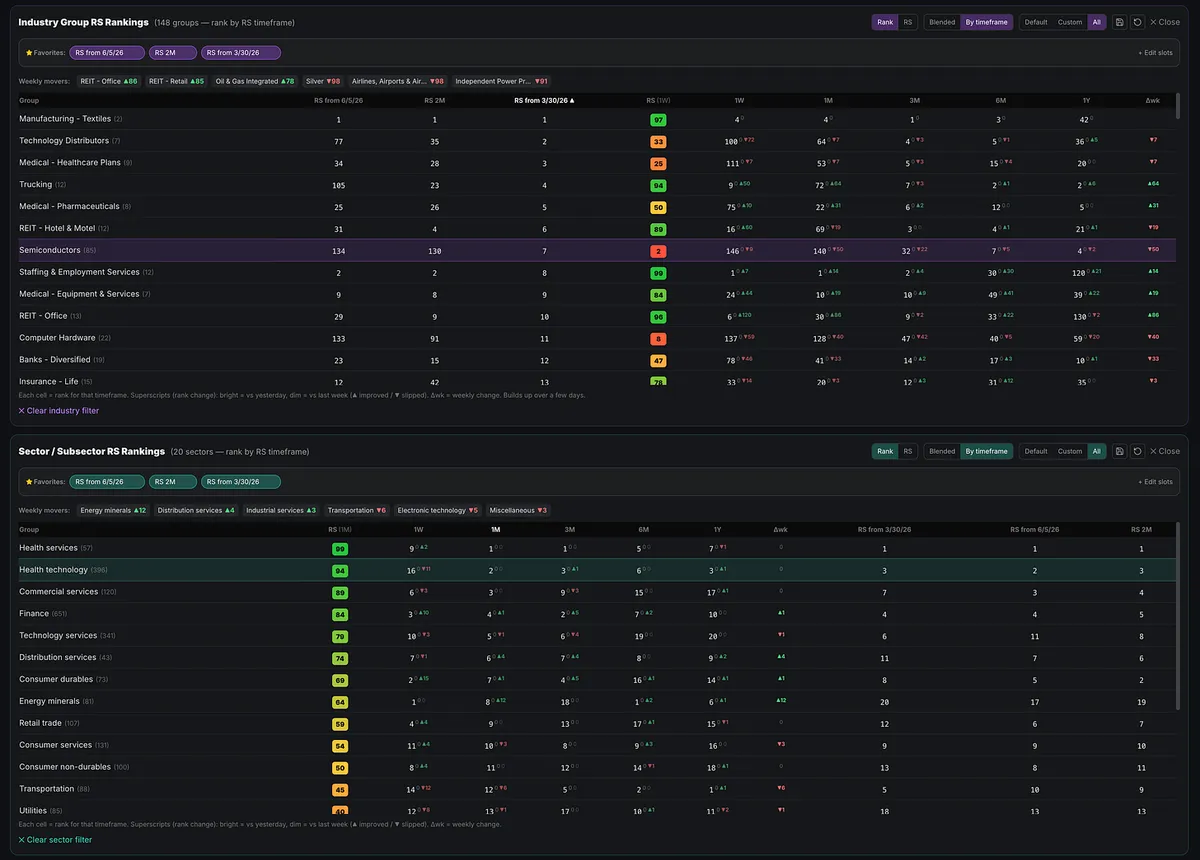
Find the strongest stocks in the strongest areas of the market.
Relative strength helps you do that.