LITE Is Lighting Up Again.
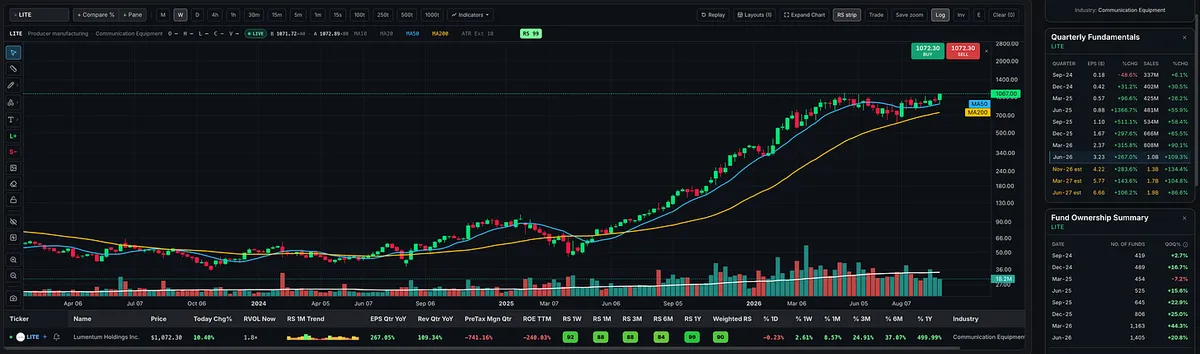
$LITE was a huge name for me in 2025 and early 2026. Now it’s back near all-time highs and up over 10% so far today.
Notes
What to buy: how to find, screen and rank the strongest stocks and industry groups.
Showing 1–20 of 20 notes
$LITE ×LITE Is Lighting Up Again.
$LITE was a huge name for me in 2025 and early 2026. Now it’s back near all-time highs and up over 10% so far today.
LITE is getting interesting again.
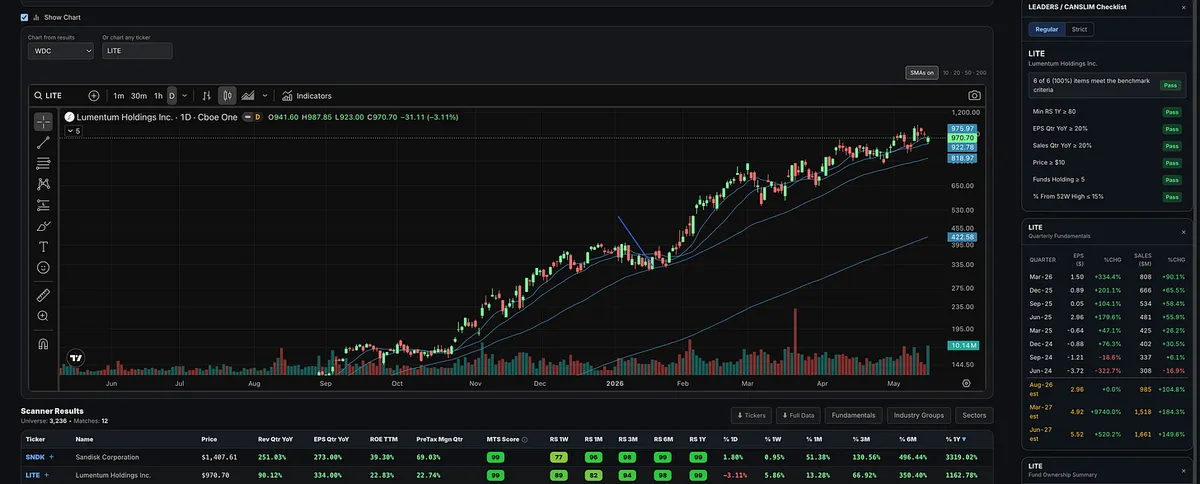
LITE rallied off its 200-day moving average when the market made its low on July 29.
Unlike a lot of the other prior big winners, it has since reclaimed its 50-day / 10-week moving average and continued to hold support. Now it sits less than 10% from all-time highs.
And the fundamentals are still extremely strong.
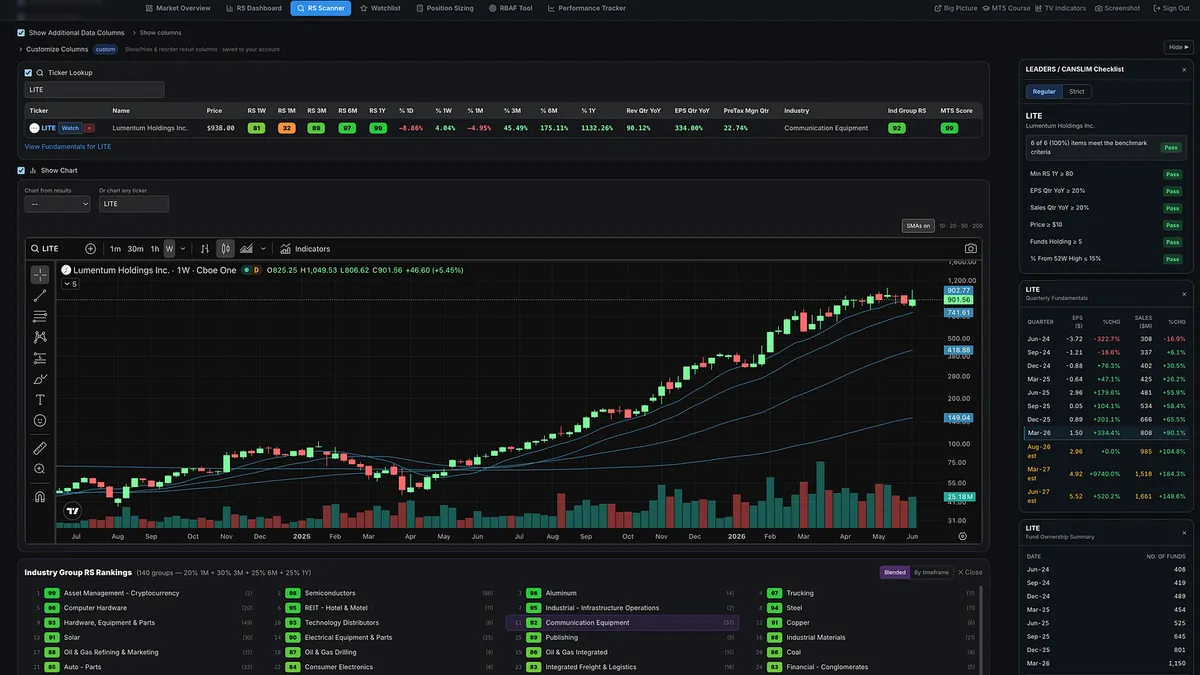
LITE has been putting up triple-digit earnings growth, triple-digit sales growth, and carries a 99 one-year Relative Strength Rating.
Institutional sponsorship has also been expanding aggressively, with the number of funds owning the stock growing roughly +20% quarter over quarter.
We saw bigger volume coming off the lows and around earnings. Then, as the stock moved sideways and found support around the 50-day, volume dried up considerably.
Yesterday, big volume came back in as LITE pushed toward the top of the consolidation.
Back in January, people told me LITE looked too volatile.
Then they missed the next roughly 100% leg higher.
They told me the same thing back in October 2025.
Welcome to growth stock and momentum trading. 😉
The biggest winners are rarely going to look comfortable.
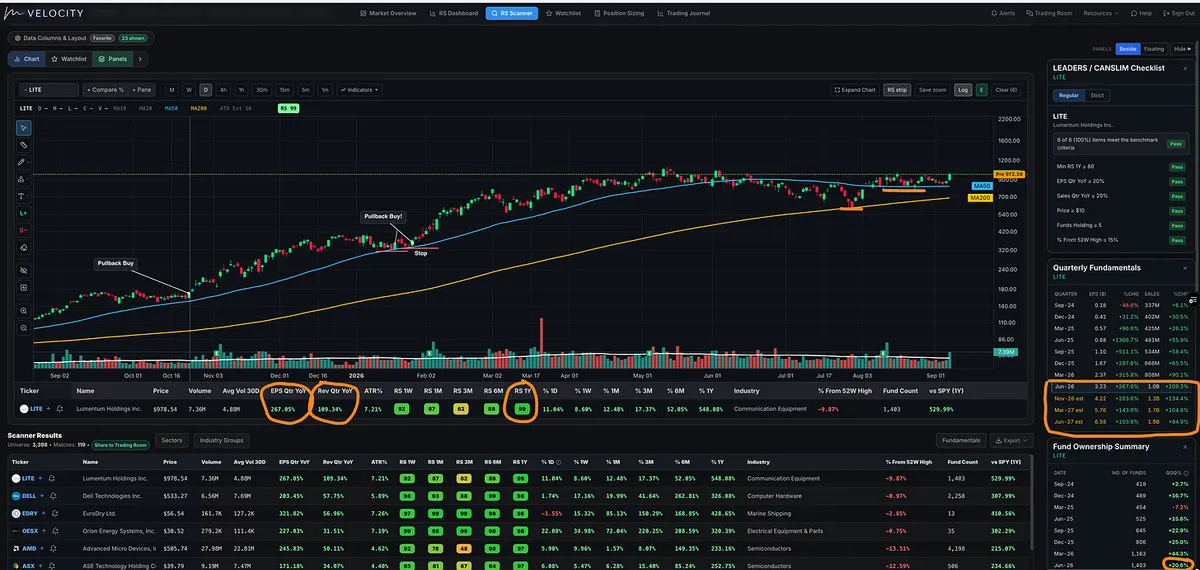
Is LITE About to Make a Comeback?
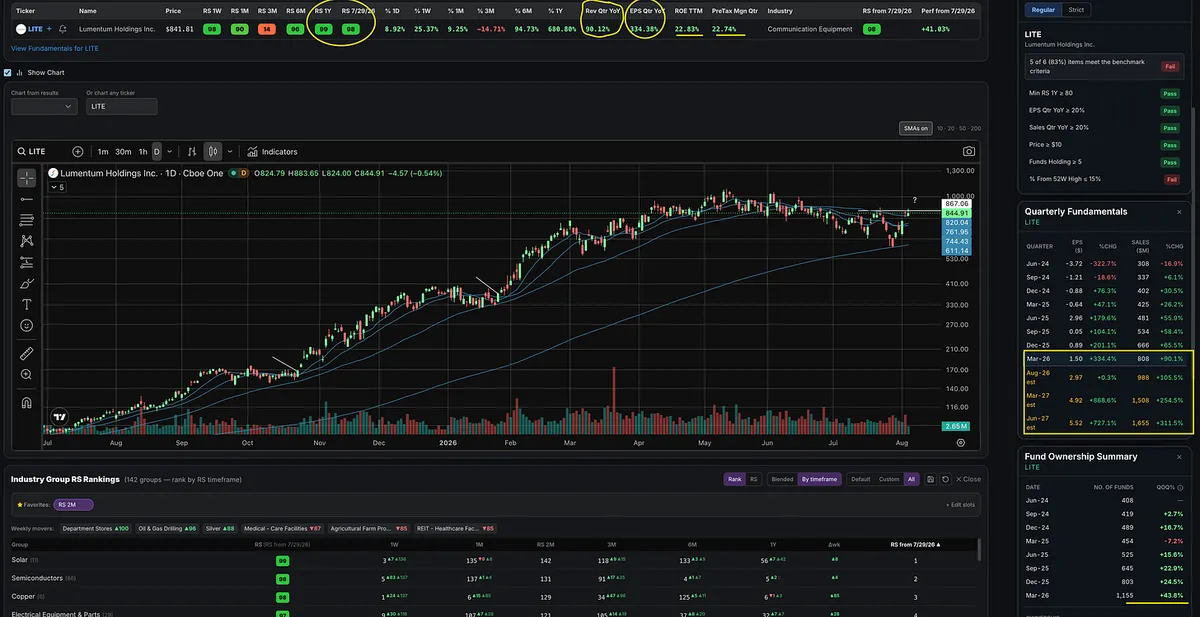
The Market Shift Was Hiding in the Screens
One of my favorite scans, and one I ran for years in MarketSurge, is the Big EPS and Sales screen. I now run the same scan inside the Momentum Trading Strategy software.
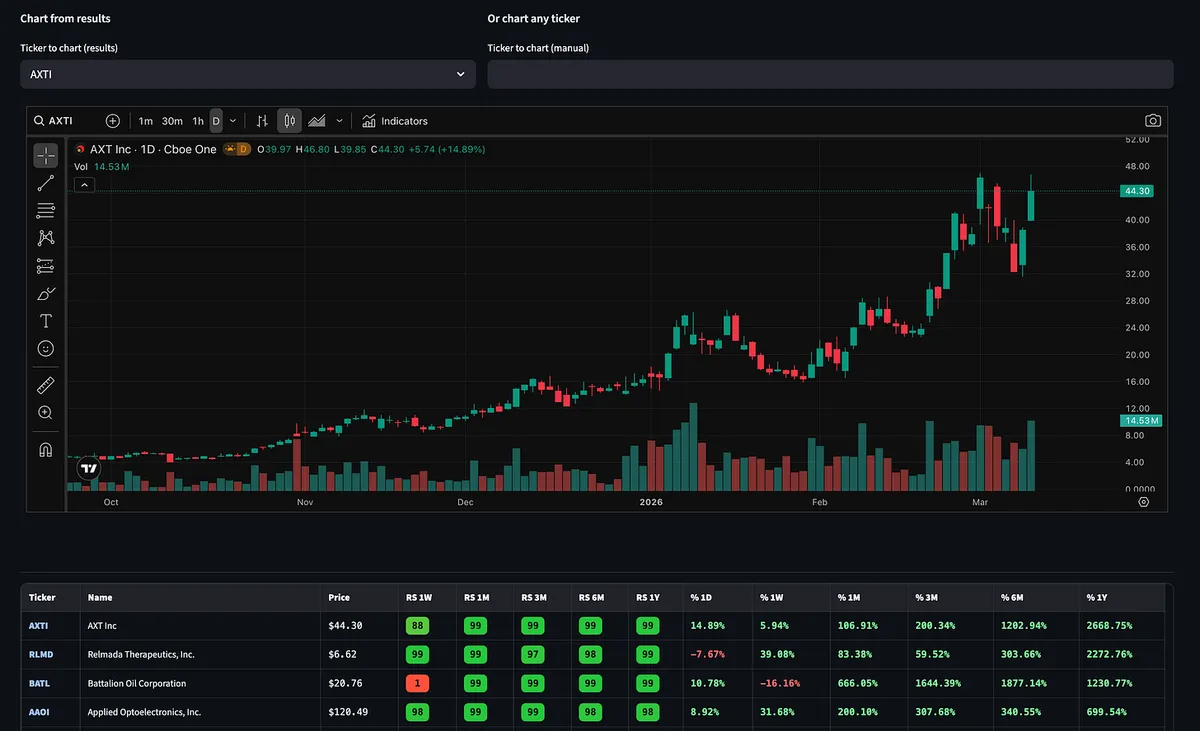
When you sort the results by one-year relative strength, the familiar leaders dominate: SNDK, MU, LITE, WDC, WTX, TER, etc.
The strongest groups are also the ones we have become accustomed to seeing: semiconductors, computer hardware, telecom, and communications equipment.
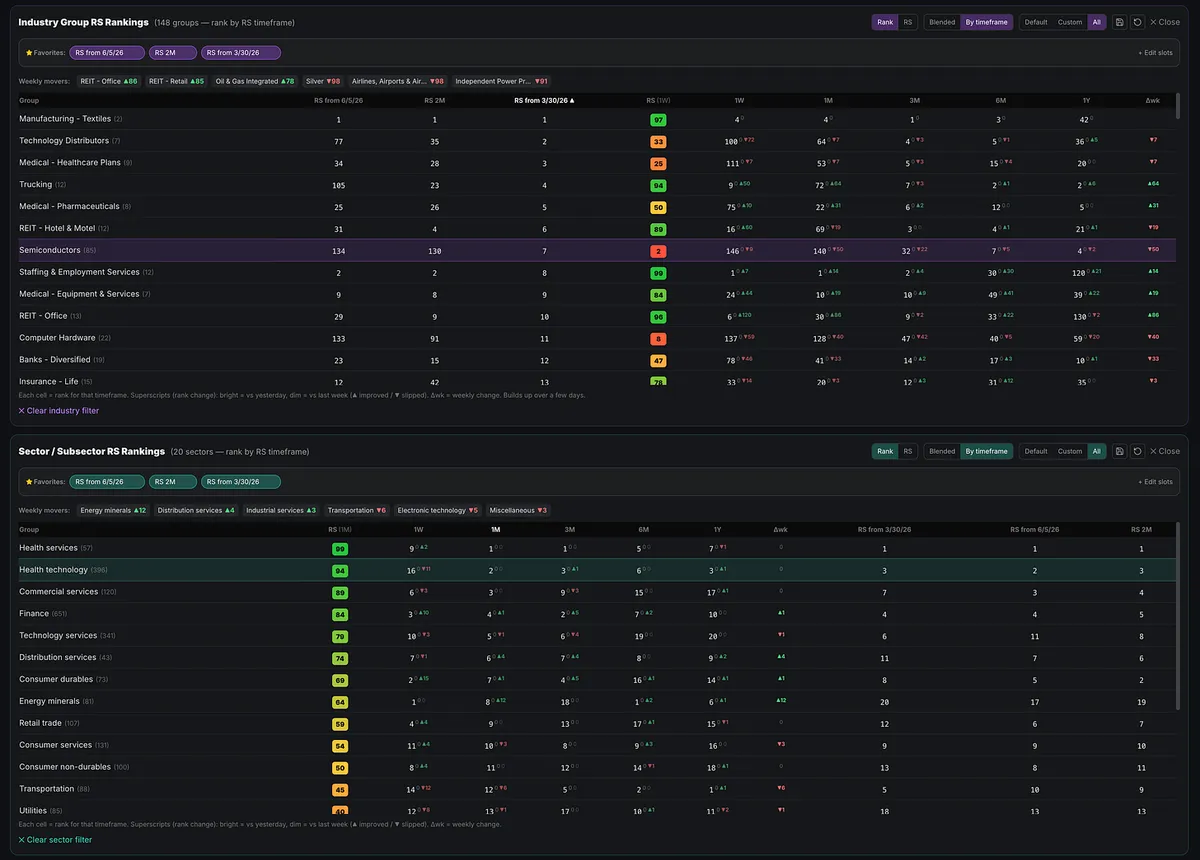
But sort the exact same screen by one-month relative strength, and the picture completely changes.
Now you see medical, biotechnology, pharmaceutical, oil and gas, and marine shipping names moving toward the top.
This shift was visible in the individual stock screens weeks ago.
When the indexes, sectors, industry groups, and individual stock screens all begin telling the same story, you are no longer guessing whether leadership is changing.
You are watching it happen in real time.
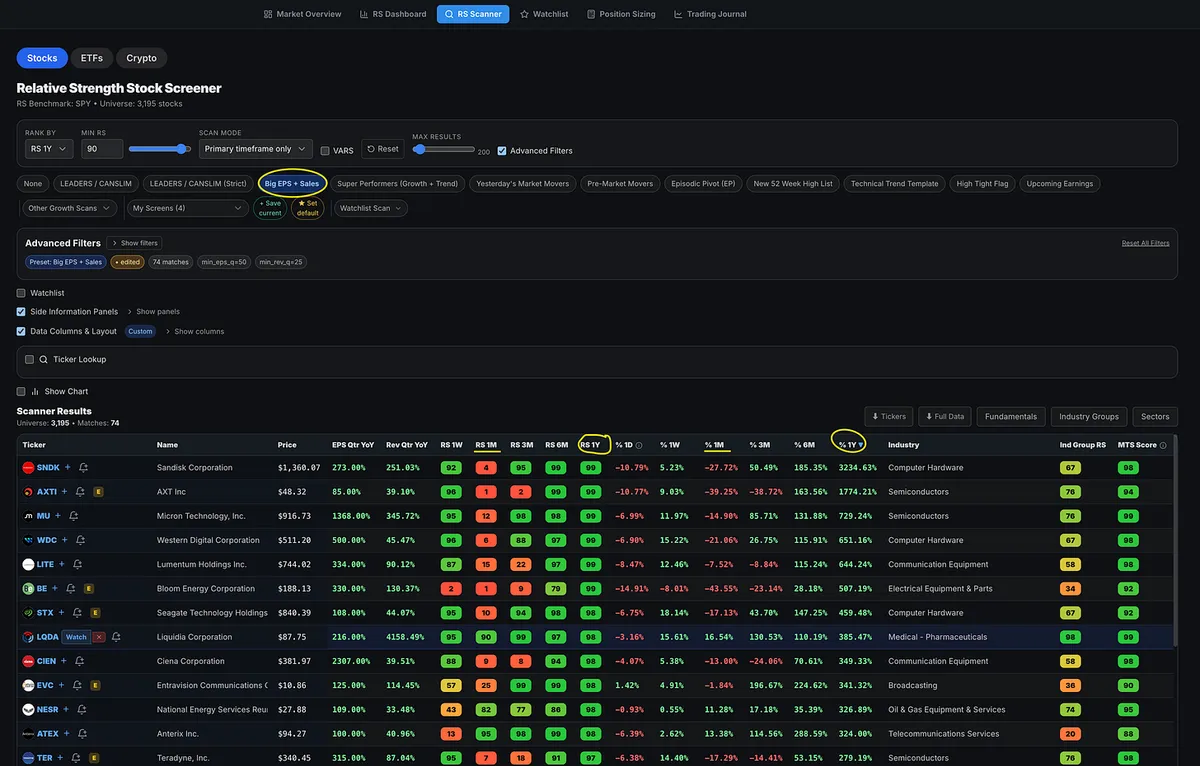
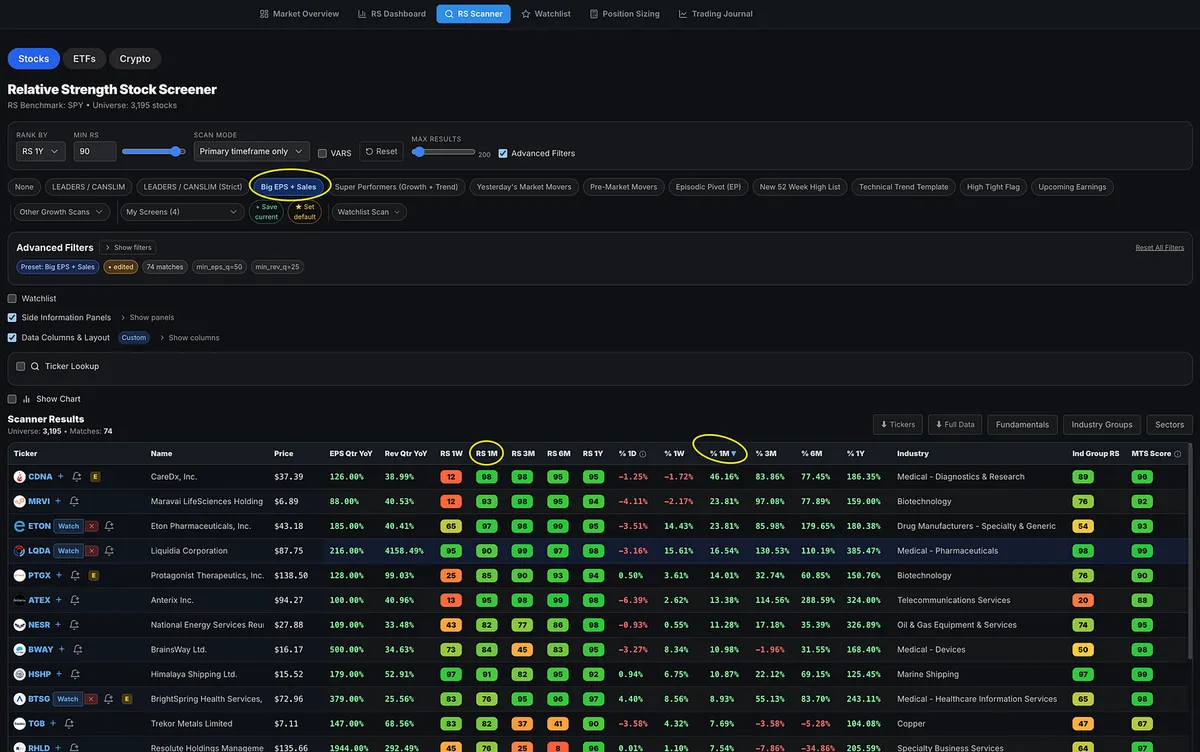
Leadership changes before most traders notice.
Run the Big Earnings and Big Sales screen, then compare one-year relative strength with one-month relative strength.
The shift is unmistakable.
Many of the stocks that dominated the last year still carry elite long-term RS ratings, but their short-term rankings have collapsed:
SNDK: 1yr RS = 99 / 1m RS = 2
AXTI: 99 to 1
MU: 98 to 10
WDC: 98 to 3
LITE: 98 to 10
CIEN: 97 to 12
At the same time, biotechnology, pharmaceuticals, software, and other emerging groups are moving toward the top of the screen.
That is what leadership rotation looks like in real time.
The market doesn’t send a memo. It leaves clues in relative strength, and industry-group rankings.
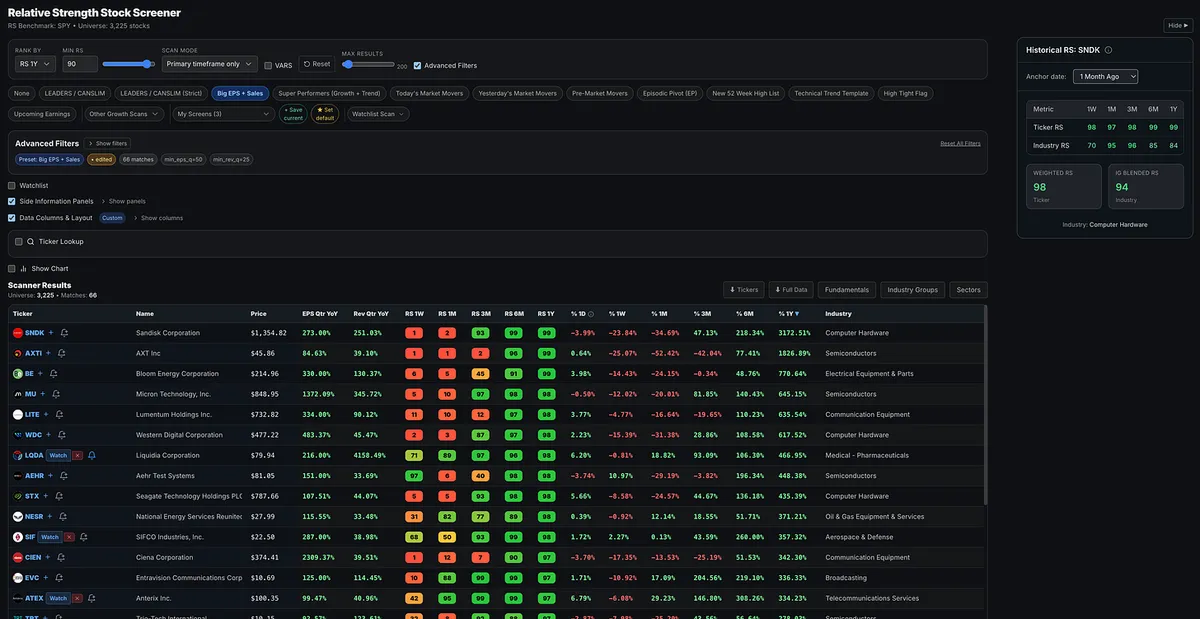
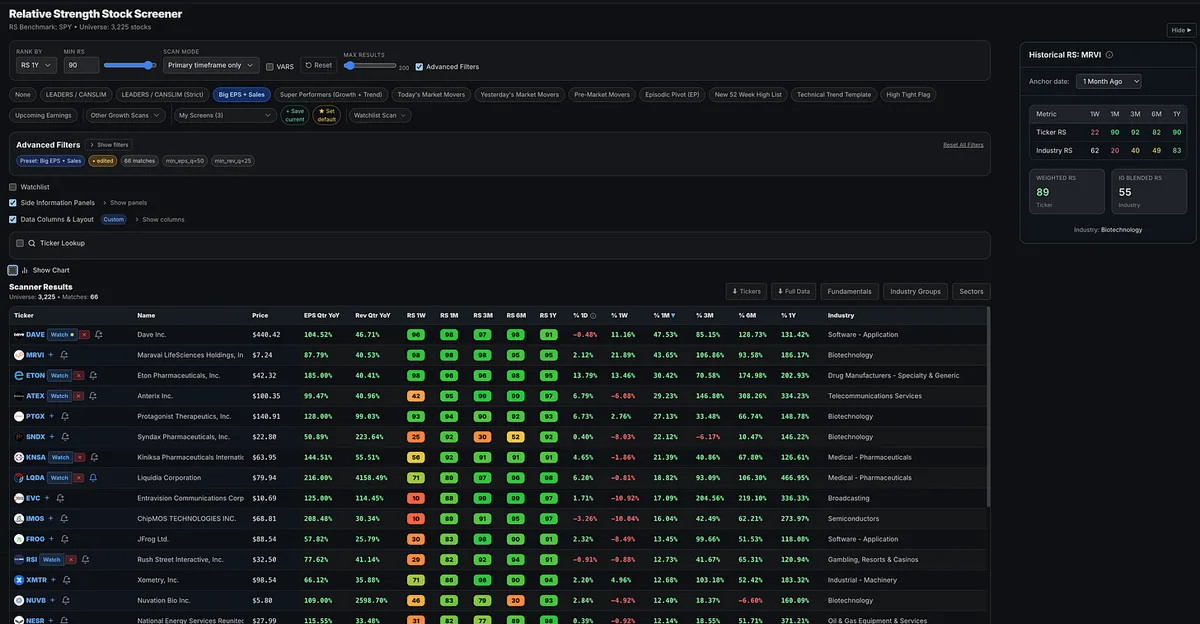
Stop Waiting for Someone to Hand You the Next Big Winner
If you are struggling to find the big winning stocks, you do not need to wait around for me or anyone else to tell you the names.
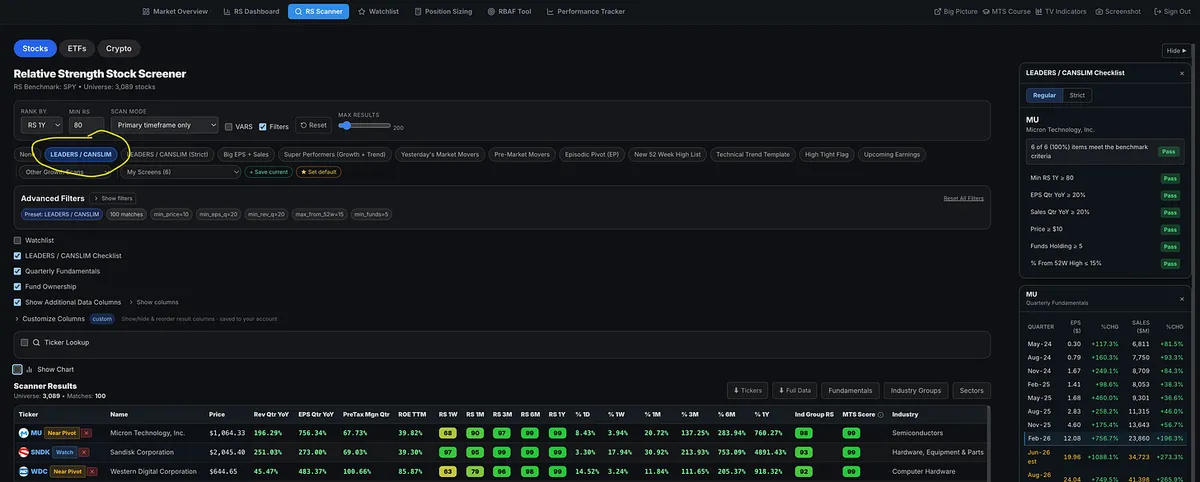
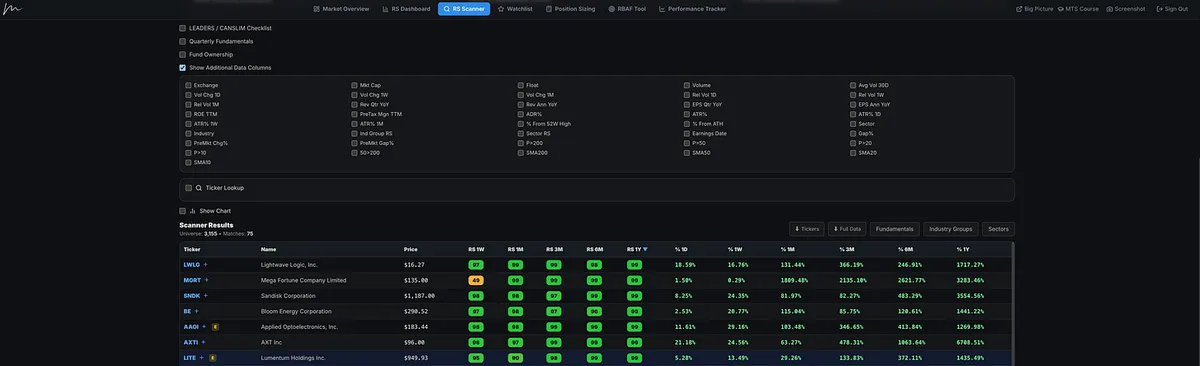
Open the Relative Strength Stock Screener and click the Leader / CANSLIM preset stock screen.
You will immediately see many of the market’s strongest names near the top of the list.
As you scroll through the list, some names will be extended. Those go on your watchlist so you can wait for the next proper pullback or setup.
Some will be near pivot points.
Some will already be actionable.
That is the entire point of the screener.
It is not there to overwhelm you with tickers. It is there to help you quickly identify where the real leadership is.
This is the same exact process I have used to find and share many of the biggest winners since January.
Names like:
SNDK
MU
AAOI
AXTI
DELL
CIEN
LITE
WDC
STX
SIMO
and many more!
Your job is to build the habit of checking the list, following the leaders, managing risk, and being ready when the setup appears.
Everything you need to learn the process is inside the Momentum Trading Strategy Course. I also provide a list of books that teach many of the same timeless principles.
Learn the process.
Use the tools.
Trust yourself.
You can do this.
Everyone Saw the AI Chips. Few Saw the AI Plumbing.
William O’Neil called this the “cousin stock” theory.
When a major theme is working, most traders focus on the obvious leader.
But sometimes the better opportunity is hiding one step away.
The supplier.
The equipment maker.
The parts provider.
The infrastructure company.
O’Neil used Boeing as an example.
Boeing was the obvious winner during the airline boom, but every new jet also needed parts from suppliers. One of those supplier stocks, Monogram Industries, went on to make a massive move.
Same theme. Different angle.
That still happens today.
In the AI boom, Nvidia was the obvious AI leader.
Everyone saw the GPUs.
But AI data centers also need high-speed optical connections to move data between GPUs, servers, switches, and storage systems.
That is where Lumentum (LITE) became a modern cousin/follow-on stock.
LITE does not make Nvidia’s GPU.
It does not need to.
It supplies advanced lasers, optical modules, transceivers, and photonic components that help AI data centers scale.
Then Nvidia made the connection even clearer by announcing a strategic partnership and investment in Lumentum.
NVDA was the obvious leader in 2023–2024.
LITE was a related supplier benefiting from the same AI infrastructure demand, which helped it become one of the leading stocks in 2025–2026.
Most traders ask:
“What stock should I buy?”
Better traders ask:
“What theme is driving the market, which group is leading, and who are the cousin stocks benefiting from the same demand?”
That is where leadership leaves clues.
The crowd usually sees the main story first.
The best traders look for the ecosystem forming around it.
That is why industry group and relative strength matters.
This is why I built the Momentum Trading Strategy RS Scanner.
Not just to find strong stocks, but to help identify the strongest groups, and related names moving with institutional demand.
Why Do You Keep Missing the Biggest Winning Stocks?
Most traders spend their time looking for stock tips.
The best traders spend their time looking for stock characteristics.
Strong earnings. Strong sales. Strong relative strength. Strong industry groups. Strong price action.
The funny thing is many of the biggest winners were not hiding.
MU. LITE. SNDK. CIEN.
They were displaying many of the same characteristics long before their biggest moves.
The challenge isn’t finding the information.
The challenge is having a process that helps you recognize it.
I just published a new article walking through the exact screening process I use to find potential market leaders.
If you’ve ever wondered how traders consistently find big winners while everyone else seems to discover them months later, this article is for you.
https://tradingmomentum.substack.com/p/how-i-find-the-biggest-winning-stocks
The Multi-Bagger Irony
A lot of stock newsletters sell people on the hope of finding the next multi-bagger.
A 100%, 200%, or 300% winner.
Many talk about holding for years to get the big returns.
What people don't realize is this:
By the time you figure out they were full of it, they already made plenty of money selling you the hope.
The funny thing is, I don't even teach or claim to give people multi-baggers.
But many investors would likely get similar or better results by learning how to identify true growth stock leadership, proper setups, institutional demand, and strong price action.
Here are a few names I mentioned in January and early February:
• AAOI +302%
• AXTI +294%
• SNDK +249%
• DELL +214%
• MU +160%
• LITE +155%
• CIEN +147%
• STRL +127%
• STX +126%
• WDC +124%
• INTC +101%
• AMD +101%
These were discussed in the paid subscriber chat and watchlist posts.
But to be clear, this is not what I do here.
I'm not telling you to blindly buy a stock and hold it until it becomes a multi-bagger.
The goal is to teach you how to find leadership, manage risk, identify proper entries, and build a repeatable process.
The Quiet Warning Showing Up Under the Surface
A lot of leading stocks are still acting strong.
Many are making new highs. Many still have great relative strength.
Price is still king, and I would never execute a trade based on one data point alone.
But I am noticing something worth paying attention to.
On the most recent earnings reports for a lot of leading names I’ve been following, fund ownership has dropped.
Again, this does not mean the move is over.
These stocks can absolutely keep running higher from here. That’s exactly why price always comes first.
Also, sometimes this happens for a quarter or two, then funds increase again and come right back into the name.
But when leading stocks are pushing higher while fund ownership starts declining, it can be an early sign that some institutions are taking profits into strength.
If price starts to break down later, this gives us a possible clue as to what may have been happening under the surface.
Some names where I’m noticing this:
SIMO, ALAB, MRVL, LITE, TTMI, NVT, LASR, AMD, STRL, LRCX, AAOI.
This is not a sell signal.
This is not a prediction.
Just something I’m taking note of.
The News Was Late. The Stock Was Already Leading.
NVIDIA announced its planned $2 billion investment in Lumentum, ticker LITE, on March 2, 2026.
But LITE was already a major leader before that headline ever came out.
I was buying it and writing about it back in January when it was pulling back to the 50-day moving average.
Why?
Not because I knew NVIDIA was going to invest $2 billion.
I had no idea.
It was because LITE already had almost everything we look for:
Strong earnings growth.
Strong sales growth.
A 99 relative strength rating.
Accelerating institutional ownership.
Leadership in a top industry group.
Alignment with the broader AI theme.
That is the lesson.
You do not need to know everything about a company before the move happens.
You do not need to chase every headline.
In many cases, by the time the news confirms what is happening, the stock has already been under accumulation for weeks or months.
The process finds the clues before the headlines explain them.
Many of the biggest winners I have traded were not names I knew deeply at the time. They were not always comfortable. They were not always obvious, but they had the characteristics that big winning stocks tend to show before the crowd fully understands the story.
If you only trade names you are already comfortable with, you may miss many of the best opportunities.
The process often tells the story before the news does.
This Is Why You Track Leadership Before Everyone Else Sees It
On April 8, the market gave us the signal.
We had a follow-through day, the NASDAQ-100 reclaimed key moving averages, including the 50-day and 200-day, and the conversation shifted from defense back toward offense.
But the real edge was not just knowing the market was improving.
The edge was knowing where to look.
When the market gets stronger, I want to be focused on the strongest industry groups and the strongest stocks inside those groups.
That is exactly what we had been tracking for months.
Telecom.
Computer Data Storage.
Semiconductors.
Many of these names were not random new ideas. They had already been showing up in our work, some for months, and some even last year.
So when the market confirmed on April 8, there was no need to bounce around looking for the next hot ticker.
The leadership was already there.
From the April 8 signal to yesterday’s close:
AAOI up 40%
LITE up 12%
CIEN up 12%
VIAV up 30%
SNDK up 81%
WDC up 38%
STX up 53%
TER flat
AEIS down 4%
AEHR up 50%
LRCX up 12%
FIX up 30%
GLW flat
Not every stock works.
That is normal.
But when the market confirms, and multiple stocks from the same leading groups start moving together, that is usually not a coincidence.
That is institutional money flowing into a theme.
Strong market.
Strong industry groups.
Strong stocks.
That is the process.
The goal is not to chase every move.
The goal is to already know where the strength is clustering before the move becomes obvious.
The Best Stocks Usually Look Strong Before They Look Obvious
William O’Neil said this in Market Wizards, and it still applies today:
“The 500 best-performing stocks during the 1953–1985 period had an average relative strength of 87 before their major price increase actually began.”
That is the point most investors miss.
The best stocks usually do not start their big moves from weakness.
They start from strength.
They are already outperforming the market, already showing demand, and already separating themselves from the average stock before the crowd fully recognizes what is happening.
This is why relative strength matters so much.
It helps us focus on where institutional money is already flowing instead of wasting time digging through laggards because they look “cheap.”
Strong stocks can always get stronger.
LITE is a recent example. Back in January, it already had a 99 Relative Strength Rating, and it still went on to gain more than 100%.
Strength should not scare you away.
It should get your attention.
Weak stocks can stay weak much longer than people expect.
The goal is not to find the lowest-priced stock.
The goal is to find the leaders before the move becomes obvious.
What We Actually Do As Momentum Traders
For those of you that are new, here’s what we actually do.
Momentum Trading Strategy primarily focuses on swing and position trading, mainly in growth stocks, while following the trend.
Our strategy is rooted in principles that have worked for over 100 years.
The foundation comes from traders such as Jesse Livermore, Gerald Loeb, Bernard Baruch, Richard Wyckoff, Nicolas Darvas, William O'Neil, and more modern traders like Mark Minervini, David Ryan, Dan Zanger, Kristjan Kullamägi, along with many U.S. Investing Champions.
Different eras.
Same principles.
So what are we primarily looking for?
When the market is bad, we are preserving capital.
We are mostly in cash.
We are preparing for the next Stage 2 uptrend.
When the market is healthy, we are looking to participate in the strongest industry groups.
This changes cycle to cycle.
More recently, we’ve seen strength in areas like computer data storage with names like SNDK.
Telecom with LITE.
And semiconductors with AAOI.
Within these hot industry groups, we are looking to trade the biggest names and the best leaders.
These tend to have high relative strength (RS), meaning they are outperforming the index and most other stocks in the market.
They also have fuel driving that strength.
That fuel usually comes from:
Strong earnings
Strong sales
Or acceleration in earnings and sales
Also, something that might catch the market off guard.
These stocks are typically making new highs repeatedly.
If you look at the chart, they are consistently forming higher highs and higher lows.
So what we are doing is aligning:
The overall bull market theme
The hottest industry groups
The strongest stocks within those groups
All while looking to enter at points that offer low-risk, high-reward opportunities.
If we are wrong, we lose a small amount.
If we are right, we make multiples of that risk.
3x. 5x. 10x. 15x. 20x.
That’s the entire game.
My goal is to provide you with all the tools necessary to actually do this.
Paid subscribers get access to:
A web app with a Relative Strength Stock Screener to find these types of stocks
A weekly market newsletter to help you stay aligned with the market
A Relative Strength dashboard
A watchlist feature and additional risk management tools
Shared stock ideas and scans
And a full course that breaks all of this down in depth.
All for $120 per year.
That’s only $10 per month.
If that’s too expensive, then frankly, you probably shouldn’t be trading.
This Is What Real Leadership Looks Like
It’s not a coincidence.
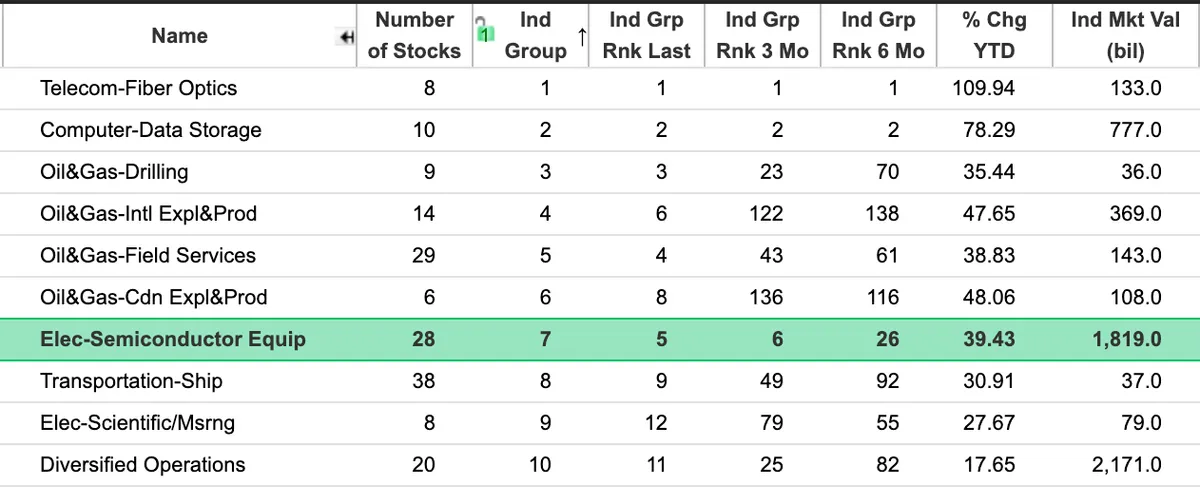
When we look at the Top 10 Industry Groups right now, we’re seeing clear clustering of strength:
Telecom: AAOI, LITE, CIEN, VIAV
Computer Data Storage: SNDK, WDC, STX
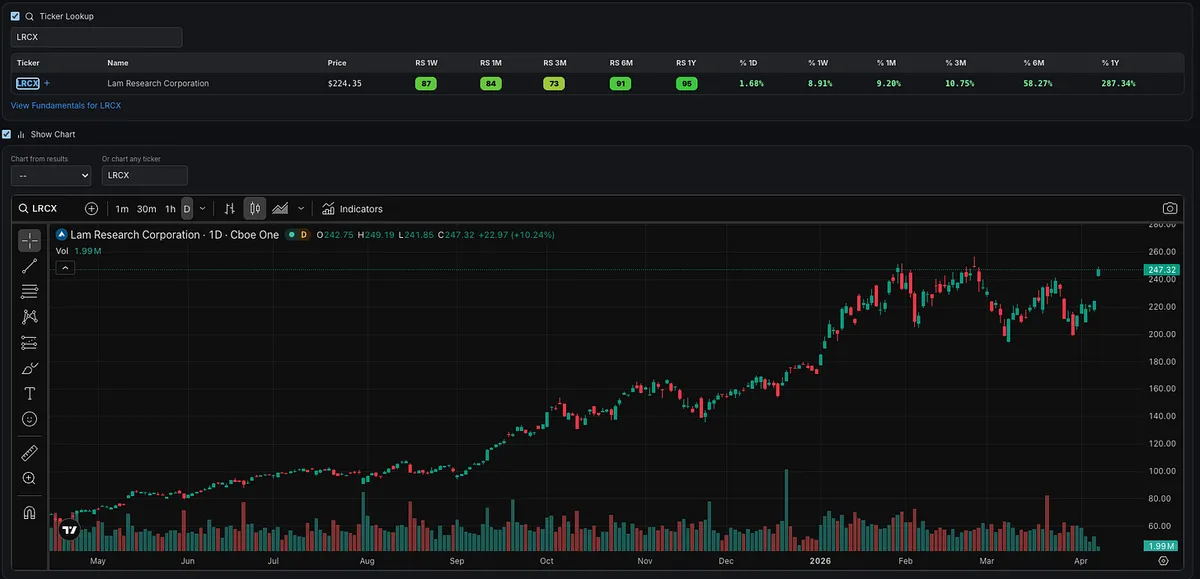
Semiconductors: TER, AEIS, AEHR, LRCX
All showing up in the top groups.
This is exactly how leadership reveals itself.
It’s not just one stock. It’s clusters of strength moving together.
When you start seeing multiple names across the same industry groups all:
Breaking out
Showing strong relative strength
Backed by strong fundamentals
That is not random.
That is institutional money flowing into a theme.
This is how real trends work.
Stay focused on where the strength is clustering, just like we teach in the MTS Course. https://tradingmomentum.substack.com/s/mts-course
How do we find the strongest names in the strongest groups?
Relative Strength Stock Screener.
Use it now as part of the MTS Web App https://momentumtradingstrategy.app/
That’s where the opportunity is.
LITE Earnings Turnaround Before the Breakout
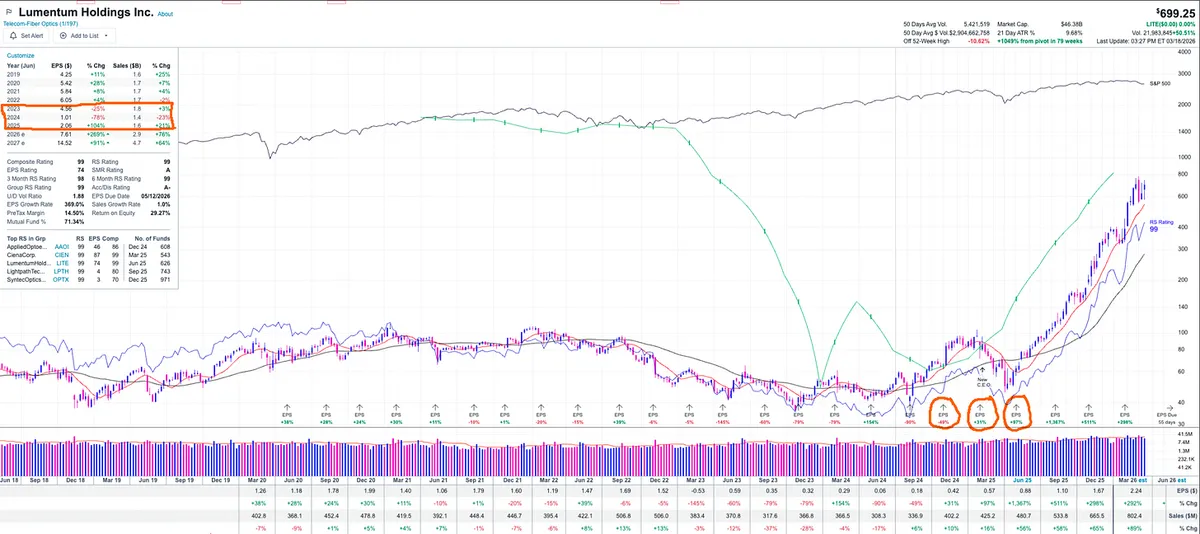
Most traders wait for perfect earnings. The market does not.
LITE spent two years with weak and declining earnings. Growth slowed. Some quarters turned negative. Nothing looked attractive.
Most people ignored it.
Then the shift happened.
Before the major move in 2025, earnings flipped. Negative quarters improved and turned positive. Then growth began to accelerate.
Annual earnings surged into triple digit growth.
But there is another layer most traders miss.
Both Mark Minervini and David Ryan have pointed out that during major turnarounds, analysts are often behind the curve. Their estimates tend to be too conservative.
Price begins to move as institutions recognize the change early, while analysts are still catching up or providing conservative estimates.
The stock did not wait for perfect fundamentals. It moved when the trend changed.
This is what matters.
Not just strong earnings, but improving and accelerating earnings.
Watch for earnings turnarounds.
The Simple Screener That Finds Momentum Breakout Stocks
One of the biggest questions traders ask is:
“How do you actually find these breakout stocks before they move?”
The answer is simpler than most people think.
You start by narrowing the market down to the strongest stocks already showing leadership.
One of the fastest ways to do that is by using a Relative Strength Stock Screener.
This is the same basic idea used by momentum traders like Kristjan Kullamägi when searching for breakout setups.
The Simple Process
Use a relative strength screener and sort stocks by performance.
Move the rank by timeframe to 1 or 3 months, then set the filter to 98 or higher.
That shows you the top performing ~2% of stocks in the market.
Those are the names you want to study.
Why This Works
Because the biggest winners tend to behave in a very specific way.
As Kristjan explains:
“If you study thousands of the biggest winning stocks over the past 100 years they tend to move in stair steps. Meaning they will make a 20–50%+ move, pull back and go sideways for a while, then make another move.”
That stair-step behavior is where momentum traders find their edge.
A stock makes a strong move. Then it pulls back and consolidates. Then it breaks out again.
Those consolidations are where many of the best breakout setups form.
The key is focusing on stocks that are already proving themselves as leaders.
That’s why scanning for the top 1–2% performers is so powerful.
What to Look For Next
Once you identify leaders, start watching for technical setups such as:
• Tight consolidations
• Volatility contractions
• High tight flags or pennants
• Higher highs and higher lows
• Flat base breakouts
Other patterns that often appear in strong leaders:
• Ascending triangles
• Darvas boxes
• Wedges
• Parabolic curves
And always watch the volume behavior:
• Volume drying up during pullbacks or consolidations
• Heavy volume expansion on breakouts
This is one of the easiest ways to build a watchlist of potential momentum leaders before they make their next move.
In fact, this exact process is how I spotted LITE before it went on to move over 100%.
For Paid Subscribers
For those inside the paid subscription, you already have access to the Relative Strength Screener tool that automatically filters for these types of stocks.
It’s one of the simplest ways to quickly narrow thousands of stocks down to a handful of high-probability breakout candidates, the same type of setups momentum traders like Qullamaggie focus on.
If you're more CANSLIM / position trader focused, you can slightly loosen the relative strength filter and add Sales and Earnings growth to your screen.
Another option is to use the Super Performer preset in the screener, which combines several of those fundamental growth filters.
You’ll find the screener inside the Momentum Trading Strategy section for paid subscribers.
Why I Mentioned AAOI Before Earnings
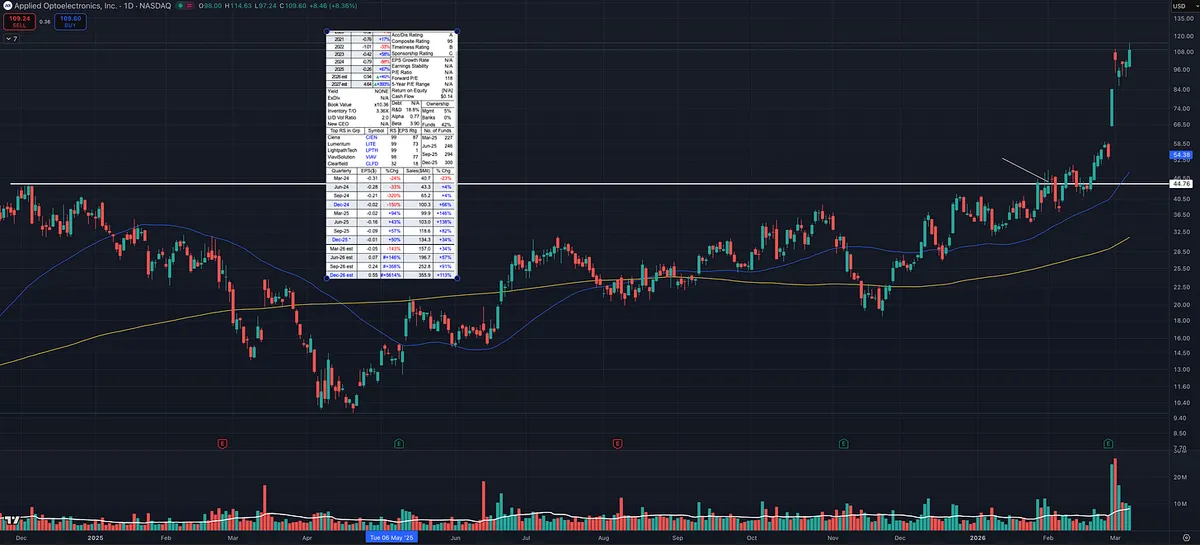
Someone asked why I mentioned AAOI in early February with earnings coming up.
First, the stock checked several boxes I look for.
It was in a HOT group (telecom) showing strong relative strength across multiple timeframes. I had already seen success with LITE and CIEN, which are in the same space. It reminded me of past industry runs like the computer data storage group when SNDK, MU, WDC, and STX all moved together.
AAOI also had:
• Strong earnings and sales acceleration
• Rising forward estimates
• Accelerating fund ownership
• Tight price action on the right side of the chart
• Trading near new 52 week highs
Since that mention the stock has moved about 150%, but the trade management is the important part.
I normally do NOT buy a stock a few days before earnings. There is too much risk and no time to build a cushion.
I follow the advice from Paul Tudor Jones:
“Never trade in situations where you don’t have control. For example, I don’t risk significant amounts of money in front of key reports, since that is gambling, not trading.”
In this case there were about three weeks before the report, which gave the trade time to work.
From the original buy, the stock moved roughly 30% before earnings.
At that point the plan becomes simple:
• Trim a large portion before the report
• Lock in gains and reduce risk
• Hold a smaller position into earnings
Even great stocks can drop 15–20% overnight on earnings.
By trimming beforehand, the position already has a profit cushion, so the remaining shares carry much less risk.
This is something I learned studying the playbooks of William O’Neil, Mark Minervini, and David Ryan.
The goal isn’t predicting earnings.
The goal is managing risk while letting strong stocks work in your favor.
From RS Screener to Weekly Paid Newsletter to 55% Gain
We have been talking about buying pullbacks and upside reversals.
LITE just gave a textbook one.
What is interesting is how it first came onto our radar.
It showed up on our relative strength screener weeks before the breakout, while it was still setting up.
Top tier relative strength.
Strong on multiple timeframes.
Fund ownership accelerating.
Big earnings. Big sales.
You would have missed it on the MarketSurge O’Neil scan, which highlights the importance of casting a wider net. That is what I do when using the relative strength screener. First I scan for strength, then I dive into the chart and the fundamentals.
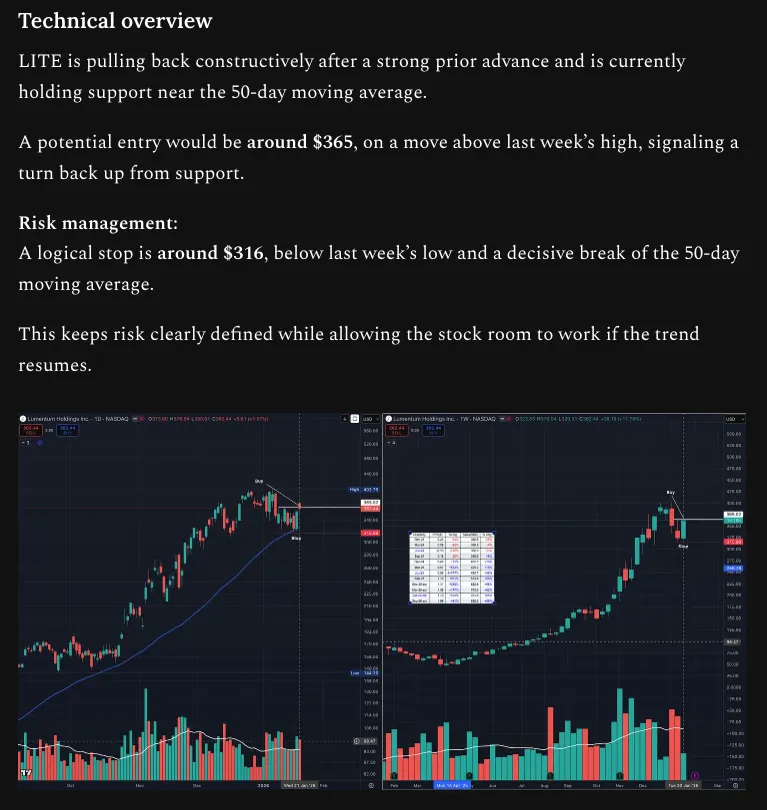
When we walked through this setup with paid subscribers, it was pulling back constructively after a strong advance and sitting near the 50 day moving average.
The plan was simple.
Entry around $365 on a move above the prior week’s high. Stop below the weekly low. We were also looking for follow through at the breakout level around $400.
We defined our risk, like we do with every trade.
No guessing.
Now it is up 55 percent from that area.
Here is the important part.
I am not some guru. I did not know LITE would be a winner. It simply met the criteria of big winners. Plenty of stocks meet the criteria and fail. When they do, I take a small loss.
But when a stock with elite relative strength sets up technically, offering a low risk, high reward opportunity, combined with strong CANSLIM type fundamentals, those are the kinds of names that can become major winners. You take them.
One stock like this can cover multiple failed attempts.
That is why we scan for strength.
Look for low risk, high reward technical setups.
Align with big sales, big earnings, accelerating fund ownership, and a bull market theme.
This is why we focus on process.
And that process produces the results.

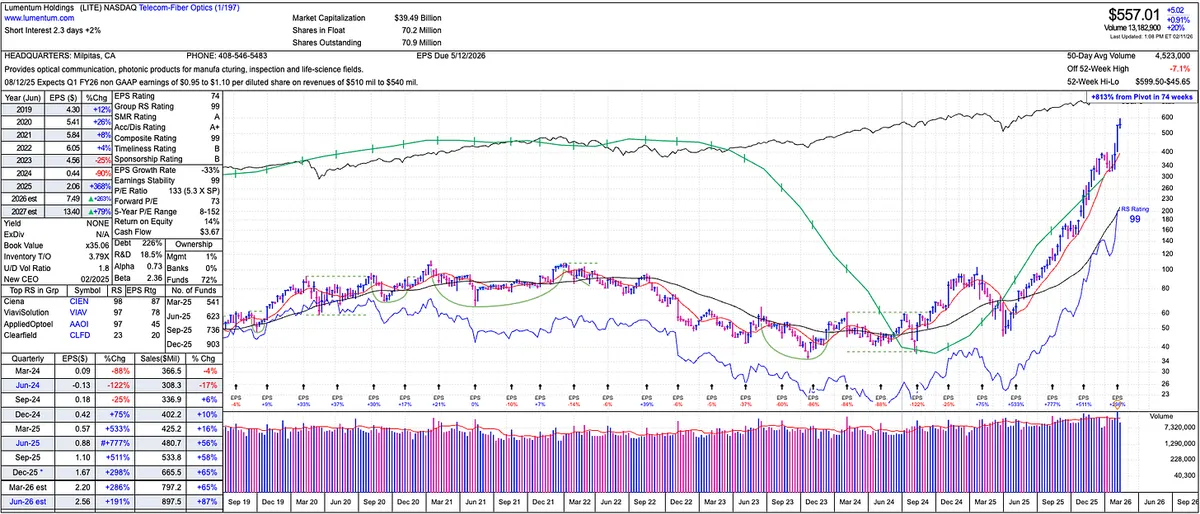
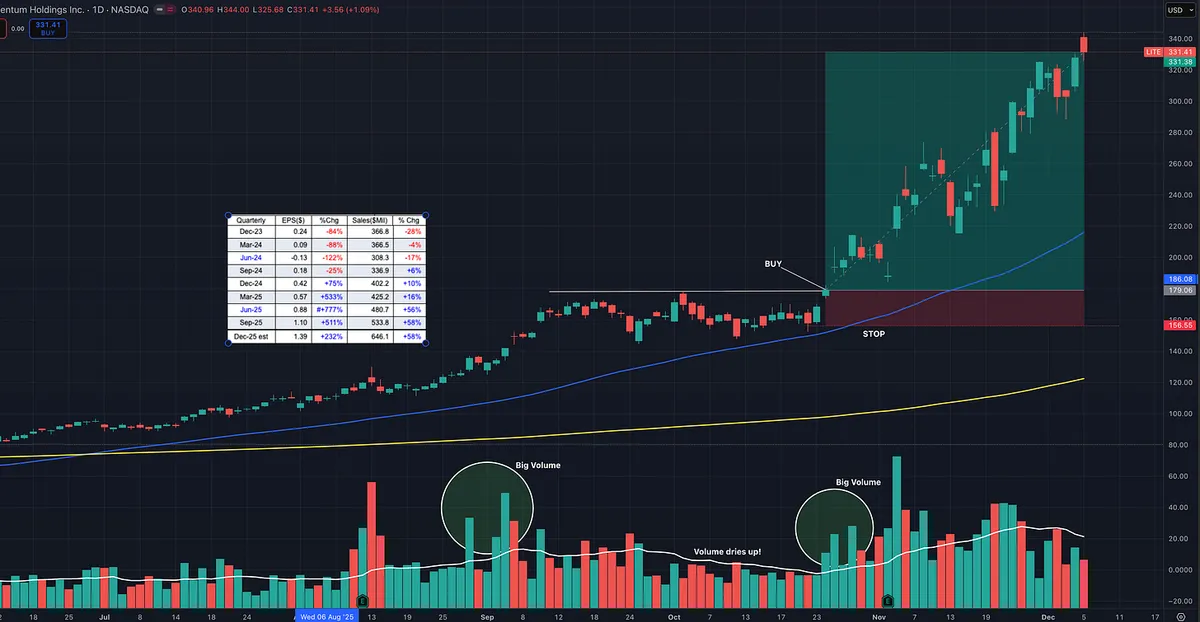
Great example of volume and price analysis with LITE.
LITE was easily spotted on scanners for its Relative Strength performance (RS 99), huge earnings and sales acceleration, and its position in a leading sector and theme. This is exactly what real leadership looks like from a top industry group in telecom and fiber optics.
The setup was a flat base breakout after tight consolidation. Big volume came in on the first move up, followed by controlled consolidation where volume dried up, and then another surge of big volume on the breakout.
The combination of strong fundamentals, clean technical price action, increasing fund ownership, and leadership within its sector created a high quality risk and reward opportunity.