Momentum Trading Strategy

Notes

Finding Leading Stocks

What to buy: how to find, screen and rank the strongest stocks and industry groups.

Showing 1–9 of 9 notes

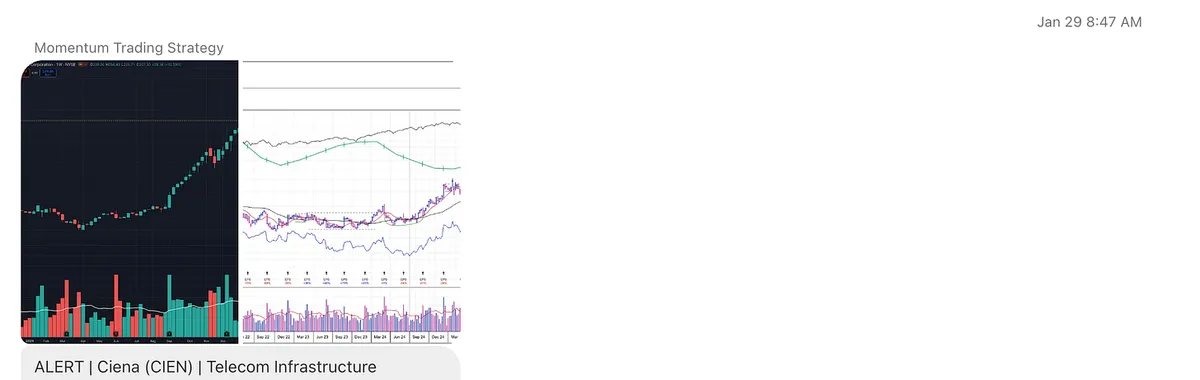
$CIEN ×
View on Substack ↗

The Old Leaders Are Waking Back Up

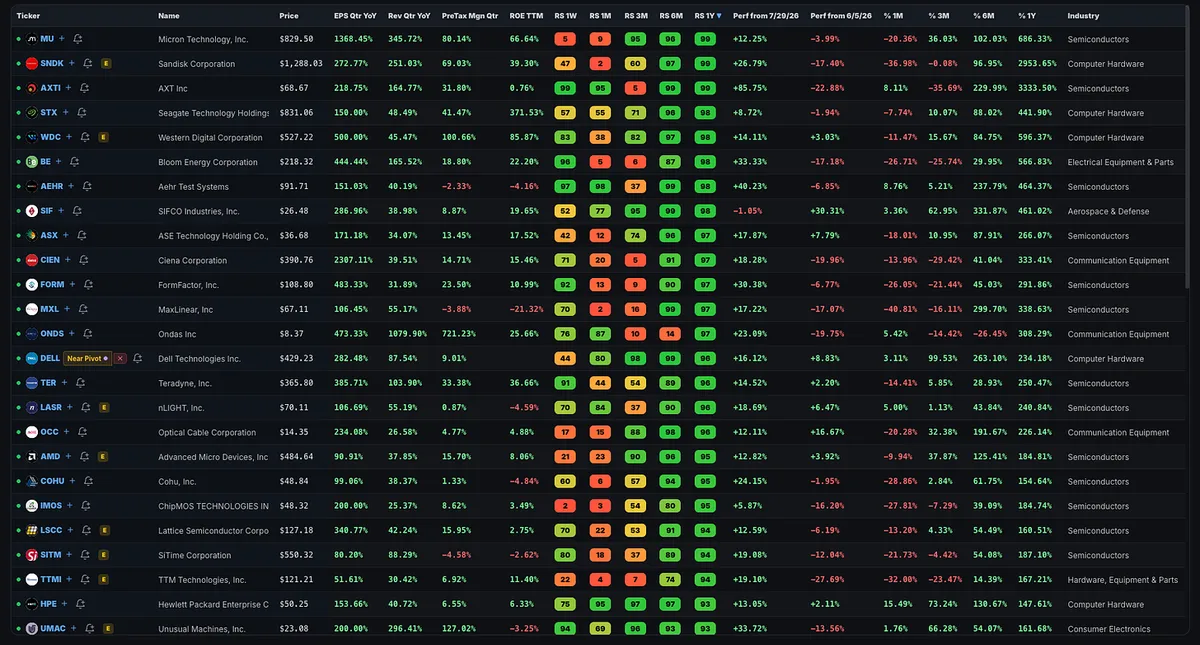
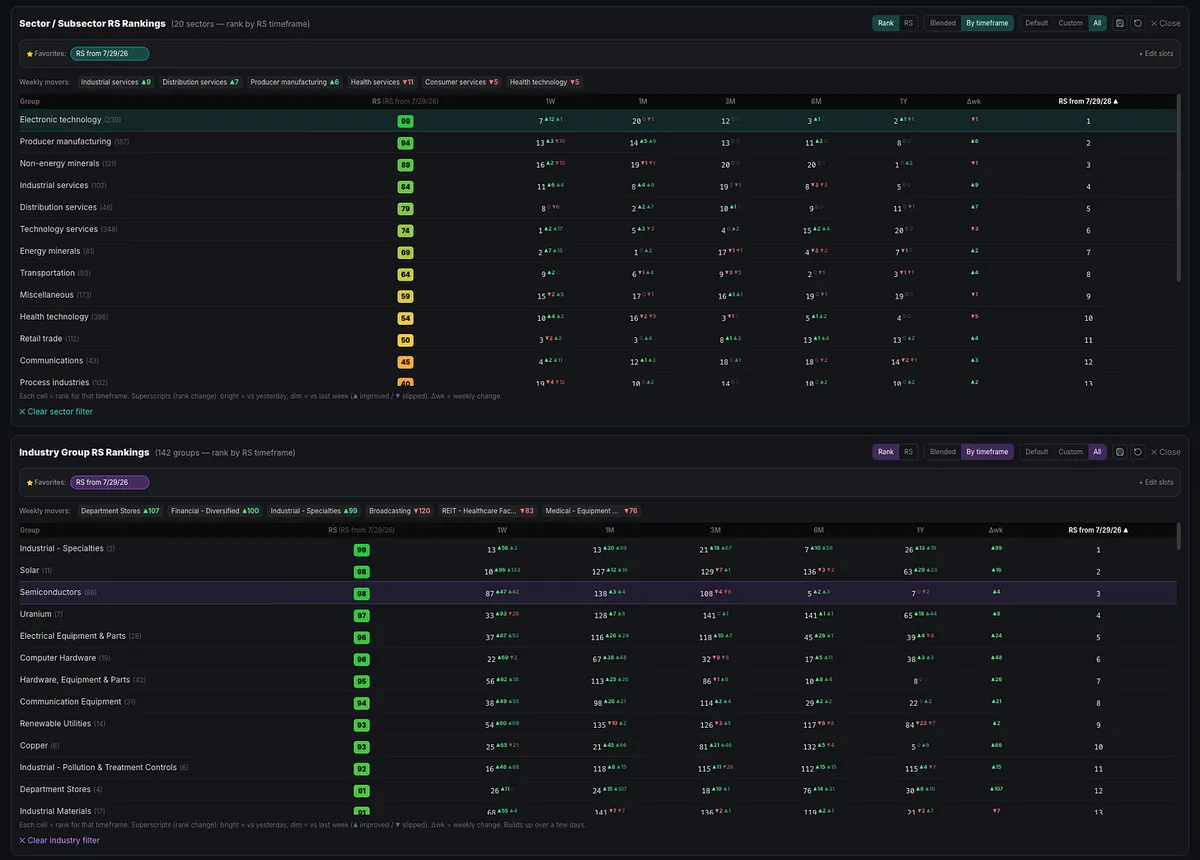
The strongest sectors and industry groups since the July 29 low are many of the same areas that led the market over the past year:

Technology

Semiconductors

Electrical Equipment and Parts

Computer Hardware

Electronic Equipment and Parts

Communication Equipment

These areas took a beating after major runs in many of their leading stocks.

We will see whether the market produces a follow-through day today or in the coming days, and whether these groups can reclaim their prior leadership.

Many of the former leaders, including SNDK, MU, BE, CIEN, and PENG, were hit hard and still have significant ground to recover.

But the areas that led before the correction are once again showing some of the strongest relative performance off the lows.

View on Substack ↗

Leadership changes before most traders notice.

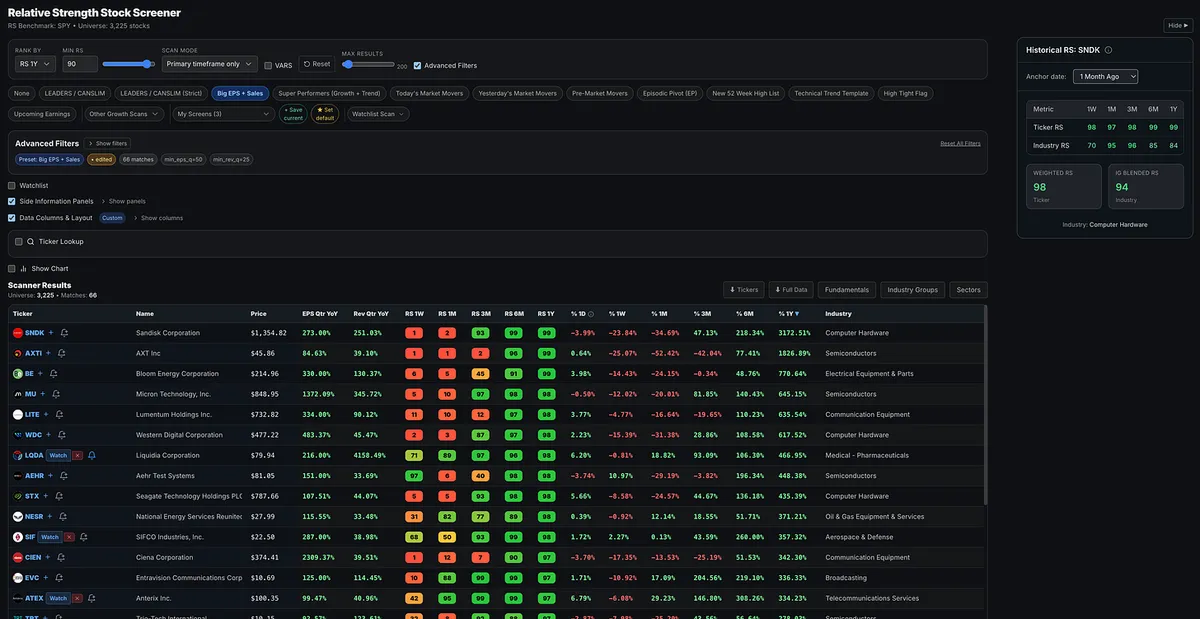
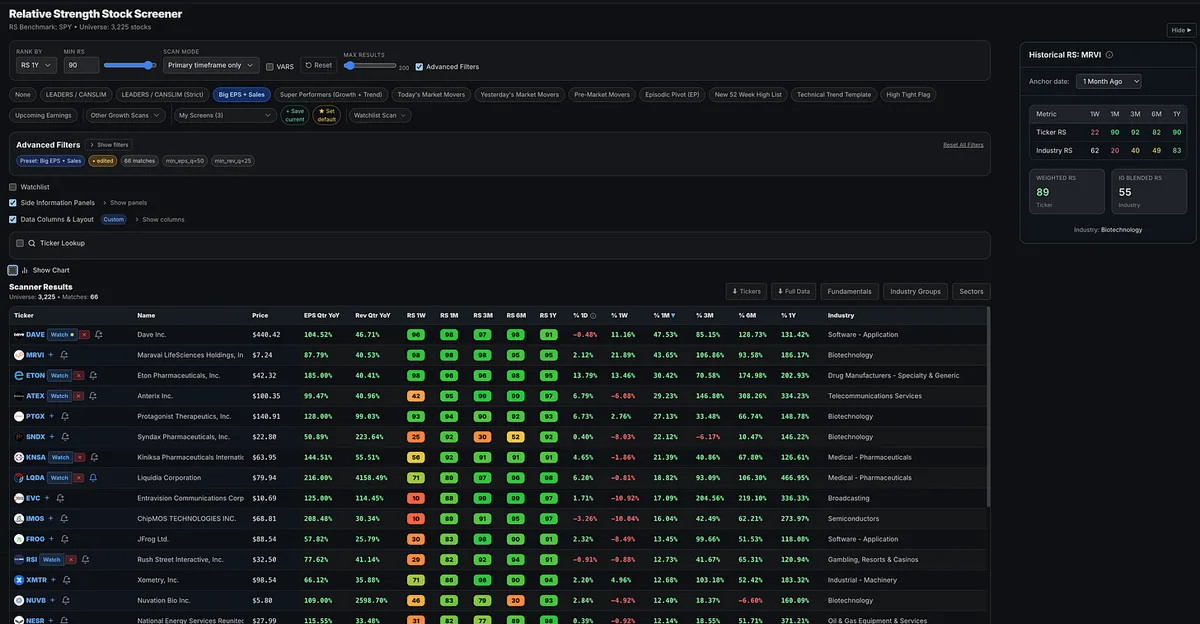
Run the Big Earnings and Big Sales screen, then compare one-year relative strength with one-month relative strength.

The shift is unmistakable.

Many of the stocks that dominated the last year still carry elite long-term RS ratings, but their short-term rankings have collapsed:

SNDK: 1yr RS = 99 / 1m RS = 2

AXTI: 99 to 1

MU: 98 to 10

WDC: 98 to 3

LITE: 98 to 10

CIEN: 97 to 12

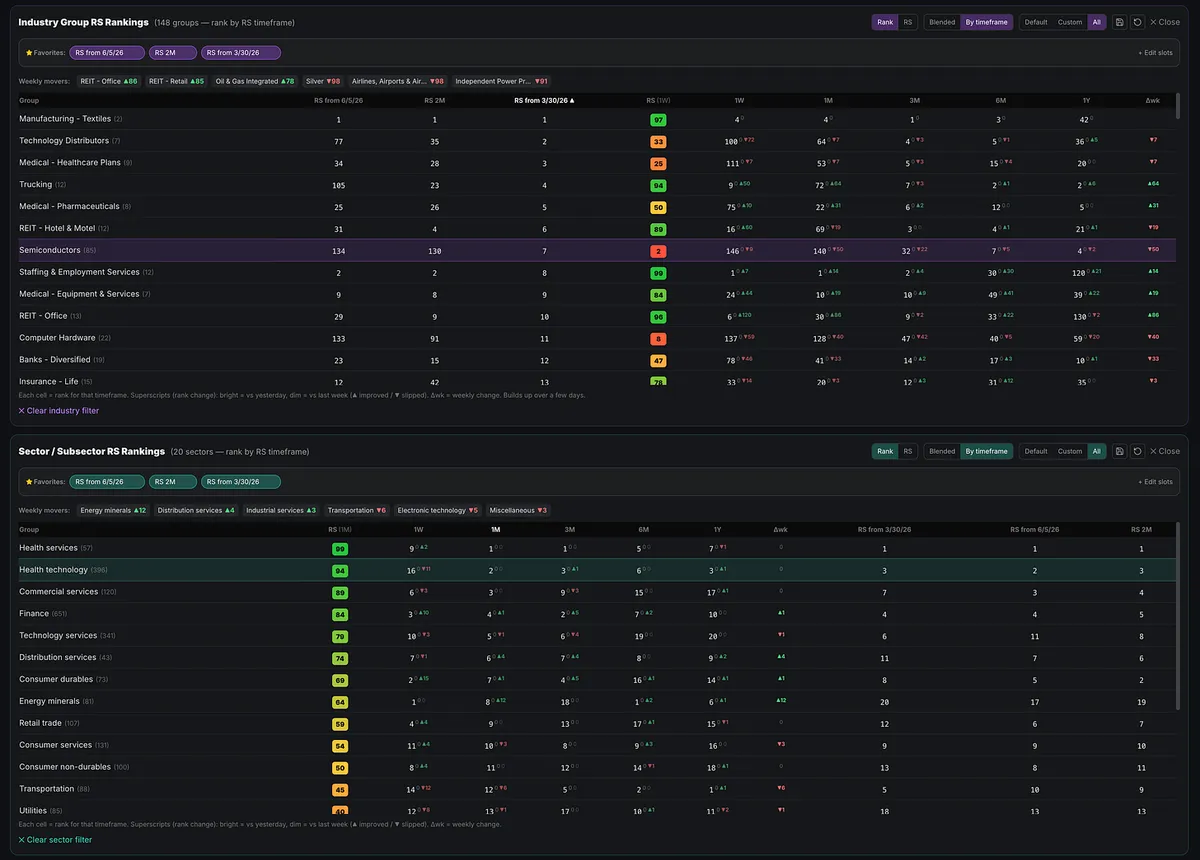
At the same time, biotechnology, pharmaceuticals, software, and other emerging groups are moving toward the top of the screen.

That is what leadership rotation looks like in real time.

The market doesn’t send a memo. It leaves clues in relative strength, and industry-group rankings.

View on Substack ↗

Stop Waiting for Someone to Hand You the Next Big Winner

If you are struggling to find the big winning stocks, you do not need to wait around for me or anyone else to tell you the names.

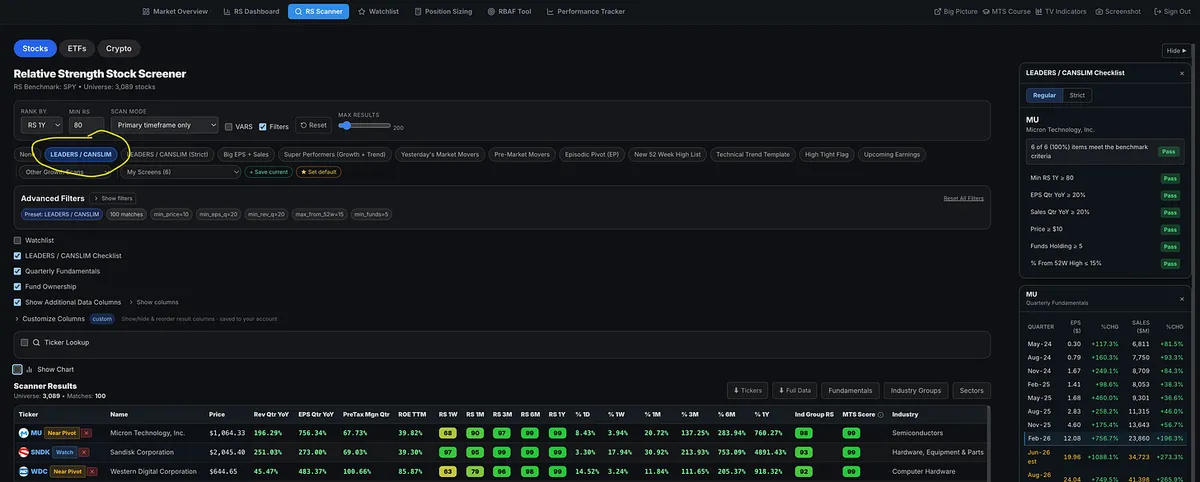
Open the Relative Strength Stock Screener and click the Leader / CANSLIM preset stock screen.

You will immediately see many of the market’s strongest names near the top of the list.

As you scroll through the list, some names will be extended. Those go on your watchlist so you can wait for the next proper pullback or setup.

Some will be near pivot points.

Some will already be actionable.

That is the entire point of the screener.

It is not there to overwhelm you with tickers. It is there to help you quickly identify where the real leadership is.

This is the same exact process I have used to find and share many of the biggest winners since January.

Names like:

SNDK

MU

AAOI

AXTI

DELL

CIEN

LITE

WDC

STX

SIMO

and many more!

Your job is to build the habit of checking the list, following the leaders, managing risk, and being ready when the setup appears.

Everything you need to learn the process is inside the Momentum Trading Strategy Course. I also provide a list of books that teach many of the same timeless principles.

Learn the process.

Use the tools.

Trust yourself.

You can do this.

View on Substack ↗

Why Do You Keep Missing the Biggest Winning Stocks?

Most traders spend their time looking for stock tips.

The best traders spend their time looking for stock characteristics.

Strong earnings. Strong sales. Strong relative strength. Strong industry groups. Strong price action.

The funny thing is many of the biggest winners were not hiding.

MU. LITE. SNDK. CIEN.

They were displaying many of the same characteristics long before their biggest moves.

The challenge isn’t finding the information.

The challenge is having a process that helps you recognize it.

I just published a new article walking through the exact screening process I use to find potential market leaders.

If you’ve ever wondered how traders consistently find big winners while everyone else seems to discover them months later, this article is for you.

https://tradingmomentum.substack.com/p/how-i-find-the-biggest-winning-stocks

ArticleHow I Find the Biggest Winning Stocks in the Market
View on Substack ↗

The Multi-Bagger Irony

A lot of stock newsletters sell people on the hope of finding the next multi-bagger.

A 100%, 200%, or 300% winner.

Many talk about holding for years to get the big returns.

What people don't realize is this:

By the time you figure out they were full of it, they already made plenty of money selling you the hope.

The funny thing is, I don't even teach or claim to give people multi-baggers.

But many investors would likely get similar or better results by learning how to identify true growth stock leadership, proper setups, institutional demand, and strong price action.

Here are a few names I mentioned in January and early February:

• AAOI +302%

• AXTI +294%

• SNDK +249%

• DELL +214%

• MU +160%

• LITE +155%

• CIEN +147%

• STRL +127%

• STX +126%

• WDC +124%

• INTC +101%

• AMD +101%

These were discussed in the paid subscriber chat and watchlist posts.

But to be clear, this is not what I do here.

I'm not telling you to blindly buy a stock and hold it until it becomes a multi-bagger.

The goal is to teach you how to find leadership, manage risk, identify proper entries, and build a repeatable process.

View on Substack ↗

Are You Missing Stocks by Only Looking for Strength?

I got a good question from a subscriber, and I think many newer traders have probably wondered the same thing.

"If I filter for an MTS Score 80+ (similar to the IBD Composite Rating), am I missing stocks that are just starting to improve from lower levels?"

Yes, that assumption makes sense.

But this is also where growth stock investing and momentum trading can feel counterintuitive.

If you filter for an MTS Score above 80, you may miss some stocks that are just beginning to improve from lower levels.

However, the purpose of that filter is not to find stocks at the bottom.

The goal is to find stocks that have already started proving themselves as leaders.

William O'Neil's research, along with the work of many great growth stock and momentum traders, shows that the biggest winning stocks often display strength before their biggest moves.

They typically already have:

• Strong relative strength

• Big earnings and sales growth

• Strong margins or ROE

• Improving institutional sponsorship

• Leadership within a strong industry group

• Price action near new highs

All before the majority of the move occurs.

Conventional wisdom makes people want to find stocks early at the bottom or near the bottom.

But growth stock investors are usually looking for confirmation that a stock is becoming a true leader.

Many of the stocks that have gone up 100%, 200%, or more over the past few months already had strong ratings above 80 before the majority of the move happened.

CIEN is a good example.

When I first mentioned CIEN back in January, it already had strong ratings and a Relative Strength Rating of 98.

Many people would assume that means they “missed it.”

But from that point, the stock still went up more than 125%.

Strength often comes before more strength.

So yes, a lower MTS Score filter can help you cast a wider net for earlier improvement.

But an MTS Score above 80 is designed to focus on strength, leadership, and confirmation.

We are not trying to buy the weakest stocks before they turn.

We are trying to find the strongest stocks as they prove they are leaders.

The MTS Score is a proprietary leadership rating that evaluates factors such as Relative Strength, EPS growth, Sales growth, ROE, Margins, Industry Group Relative Strength, and other characteristics commonly found in leading stocks.

View on Substack ↗

This Is Why You Track Leadership Before Everyone Else Sees It

On April 8, the market gave us the signal.

We had a follow-through day, the NASDAQ-100 reclaimed key moving averages, including the 50-day and 200-day, and the conversation shifted from defense back toward offense.

But the real edge was not just knowing the market was improving.

The edge was knowing where to look.

When the market gets stronger, I want to be focused on the strongest industry groups and the strongest stocks inside those groups.

That is exactly what we had been tracking for months.

  • Telecom.

  • Computer Data Storage.

  • Semiconductors.

Many of these names were not random new ideas. They had already been showing up in our work, some for months, and some even last year.

So when the market confirmed on April 8, there was no need to bounce around looking for the next hot ticker.

The leadership was already there.

From the April 8 signal to yesterday’s close:

AAOI up 40%

LITE up 12%

CIEN up 12%

VIAV up 30%

SNDK up 81%

WDC up 38%

STX up 53%

TER flat

AEIS down 4%

AEHR up 50%

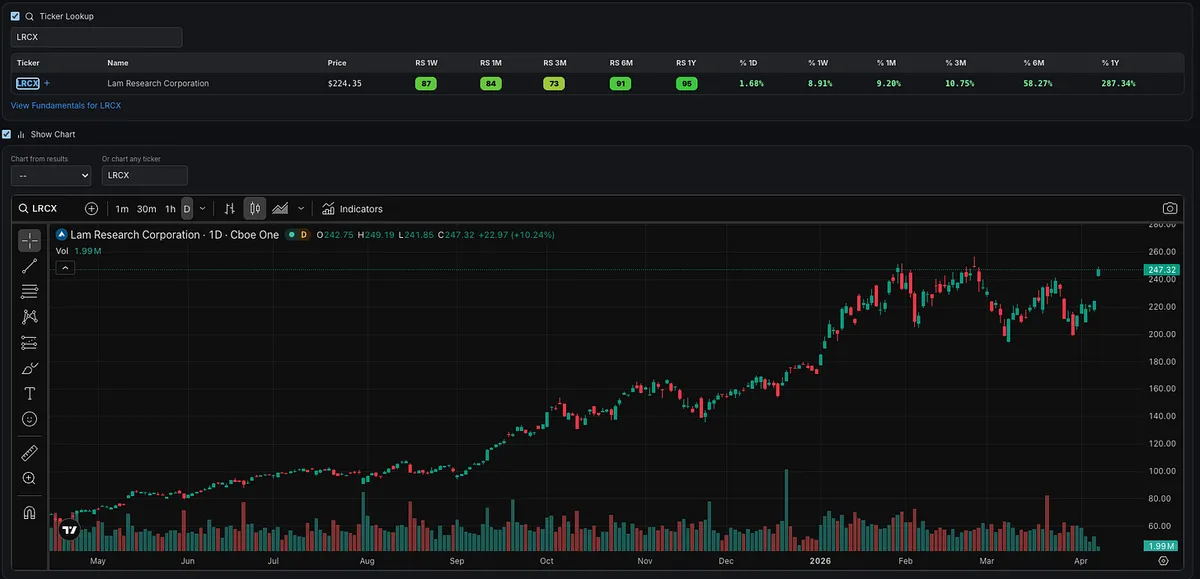
LRCX up 12%

FIX up 30%

GLW flat

Not every stock works.

That is normal.

But when the market confirms, and multiple stocks from the same leading groups start moving together, that is usually not a coincidence.

That is institutional money flowing into a theme.

Strong market.

Strong industry groups.

Strong stocks.

That is the process.

The goal is not to chase every move.

The goal is to already know where the strength is clustering before the move becomes obvious.

View on Substack ↗

This Is What Real Leadership Looks Like

It’s not a coincidence.

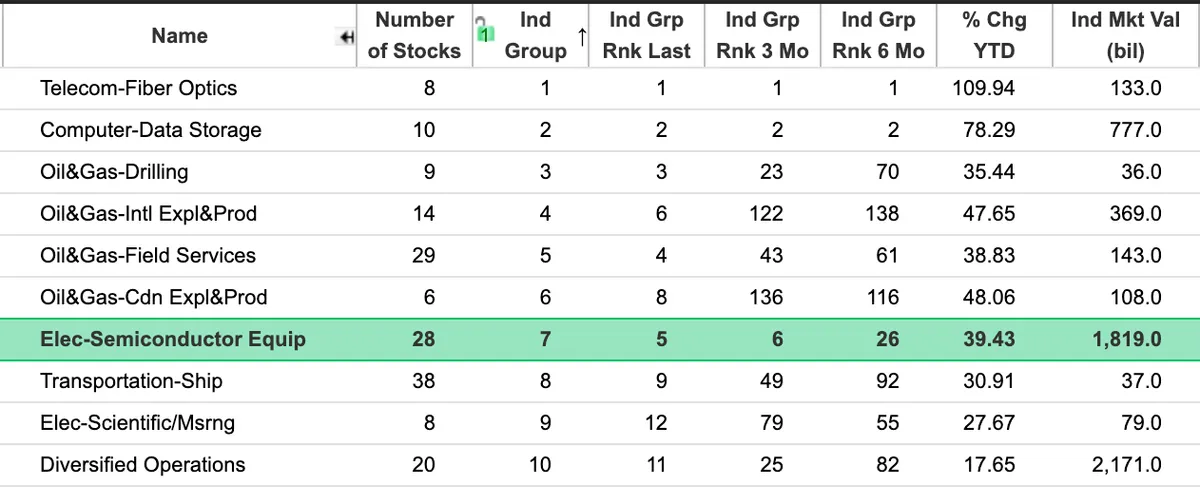
When we look at the Top 10 Industry Groups right now, we’re seeing clear clustering of strength:

  • Telecom: AAOI, LITE, CIEN, VIAV

  • Computer Data Storage: SNDK, WDC, STX

  • Semiconductors: TER, AEIS, AEHR, LRCX

All showing up in the top groups.

This is exactly how leadership reveals itself.

It’s not just one stock. It’s clusters of strength moving together.

When you start seeing multiple names across the same industry groups all:

  • Breaking out

  • Showing strong relative strength

  • Backed by strong fundamentals

That is not random.

That is institutional money flowing into a theme.

This is how real trends work.

Stay focused on where the strength is clustering, just like we teach in the MTS Course. https://tradingmomentum.substack.com/s/mts-course

How do we find the strongest names in the strongest groups?

Relative Strength Stock Screener.

Use it now as part of the MTS Web App https://momentumtradingstrategy.app/

That’s where the opportunity is.

momentumtradingstrategy.appMomentum Trading Strategy
View on Substack ↗

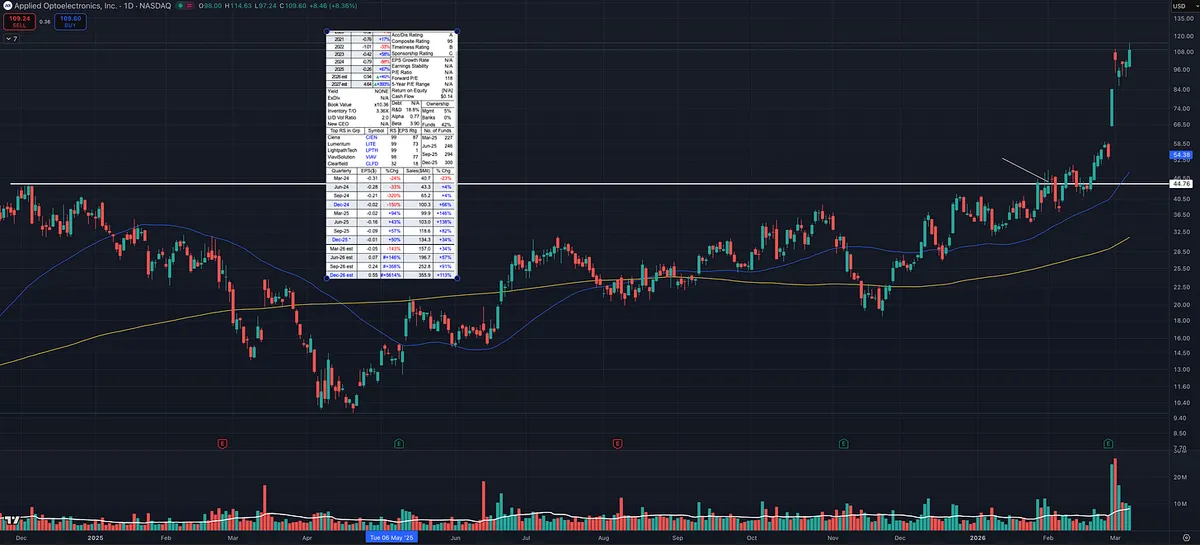
Why I Mentioned AAOI Before Earnings

Someone asked why I mentioned AAOI in early February with earnings coming up.

First, the stock checked several boxes I look for.

It was in a HOT group (telecom) showing strong relative strength across multiple timeframes. I had already seen success with LITE and CIEN, which are in the same space. It reminded me of past industry runs like the computer data storage group when SNDK, MU, WDC, and STX all moved together.

AAOI also had:

• Strong earnings and sales acceleration

• Rising forward estimates

• Accelerating fund ownership

• Tight price action on the right side of the chart

• Trading near new 52 week highs

Since that mention the stock has moved about 150%, but the trade management is the important part.

I normally do NOT buy a stock a few days before earnings. There is too much risk and no time to build a cushion.

I follow the advice from Paul Tudor Jones:

“Never trade in situations where you don’t have control. For example, I don’t risk significant amounts of money in front of key reports, since that is gambling, not trading.”

In this case there were about three weeks before the report, which gave the trade time to work.

From the original buy, the stock moved roughly 30% before earnings.

At that point the plan becomes simple:

• Trim a large portion before the report

• Lock in gains and reduce risk

• Hold a smaller position into earnings

Even great stocks can drop 15–20% overnight on earnings.

By trimming beforehand, the position already has a profit cushion, so the remaining shares carry much less risk.

This is something I learned studying the playbooks of William O’Neil, Mark Minervini, and David Ryan.

The goal isn’t predicting earnings.

The goal is managing risk while letting strong stocks work in your favor.