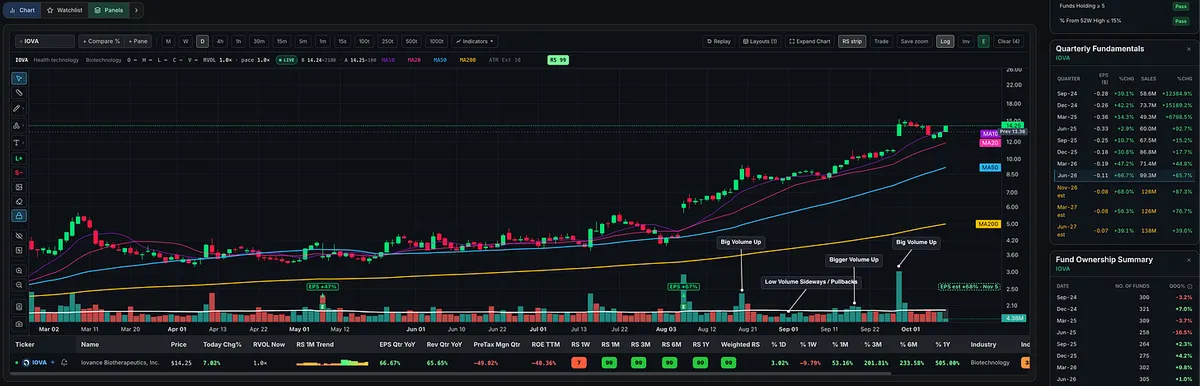
IOVA: A Great Example of Price, Volume, and Trend Alignment
This is exactly the type of price and volume action I look for in leading stocks.
Volume expands on advances, suggesting strong institutional buying demand.
Volume dries up during sideways consolidations and pullbacks, indicating relatively light selling pressure.
Price remains tight during pauses before momentum returns.
Moving averages are properly stacked: 10-day > 20-day > 50-day > 200-day, all trending higher.
Relative Strength: 99, demonstrating exceptional price leadership.
Now, let's look at the fundamentals, because this is a biotech.
$IOVA reported quarterly sales growth of 65.7% YoY, while EPS improved 66.7% YoY. However, earnings remain negative at -$0.11 per share, and forward estimates are still negative.
That EPS improvement means the company is losing less money, not that it's generating positive earnings. I place much more weight on the actual sales growth and the trend toward profitability than on that EPS percentage.
This is where William O'Neil and Mark Minervini differ somewhat.
O'Neil's CAN SLIM methodology strongly emphasizes positive, accelerating earnings and sales growth. A company reporting smaller losses generally wouldn't meet his preferred earnings criteria.
Minervini, while also favoring strong earnings and sales, makes exceptions for certain situations, particularly biotechs. He explains that many biotechs lack positive earnings, so he will evaluate them based on technical strength, price and volume, and potential drug-development catalysts.
I take a similar approach. With biotechs, I'm willing to overlook negative ROE and pre-tax margins when other characteristics are compelling. That doesn't mean fundamentals don't matter. Strong sales growth, improving losses, and a potential path to profitability are still important.
IOVA is an excellent chart to study for price and volume characteristics, relative strength, and moving average alignment.
Not every leading stock will check every fundamental box, particularly in biotech. Learn to recognize the characteristics that matter, understand the industry you're trading.