Momentum Trading Strategy

Notes

Finding Leading Stocks

What to buy: how to find, screen and rank the strongest stocks and industry groups.

Showing 21–40 of 299 notes

View on Substack ↗

SMTC: New Highs. Big Volume. Accelerating Growth.

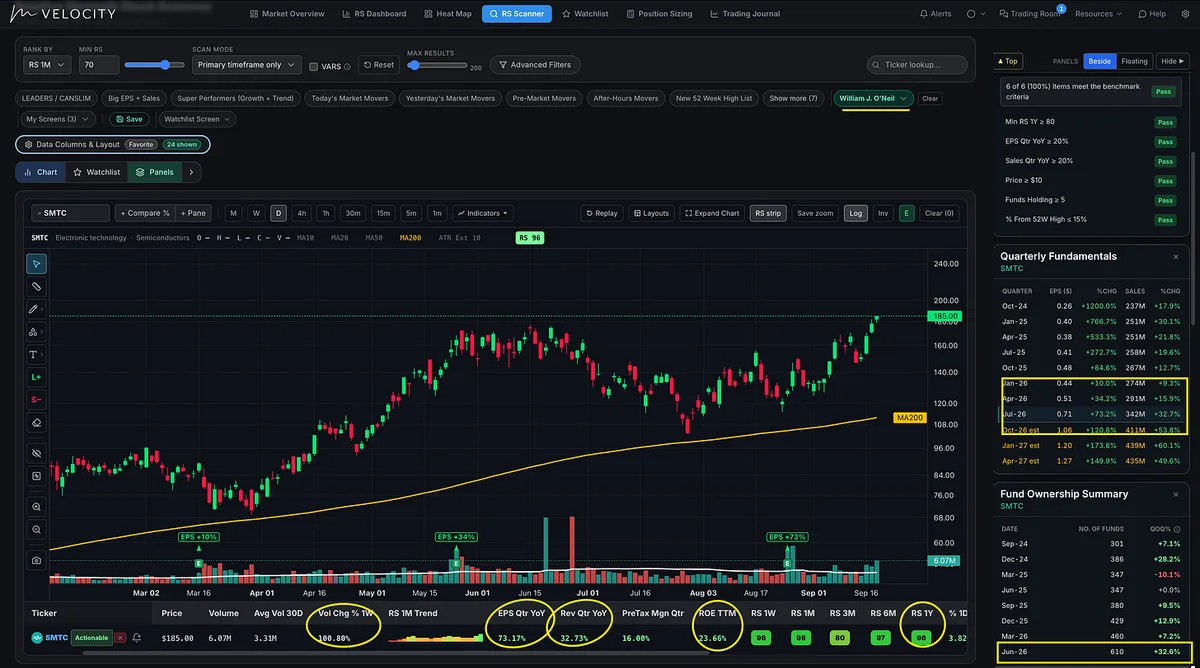
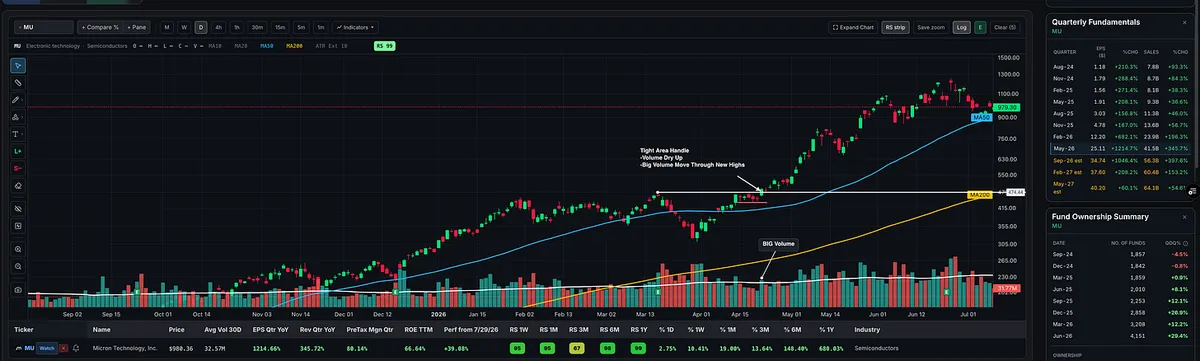
SMTC showed up in our RVOL Now scan in MTS Velocity on Wednesday morning, September 16. Three consecutive sessions of heavy volume followed through Friday’s close as the stock broke out to new 52-week highs.

The setup had been developing: a strong earnings release on August 25, followed by price tightening up the right side of the base before this week’s breakout.

And the numbers behind the chart?

  • Earnings growth accelerated: +10% → +34% → +73% over the last three reported quarters.

  • Sales growth accelerated: +9% → +16% → +33% over the same period.

  • Fund ownership expanded: 460 funds → 610, a 32.6% increase from the previous quarter.

  • Return on equity: 23.7%.

  • One-year Relative Strength rating: 96.

Earnings and sales figures above are year-over-year growth.

This is the combination I look for: accelerating earnings and sales, increasing institutional sponsorship, strong relative strength, and strong price and volume action backing the breakout to NEW Highs.

View on Substack ↗

The Heat Map Said Shipping. The Stock Scan Said $FRO.

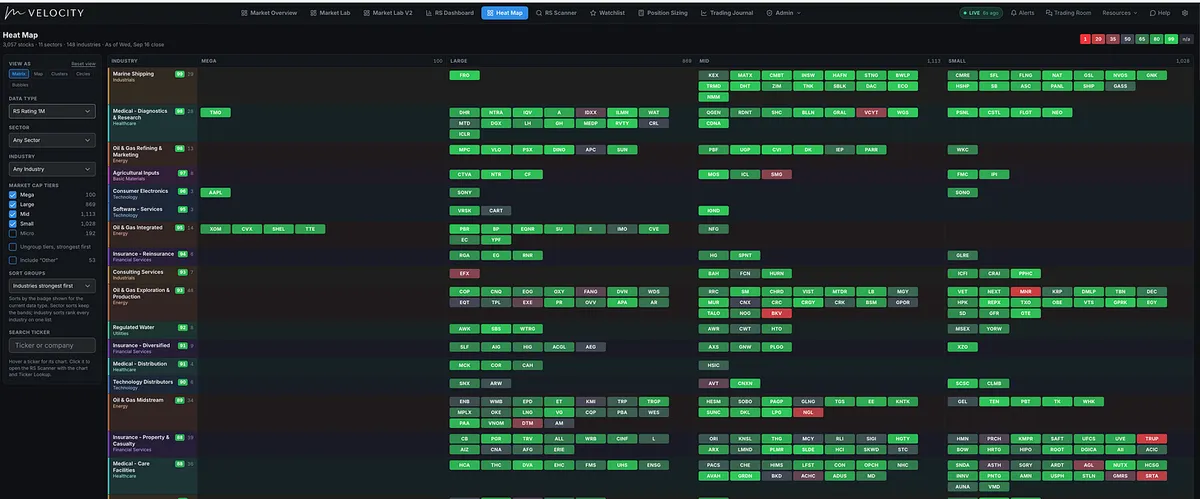
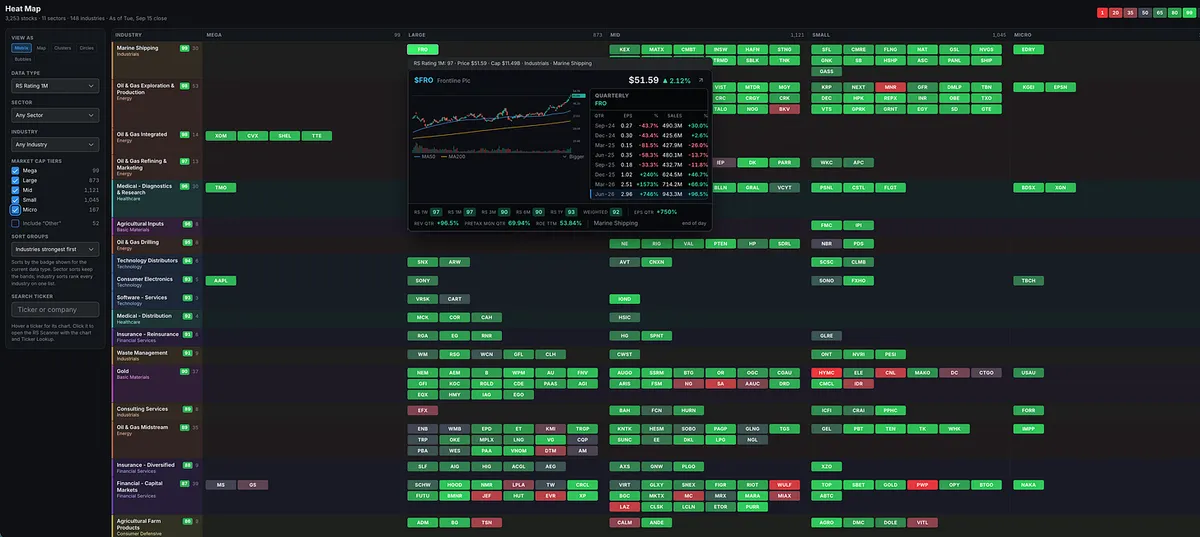
Marine shipping has been one of the strongest industry groups for some time. You can see it on our MTS Velocity heat map, and you can see it showing up in our stock screens.

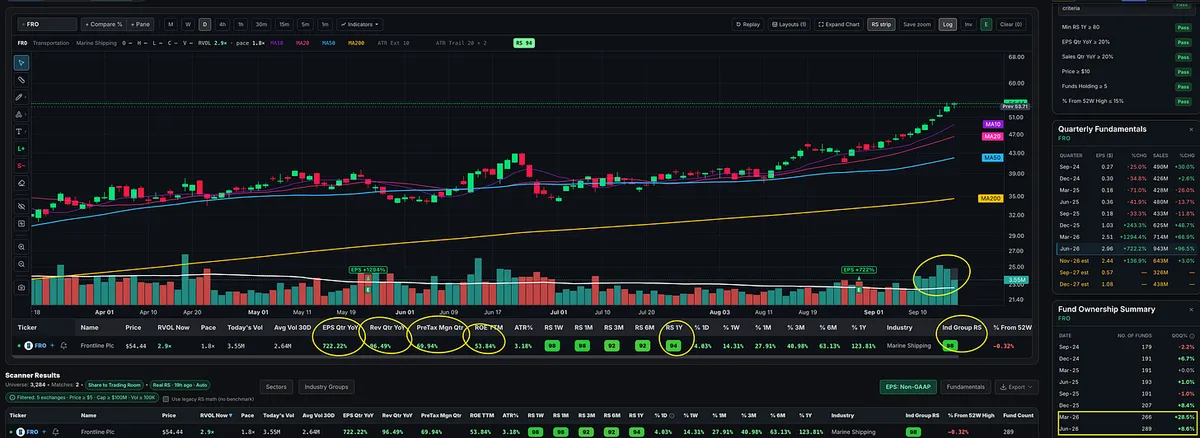
Today, $FRO stood out among the volume movers meeting my CANSLIM-based screening criteria:

• Big earnings and sales growth

• Strong margins

• High relative strength

• A strong industry group

And look at the trend it has formed this September. The moving averages are stacked exactly how I like them:

10-day > 20-day > 50-day > 200-day. All pointing higher.

View on Substack ↗

Rates Up. Growth Holds Up.

The initial reaction caught my attention.

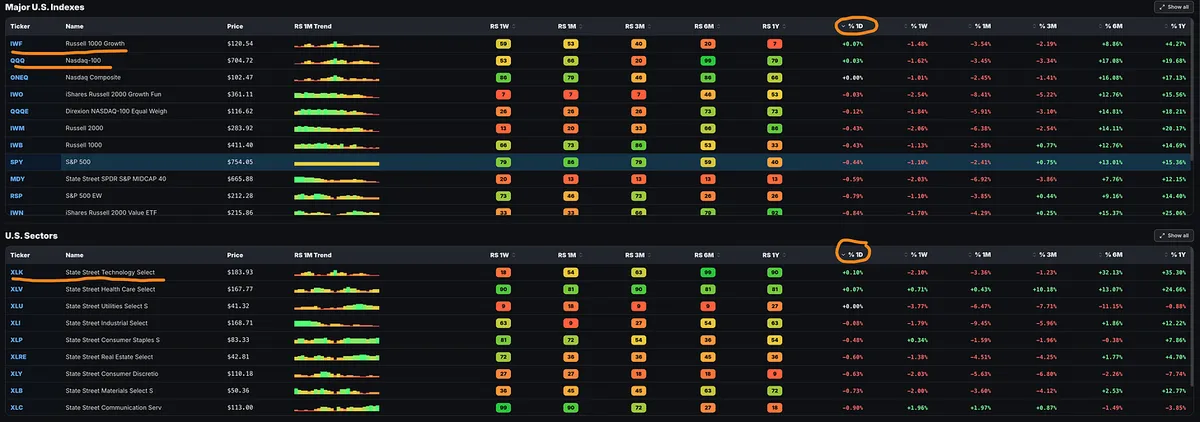
The Nasdaq 100 and Russell 1000 Growth led the indexes I track. Technology was the top sector, with strength in memory and semiconductor names.

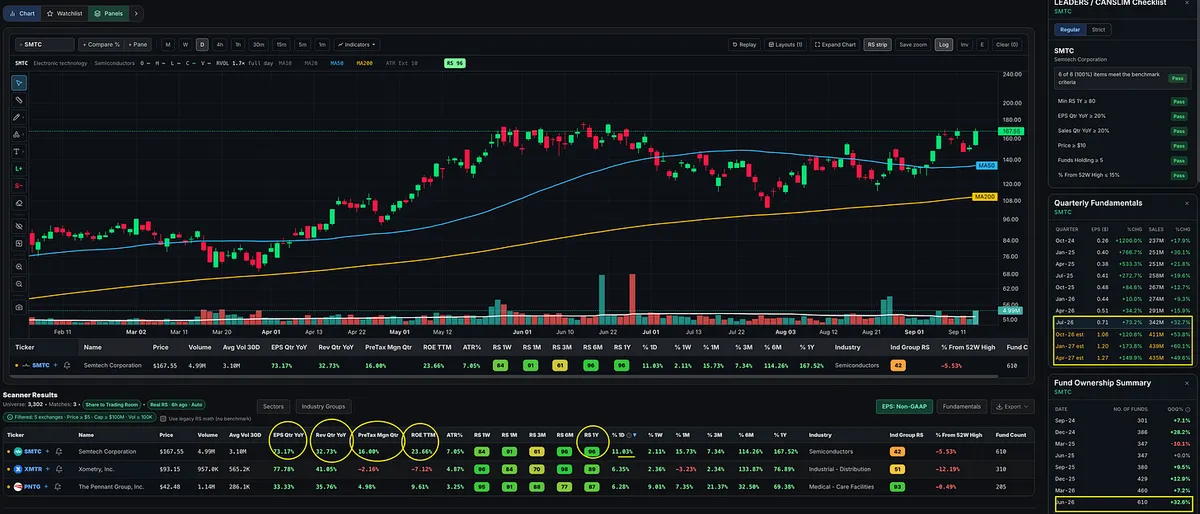
That same theme showed up when I opened the MTS Velocity RS Screener and looked for today’s strong performers meeting my growth-based earnings and sales criteria.

One standout: SMTC, Semtech, up 11.03%.

The numbers behind the move:

  • Quarterly earnings growth: +73.17% year over year.

  • Quarterly sales growth: +32.73% year over year.

  • Return on equity: 23.66%.

  • Quarterly pretax margin: 16%.

  • One-year relative strength rating: 96.

And institutional sponsorship is expanding. The latest reported fund count increased 32.6%.

That’s a semiconductor stock showing strong growth, profitability, high relative strength, and increasing fund participation, gaining 11% with BIG volume on a rate-hike day.

One session doesn’t settle the market’s direction. But seeing the same strength emerge across indexes, sectors, and individual stocks is information worth paying attention to.

View on Substack ↗

The Best Stocks Often Show Their Strength Before the Market Does

One of the things I love about studying the old masters is how often the same ideas show up decades apart.

Nicholas Darvas wrote about sitting on the sidelines during the 1957 market decline and watching for stocks that refused to go down with everything else.

“I tried to detect those stocks that resisted the decline. I reasoned that if they could swim against the stream, they were the ones that would advance most rapidly when the current changed.”

That is relative strength in its purest form.

Darvas noticed that while most stocks were falling with the general market, a small group began giving ground reluctantly. He later found that many of those companies also had sharply improving earnings trends. His conclusion was that capital was already flowing into them even while the broader market was weak.

That is exactly why I spend so much time looking for stocks holding up near their highs during corrections.

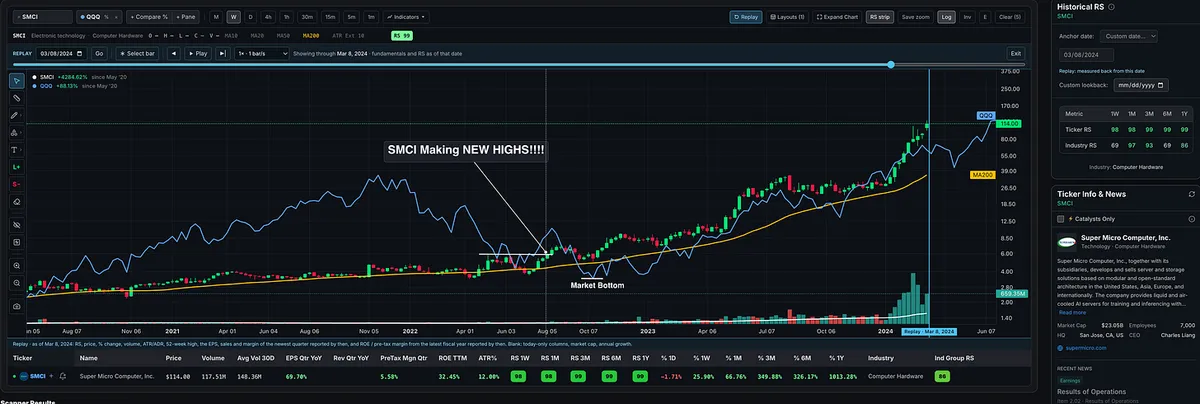
This is exactly what I did with SMCI back in 2022.

While the broader market was still in much worse shape, SMCI was already showing unusual strength. It was holding up far better than the indexes, its relative strength was improving, and as the market began to bottom and turn higher, SMCI was already pushing into new highs.

That strength was information.

The stock that refuses to break while everything around it is getting hit is telling you something.

Then, when the market finally turns, you often don’t have to go searching for leadership from scratch.

The leaders may have already identified themselves.

Darvas later described Lorillard doing exactly this. While most stocks were drifting or falling, Lorillard rose from 17 into a tight 24–27 area with a huge increase in volume. He called its strength in the face of a weak market “very impressive,” then bought as it pushed toward a higher range.

Different decade. Different stocks. Same behavior.

When the market gets weak, don’t only look at what is falling. Pay close attention to what refuses to fall.

Those stocks may be showing you where the next leadership is forming.

View on Substack ↗

Want to Know Where the Strength Is? Rank the Entire Market.

One of the simplest things I do in MTS Velocity is ask: show me the strongest industry groups first.

This is the market ranked by 1-month Relative Strength across 140+ industry groups.

Look at what rises to the top.

Marine Shipping: 99 RS

Oil & Gas Exploration & Production: 98

Oil & Gas Integrated: 98

Oil & Gas Refining & Marketing: 97

Oil & Gas Drilling: 95

You don’t have to guess where strength is developing.

Rank the groups. Find where relative strength is concentrating. Then drill down into the strongest stocks inside them.

Leadership leaves clues. Your job is to find them.

View on Substack ↗

I Asked MTS Velocity for Growth. It Gave Me Oil.

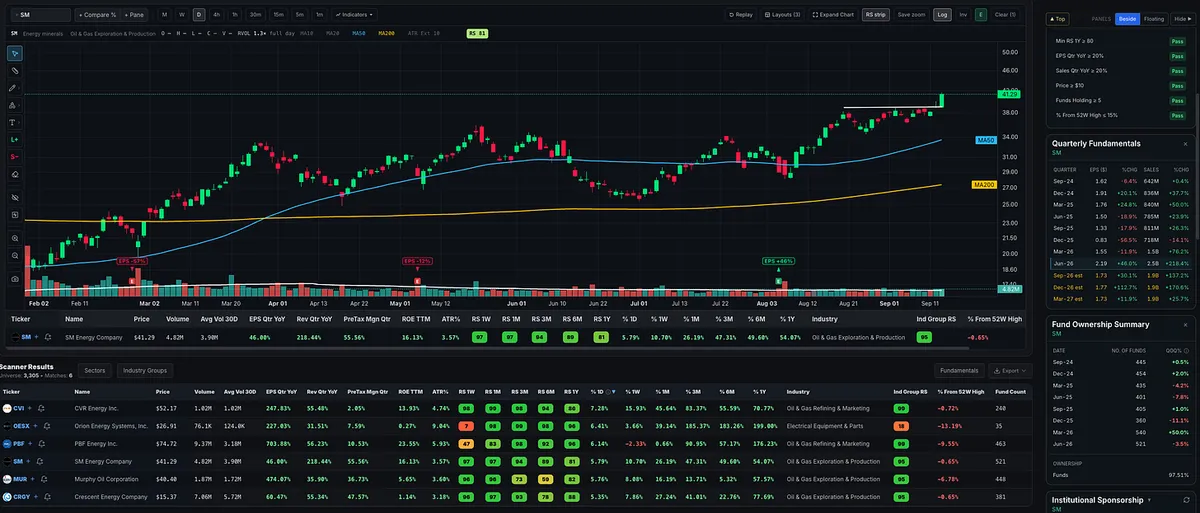
I started with my normal tradable universe of roughly 3,300 NYSE and Nasdaq stocks, after basic price, liquidity, and market-cap filters.

Then I ran a simple scan in MTS Velocity: show me stocks moving higher that also have high relative strength, big earnings growth, big sales growth, and are within 15% of their 52-week highs.

Almost every stock that made the final list was oil and gas.

Not AI. Not software. Not semiconductors.

Oil and gas.

Your stock screens will tell you what is actually happening in the market more than any headline, narrative, or opinion ever could.

View on Substack ↗

“It’s Already Gone Up Too Much.” Look Again.

Sometimes, the move that makes you dismiss a stock is the move that should put it on your watchlist.

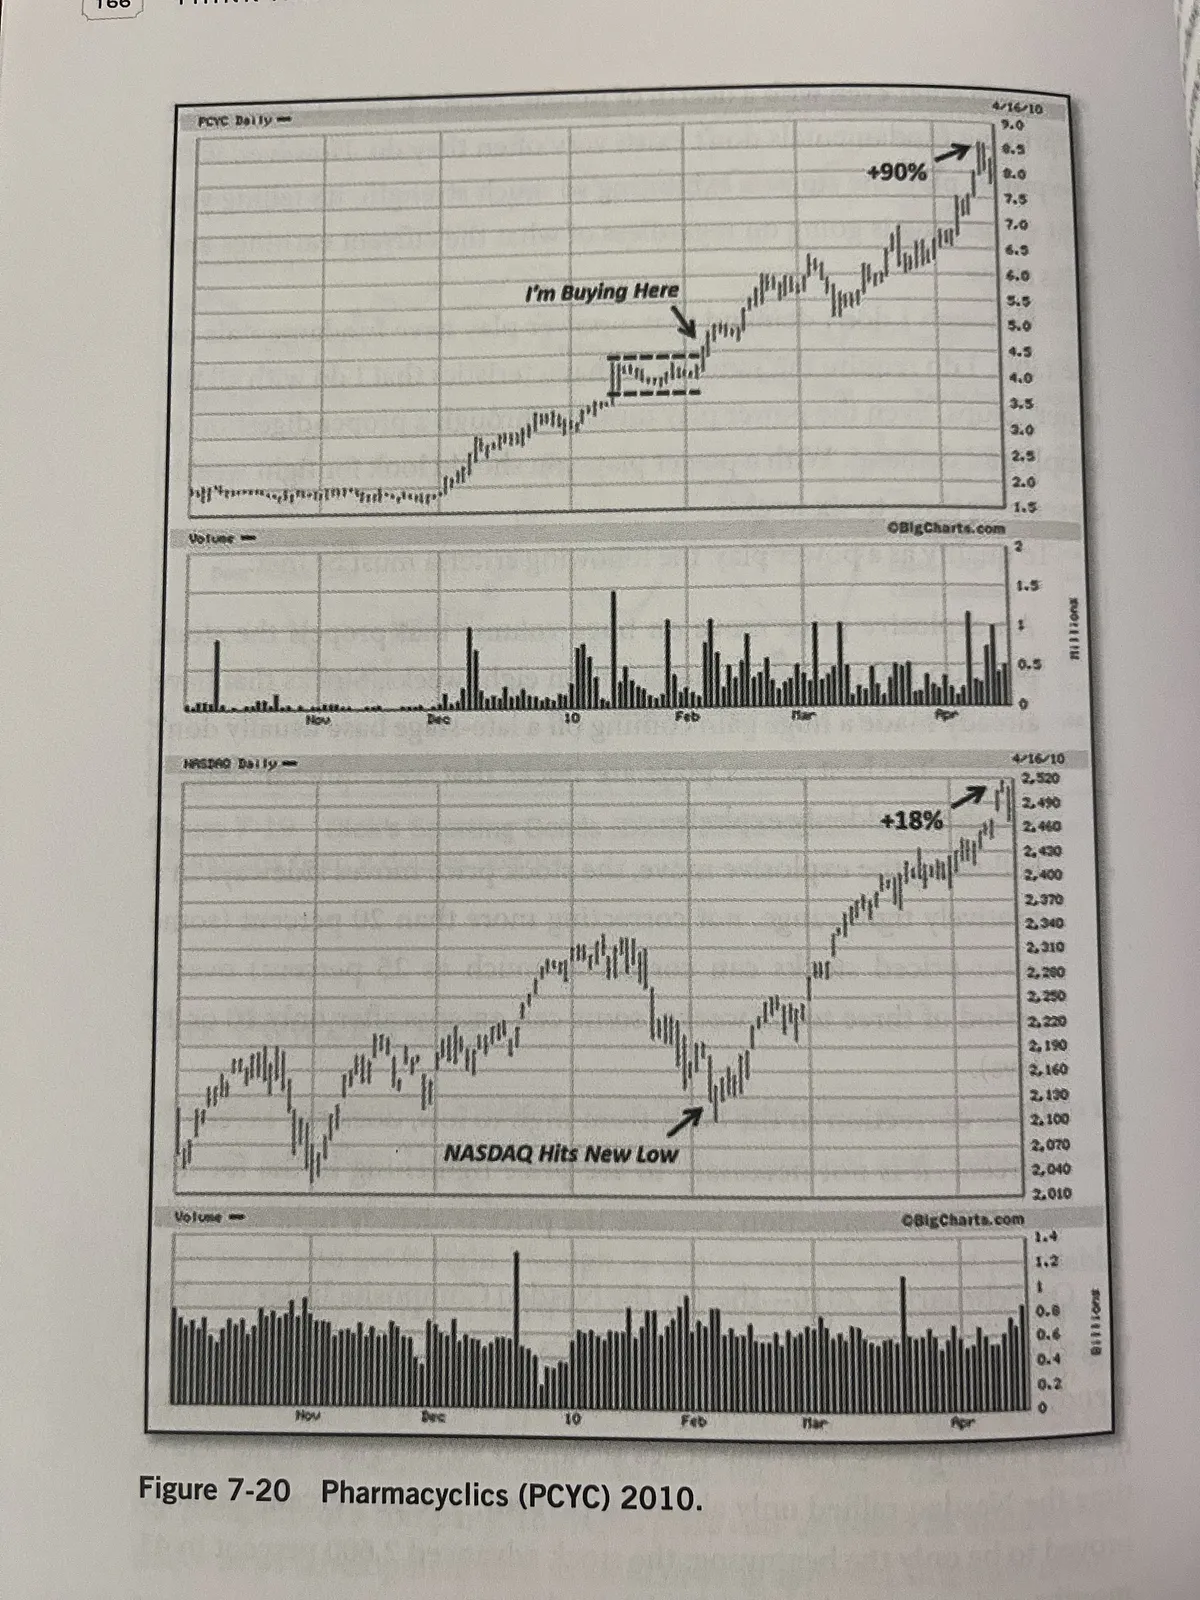
Look at Pharmacyclics (PCYC) in this 2010 chart from Mark Minervini’s book. The stock had already made a powerful advance before settling into a tight, sideways pause. While the Nasdaq was selling off toward a correction low, PCYC was holding up remarkably well.

That’s a form of relative strength. The market was struggling, but the stock was refusing to give back much ground.

When the market bottomed and started turning higher, PCYC was already breaking out to new highs. Notice where Minervini marks his purchase. He wasn’t buying the bottom or chasing the initial surge. He was buying as the stock emerged from that tight consolidation.

A lot of people look at the earlier advance and think, “I missed it. It’s already made its run.” But that strength can be the first evidence of a potential market leader, not proof that the opportunity is over.

There’s a difference between a stock that has already made a big move and a stock that is extended from a proper entry.

The prior advance gets my attention. The way the stock handles its next pause helps determine whether there’s a trade. Does it hold up while the market weakens? Does it tighten up rather than fall apart?

This is exactly what I still look for today. Many of the stocks I’ve shared had already made substantial advances before forming their next setup. During that quiet pause, when other people lose interest and move on, I’m often paying closer attention.

Not every setup works. But the same patterns and characteristics continue to appear.

Don’t automatically cross a stock off your list because it already ran. Watch what it does next.

View on Substack ↗

3 Matches. One Standout.

A stock moving higher is not enough. I want to see earnings, sales, relative strength, and volume backing the move.

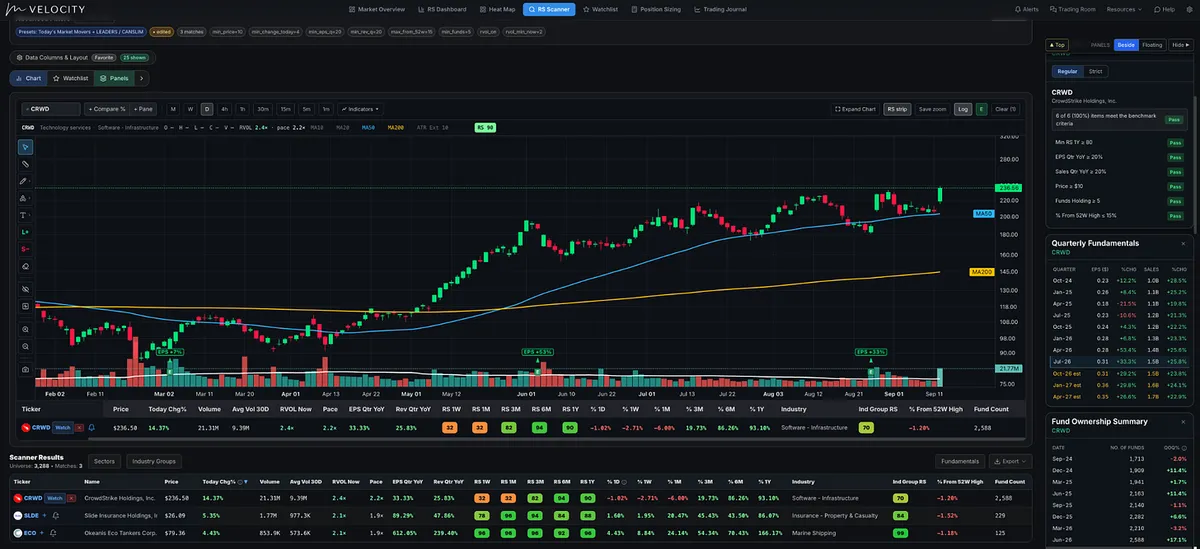
Today’s scan in MTS Velocity: find market movers meeting my CANSLIM-based earnings and sales growth criteria, with high relative strength, prices within 15% of their 52-week highs, and RVOL of at least 2.0.

My starting universe already excluded OTC stocks, stocks below $5, and names that didn’t meet my minimum volume and market cap requirements.

3,288 stocks. Just 3 matches.

The standout: $CRWD.

We spotted it near the open using RVOL Now. CrowdStrike is up 14.37%, with 2.4× RVOL Now and a 90 Relative Strength rating. Quarterly earnings per share grew 33.33% and sales grew 25.83% year over year.

Here’s why RVOL Now matters.

At say 10:15 AM, a stock’s daily volume bar can still look small. Most of the trading day hasn’t happened yet but that stock could already be trading at three times its normal volume for that time of day.

Comparing partial-day volume with a full day’s average can hide that activity.

RVOL Now compares the volume traded so far with what that stock normally trades by the same minute of the day. It uses the stock’s own last 20 sessions or whatever lookback you choose, with earnings days and half days excluded, and updates every minute.

A 3× reading at 10:15 means three times its usual volume by 10:15. You don’t have to wait for the daily volume bar to look impressive.

View on Substack ↗

See the Entire Market in 10 Seconds

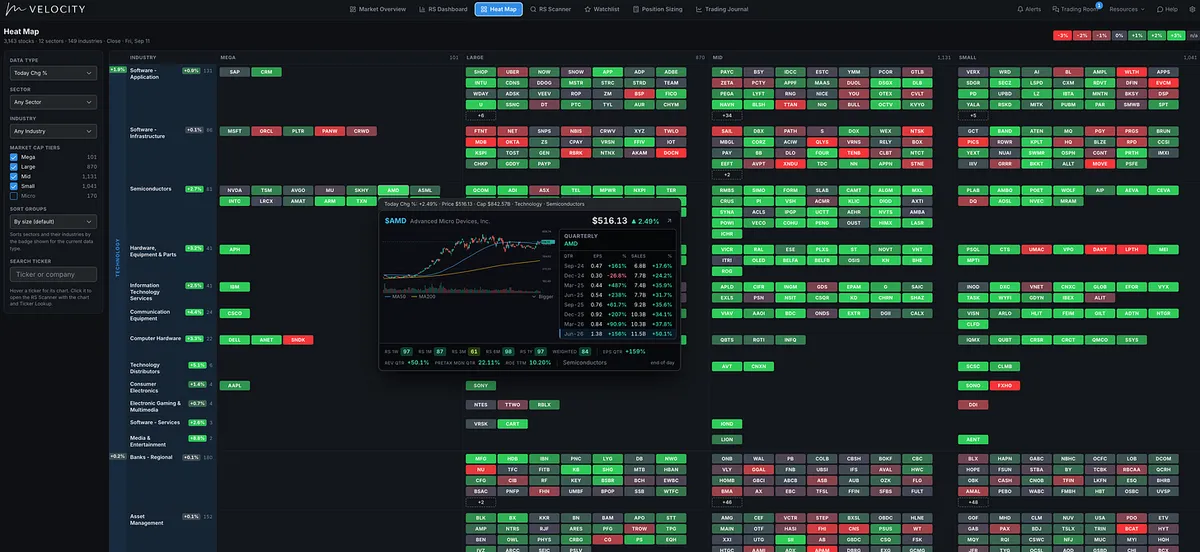
We just pushed a new Matrix Heat Map live inside MTS Velocity, and this is quickly becoming one of my favorite ways to scan the market.

Instead of flipping through hundreds of charts trying to figure out where strength is concentrating, you can see it immediately across sectors, industries, and market-cap tiers.

You can sort the entire market by:

• Price performance

• Relative Strength across multiple timeframes

• Custom Relative Strength periods

• MTS Score, our proprietary composite ranking

• Market cap and size

The real value is being able to quickly answer questions like:

Where is the money flowing?

Which industries are showing broad strength?

Are the leaders mega caps, small caps, or somewhere in between?Which stocks are separating themselves from their peers?

Hover over a ticker and you can instantly see the chart, Relative Strength readings, earnings and sales growth, margins, and other key data.

Then, if something catches your eye, just click the ticker and it opens directly inside the RS Scanner for deeper research.

Big shoutout to Raj for suggesting this feature. So many of the best additions to MTS Velocity have come directly from ideas shared by MTS members, and I really appreciate everyone helping shape the platform into something better.

If you already have access to MTS Velocity, go give the new Heat Map a whirl and let me know what you think.

View on Substack ↗

The Earnings Catalyst That Can Start a Major Move

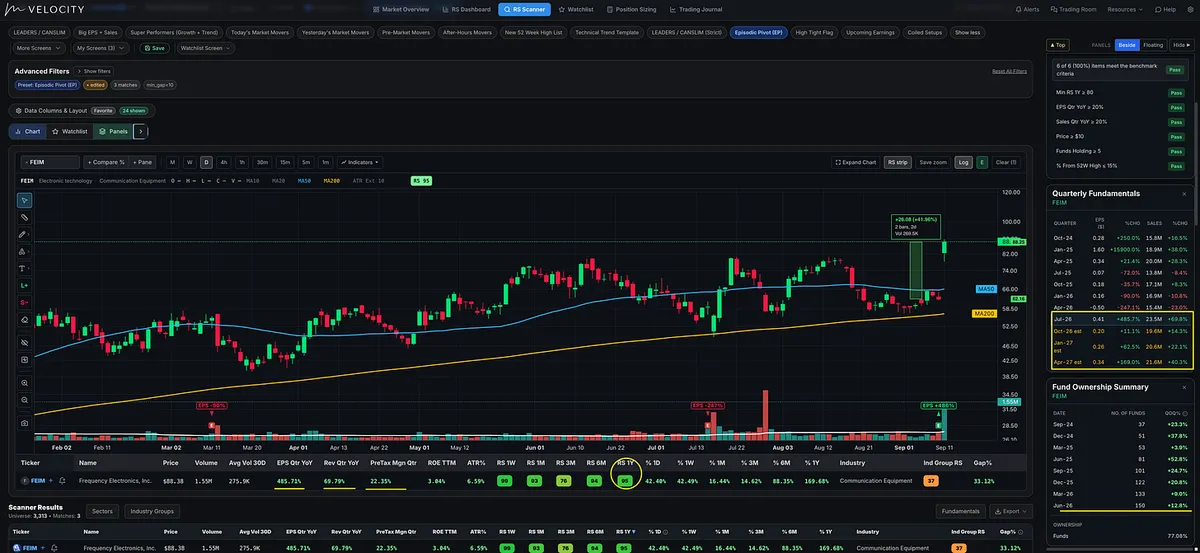
FEIM is a great example of what I mean by an earnings catalyst. The company reported roughly +486% EPS growth and +70% sales growth, and the stock responded with an explosive move on heavy volume.

This is the type of earnings catalyst that has shown up repeatedly in the work of O’Neil, Minervini, Zanger, and Kullamägi.

Different traders, different terminology, but the same underlying idea: a major fundamental surprise can cause the market to rapidly reprice a stock, and the resulting price and volume expansion tells us institutions may be paying attention.

View on Substack ↗

Tightness Is the Setup. Leadership Is the Filter.

A beautiful chart pattern can still belong to the wrong stock.

A laggard can form a cup. A weak company can get tight. Recognizing the shape is only the beginning.

What matters is WHAT is getting tight.

William O’Neil combined chart analysis with strong earnings and sales growth, relative strength, institutional sponsorship, and the other characteristics he found in the market’s biggest winners.

The quality of the stock and the quality of the setup belonged together.

He described tight price action and drying-up volume at key points in a base as constructive. They can signal that selling pressure has diminished and less stock is coming to market.

Mark Minervini applies a similar principle. His SEPA process first qualifies the stock’s trend, then evaluates fundamentals and leadership characteristics. The VCP helps identify a precise entry as price swings contract and volume dries up.

That’s the combination I want: a strong candidate developing a setup where I can define my entry and risk.

A pretty pattern doesn’t turn a laggard into a leader.

And even a leader getting tight doesn’t automatically make it a buy. I still want price confirmation at the pivot, evidence of demand, and a market environment that supports the trade.

Strong fundamentals never excuse a failed setup or override my exit rules.

Leadership gets the stock onto my watchlist. Tightness gets me ready. The move through the pivot gives me the trigger.

View on Substack ↗

“Buy Low” Can Keep You Buying All the Way Down

Stan Weinstein wrote in Secrets for Profiting in Bull and Bear Markets:

“Buy low, sell high is a cliche, not a blueprint for action.”

A stock falls from $100 to $70. You call it a bargain.

At $50, it looks even cheaper.

But the chart keeps deteriorating, and the price you remember keeps convincing you to buy.

Weinstein’s approach was to buy strength as a stock broke out of a base into Stage 2, its advancing phase, supported by strong volume.

That often meant paying more than someone who bought near the bottom.

His newsletter’s motto was “The Tape Tells All.”

His point was that prices already reflect known information and expectations. A stock can begin advancing before the headlines or reported earnings make the opportunity feel comfortable.

That’s why I want to see what price and volume are telling me.

I still need a proper entry, a logical stop, and controlled risk. An impressive advance alone doesn’t mean chasing.

But I’m willing to pay a higher price when the stock offers a better setup.

The lowest price and the best buying opportunity aren’t the same thing.

View on Substack ↗

The Earnings Look Great. The Stock Disagrees.

Imagine a company reports earnings up 50% and sales up 30%. You love the numbers. Then the stock gaps down on heavy volume and breaks support.

Your first thought: “That makes no sense. The report was great.”

Martin Zweig addressed this in Winning on Wall Street:

“The worst thing the stock can do on news of earnings is to drop sharply.”

Zweig looked for earnings and sales growth, just like O’Neil, but he also examined how the stock reacted. A sharp decline could eliminate a stock from consideration, even when the report looked good to him.

The trap is becoming so attached to the numbers that we use them to justify holding, adding, or giving a deteriorating stock “a little more room.”

We use strong earnings and sales growth as screening criteria because those characteristics have appeared in many of the market’s biggest winning stocks, including many of our own winners.

But those fundamentals never trump price action.

The market is full of emotional human beings acting on different expectations, fears, and information. The market is also forward looking and its behavior doesn’t have to make sense to you. Believing a stock should be going higher won’t stop it from going lower.

That’s what I mean when I say the market is always right. Whatever our analysis says, the price determines what happens to our money.

We don’t have to agree with the price action. We do have to respect it.

View on Substack ↗

LITE is getting interesting again.

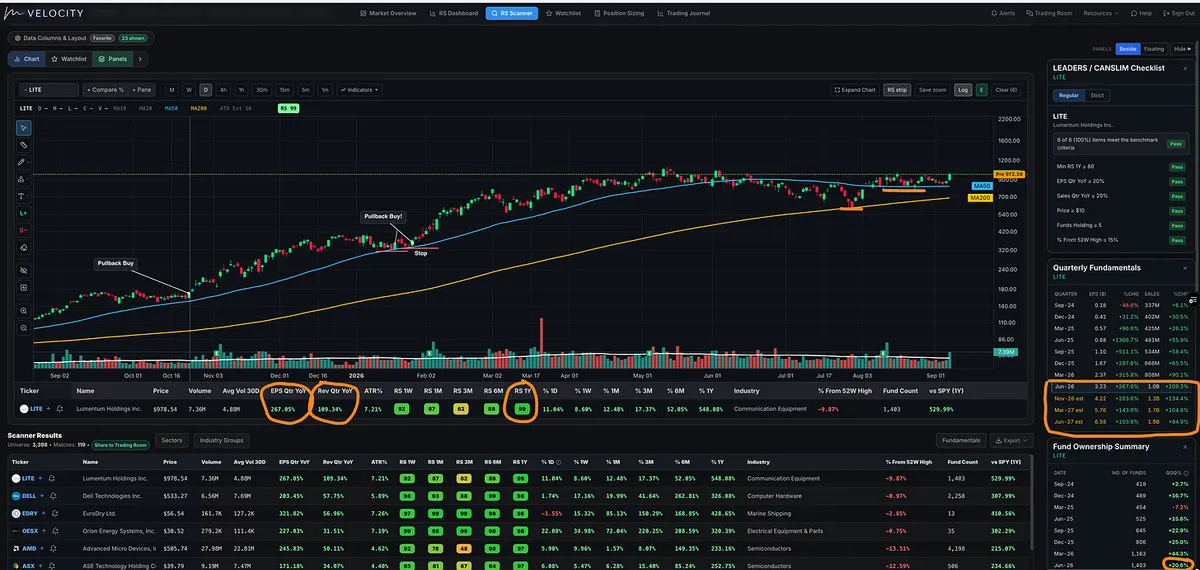
LITE rallied off its 200-day moving average when the market made its low on July 29.

Unlike a lot of the other prior big winners, it has since reclaimed its 50-day / 10-week moving average and continued to hold support. Now it sits less than 10% from all-time highs.

And the fundamentals are still extremely strong.

LITE has been putting up triple-digit earnings growth, triple-digit sales growth, and carries a 99 one-year Relative Strength Rating.

Institutional sponsorship has also been expanding aggressively, with the number of funds owning the stock growing roughly +20% quarter over quarter.

We saw bigger volume coming off the lows and around earnings. Then, as the stock moved sideways and found support around the 50-day, volume dried up considerably.

Yesterday, big volume came back in as LITE pushed toward the top of the consolidation.

Back in January, people told me LITE looked too volatile.

Then they missed the next roughly 100% leg higher.

They told me the same thing back in October 2025.

Welcome to growth stock and momentum trading. 😉

The biggest winners are rarely going to look comfortable.

View on Substack ↗

Never buy a stock because it appears cheap after getting smashed

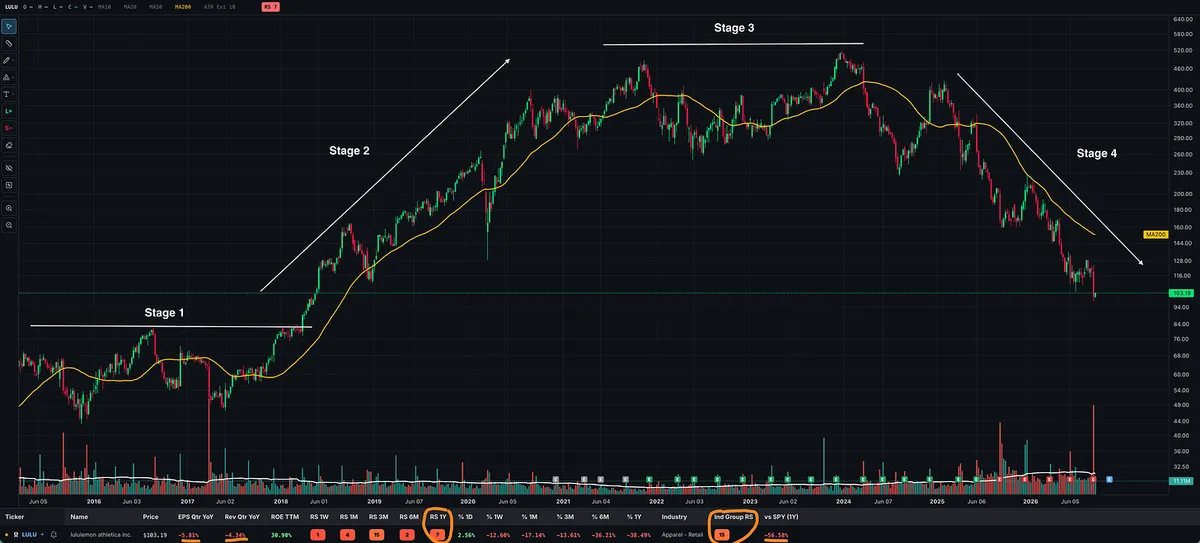
Stan Weinstein wrote that in Secrets for Profiting in Bull and Bear Markets. LULU shows why the warning matters.

Weinstein’s framework follows four stages:

Stage 1: The base.

Stage 2: The advance.

Stage 3: The topping phase.

Stage 4: The decline.

On this chart, LULU is making lower highs and lower lows beneath a falling moving average.

Yet every lower price can tempt someone into calling it a better deal. They remember the old high, love the brand, and start averaging down while the chart keeps deteriorating.

The old price doesn’t tell you where the decline will end.

Averaging down increases your exposure. It doesn’t turn Stage 4 into Stage 2.

I want to see a proper base develop and evidence of a new advance. A stock has to earn its place back on my buy list.

Being cheaper than it used to be isn’t enough. If the chart is still breaking down, that “discount” can keep getting bigger.

View on Substack ↗

Marine Shipping Is Showing Exactly What O’Neil Taught

“The majority of the leading stocks are usually in leading industries.” — William O’Neil, How to Make Money in Stocks

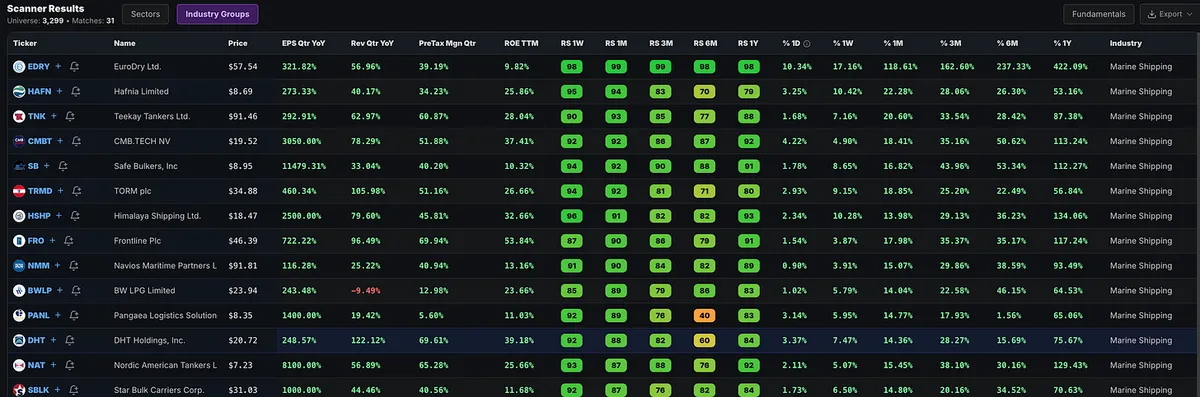
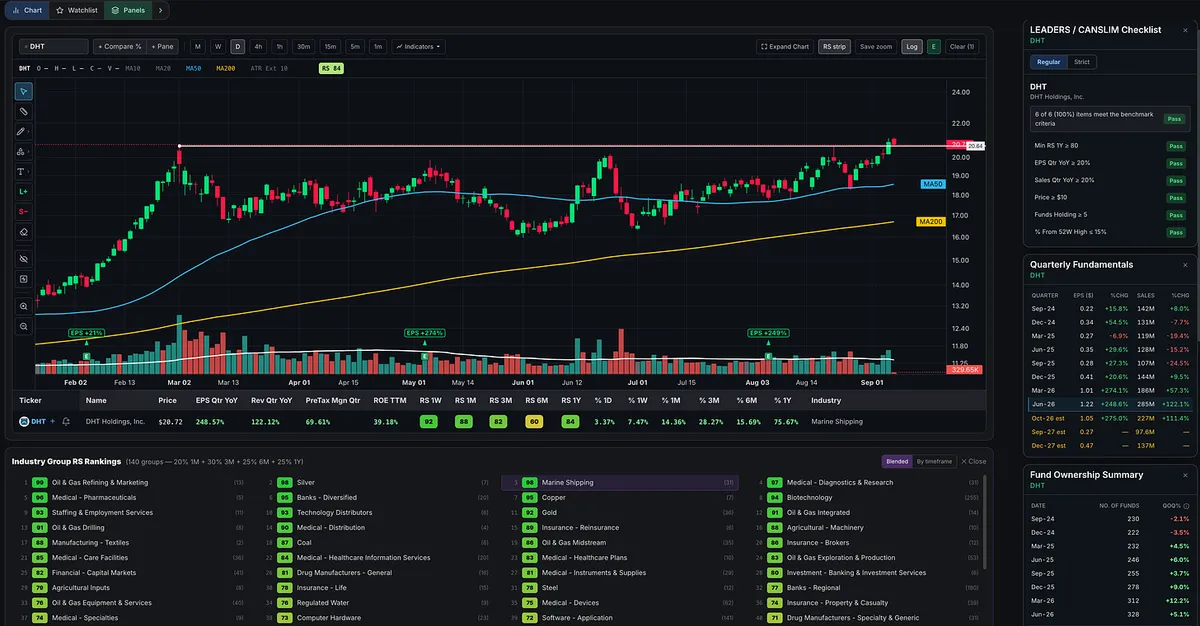
Look at the Marine Shipping strength in MTS Velocity. The group ranks #3 out of 140 industry groups, with a blended relative strength rating of 98.

EDRY, TNK, SB, TRMD, FRO, DHT. Multiple names are advancing together, with strong earnings growth and relative strength showing up across the group. This is exactly why I look beyond an individual stock’s chart and check what its peers are doing.

DHT is one example, working through resistance near $20.64 after a multimonth base. The attached screen shows quarterly earnings growth of approximately 249%, sales growth of 122%, and fund ownership climbing from 222 to 328 funds since December 2024.

Strong fundamentals. An improving chart. A leading industry group behind it.

That doesn’t make every shipping stock a buy. O’Neil emphasized selecting the leaders within strong groups, and we still need a proper entry and a defined exit if the trade fails.

Before you buy a stock, look at the company it keeps.

View on Substack ↗

The Best Setups Often Look the Scariest

Some of the strongest stocks will look expensive by the time you notice them.

That doesn’t automatically make them bad trades.

I want stocks showing relative strength. A strong advance gets my attention, then I look for a proper setup where I can define my entry and risk.

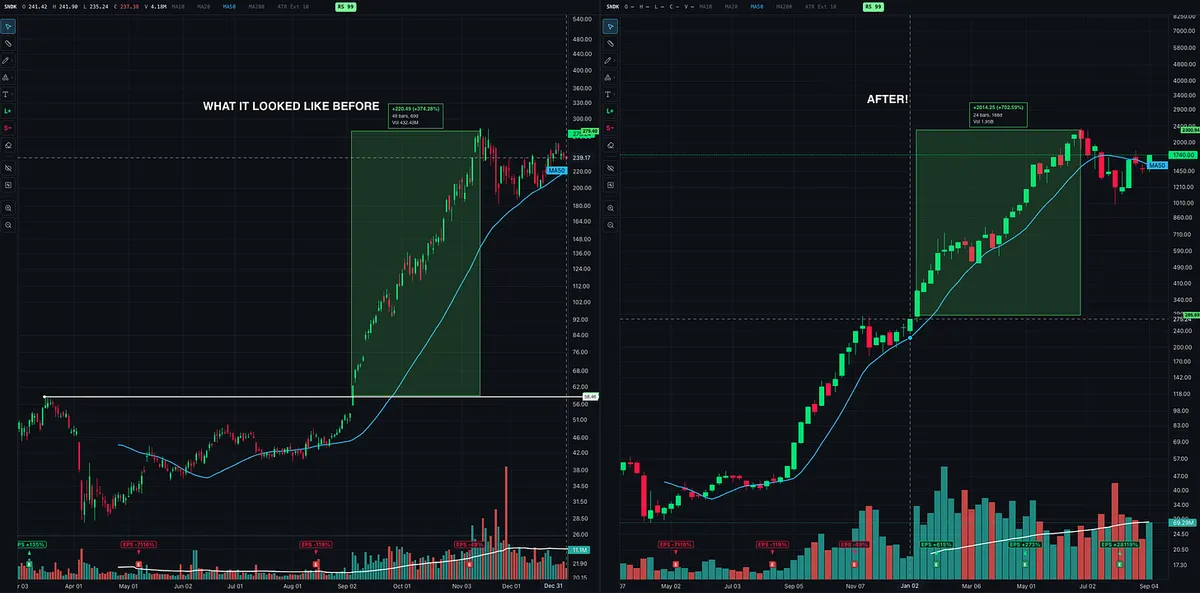
Look at SNDK. The first highlighted advance was roughly 374%. It then consolidated, and the next marked advance was roughly 703% to the later peak.

If I dismissed it because it had “already gone up too much,” I would have stopped looking before the next setup developed.

The trap is letting the price you could have paid months ago determine whether today’s opportunity deserves consideration.

A strong stock still needs a proper entry, a logical stop, and a position size that fits the risk. Its earlier advance doesn’t replace any of that.

Don’t confuse discomfort with danger. Judge the setup in front of you, not the price you wish you had paid.

View on Substack ↗

95% of His Money Came From Stocks at New Highs

Dan Zanger was asked whether he ever bottom-fished.

His answer:

“All the biggest-moving stocks I’ve owned during the past 20 years, where I’ve made 95% of my money, were ones hitting new highs from very solid bases.”

A stock can be at an all-time high and still be near the beginning of a fresh advance. It may have spent months consolidating before finally breaking through resistance.

Yet traders see the new high and immediately think, “I missed it.”

Then they search for something that “hasn’t moved yet,” assuming a lower price means more opportunity.

If your first reaction to every new high is “too late,” you may be dismissing the exact opportunities that produced most of Zanger’s money.

View on Substack ↗

The 604% Fund That Taught William O’Neil to Buy High

One of William O’Neil’s biggest breakthroughs came from studying someone else’s trades.

O’Neil describes researching three leading mutual funds in January 1960. The Dreyfus Fund stood out because its gains were twice those of many competitors. He wanted to understand exactly what Jack Dreyfus was doing.

So he ordered the fund’s quarterly reports and prospectuses from 1957 through 1959, calculated the average prices paid for new holdings, and marked those purchases on stock charts.

After examining more than 100 purchases, O’Neil discovered:

“every stock had been bought at the highest price it had sold for in the past year.”

Those stocks had formed recognizable chart patterns before breaking into new highs. That combination helped shape O’Neil’s early buying rules.

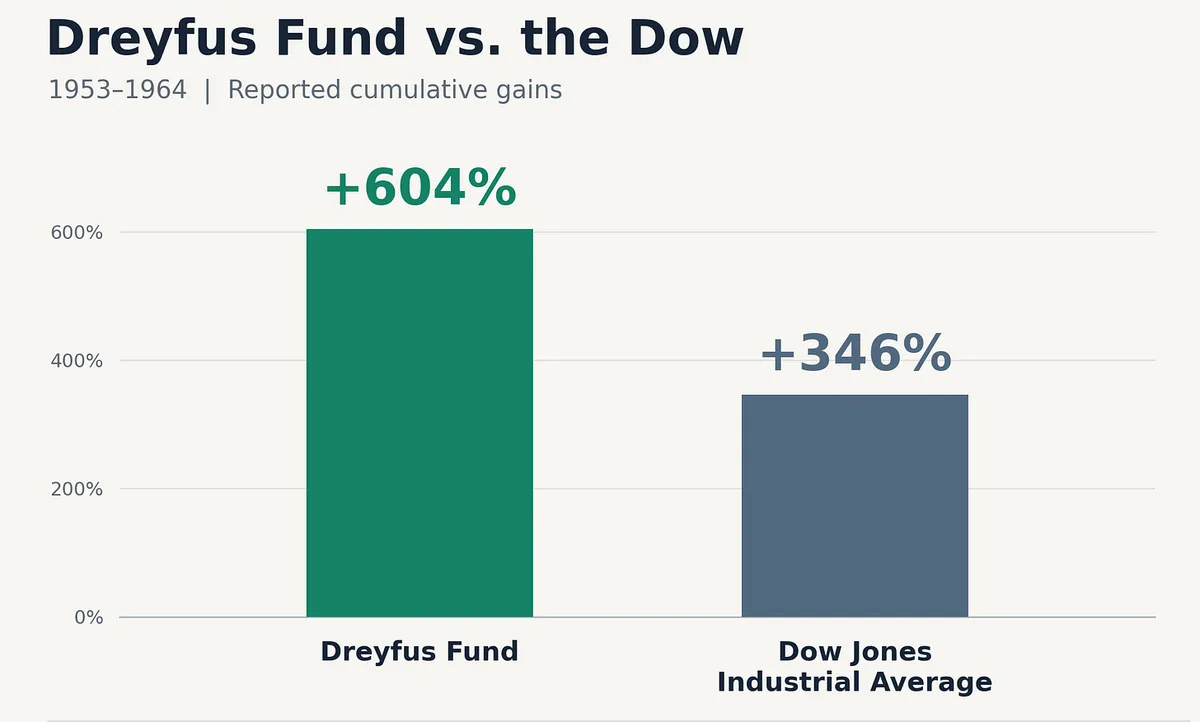
The results explain why he paid attention. From 1953 to 1964, the Dreyfus Fund reportedly returned 604%, compared with 346% for the Dow Jones Industrial Average. Historical reporting also puts its lead over the second-best fund at 102 percentage points.

And the research operation was remarkably simple. O’Neil describes three people recording daily price and volume for hundreds of stocks on oversized charts. He saw those charts himself when he visited Dreyfus’s New York headquarters. Strong quarterly earnings were another common feature of the stocks the fund bought.

Dreyfus also knew when to reduce exposure. He cut the fund’s stock holdings to less than half its assets in early 1957, ahead of the Dow’s roughly 20% decline from July to October. Buying strength went hand in hand with protecting capital.

This is one reason I keep encouraging traders to study the greats. O’Neil examined actual purchases, identified repeatable characteristics, and used that evidence to build his own rules.

Before you dismiss a stock as “too high,” remember what O’Neil found when he studied a fund that was beating the competition.

View on Substack ↗

“Too High to Buy” Is How You Miss the Biggest Winners

A stock falls 60%, and suddenly it looks like an opportunity. Another stock reaches a new high, and you think you missed it. That bargain-hunting instinct can become an expensive habit.

William O’Neil explained it in How to Make Money in Stocks:

“You buy stocks when they’re nearer to their highs for the year, not when they’ve sunk so low that they look cheap.”

A stock’s old price can anchor your expectations. You see $100 become $40 and imagine the money you’ll make when it “gets back.” But the market owes you absolutely nothing, including a return to that old high.

Meanwhile, a stock making new highs may be experiencing strong earnings + sales growth and institutional buying. The higher price can reflect a business getting stronger. Dismissing it because it has already gone up can mean overlooking exactly the strength O’Neil taught investors to study.

The entry still matters. His approach paired strong fundamentals with a breakout from a sound base, buying close to the proper buy point and cutting losses quickly when wrong.

How many big winners have you watched keep climbing while waiting for them to get “cheap”?