Momentum Trading Strategy

Notes

Finding Leading Stocks

What to buy: how to find, screen and rank the strongest stocks and industry groups.

Showing 41–60 of 299 notes

View on Substack ↗

Stocks Like SNDK Are Nothing New

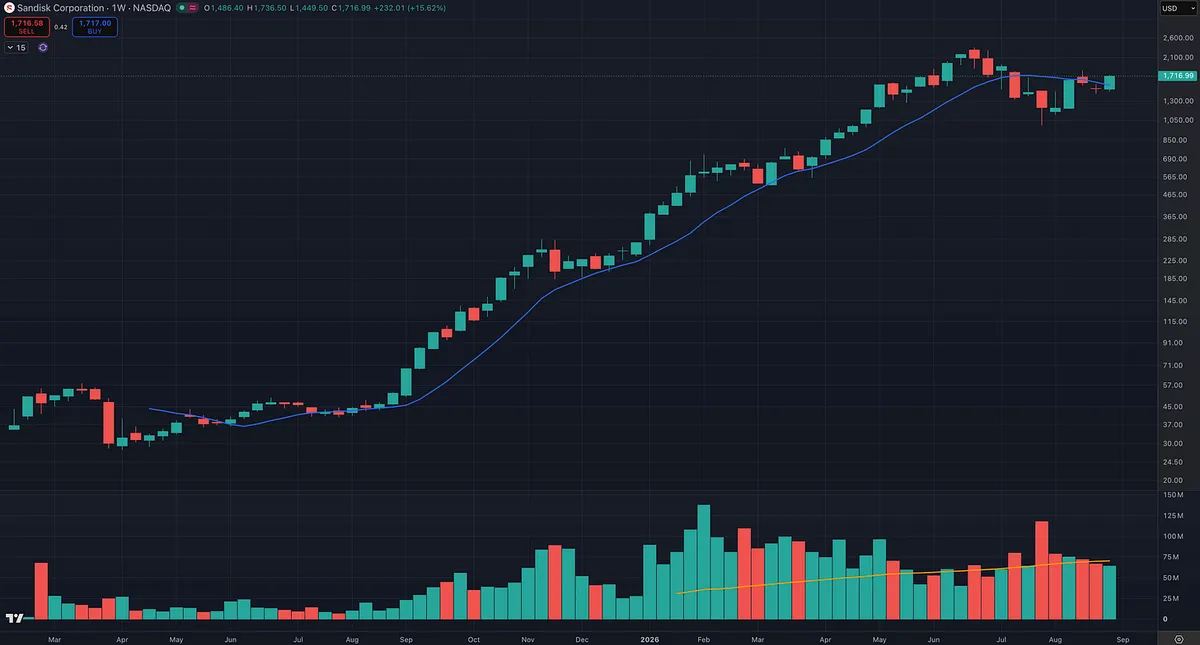
Over the last year, I’ve heard people talk about massive winners like SNDK as though these moves are something unique to modern markets. Open William O’Neil’s How to Make Money in Stocks and study the historical charts. You’ll find stock after stock, across more than a century, that looks remarkably similar to the leaders we see today.

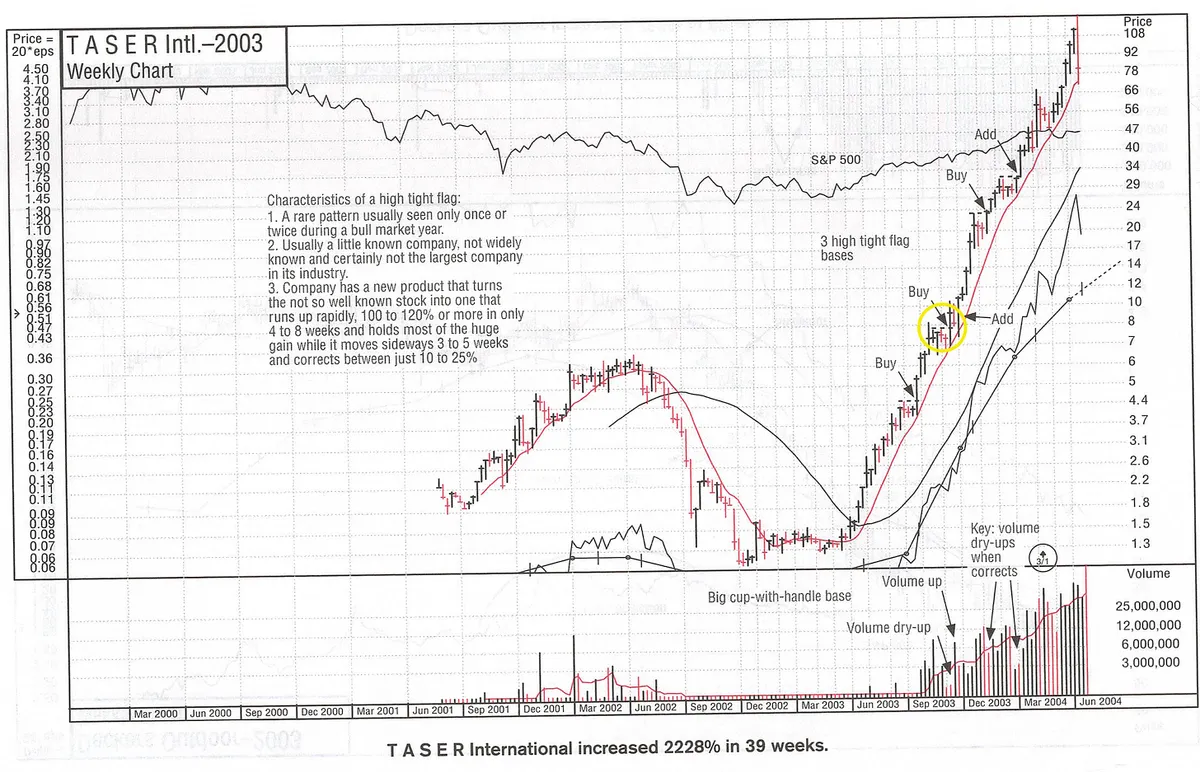
Look at TASER in 2003. O’Neil’s chart identifies three high tight flag bases during an advance that ultimately produced a 2,228% gain in 39 weeks. Notice the buy and add points as the stock keeps moving into new highs.

I’ve shared and discussed many stocks with similar patterns over the last couple of years, and the response is often the same: “It looks too extended.” But a stock having already made a huge move doesn’t automatically mean its next setup is unbuyable. I think some traders are missing what bull flags and pennants actually look like, and how tight consolidations or pullbacks can provide opportunities to enter and manage risk. They let fear or memories of past failed trades keep them from taking the next valid setup, potentially missing a huge opportunity.

If you call yourself a growth stock investor or momentum trader, study the biggest winning stocks in history. Buying strength and new highs is central to this discipline. We look for powerful stocks forming valid setups, and we use sell rules to cut losses when we’re wrong and protect gains as trends break down.

History gives us the confidence to buy strength. Discipline helps us manage the risk.
View on Substack ↗

The Market Has Been Going Up, but Look Who’s Leading.

One thing I’m watching closely right now is the quality of the leadership.

Look at the groups that keep showing up across our rankings and screens:

Healthcare: Biotechnology, Pharmaceuticals, Medical Diagnostics & Research, Medical Distribution, Medical Devices, Genomics, and other medical groups.

Energy: Oil & Gas Refining & Marketing, Drilling, Exploration & Production, Oil Services, and Midstream.

Metals & Mining: Silver, Gold, Copper, Coal, Steel, Uranium, and other precious metals.

Financials & Insurance: Banks, Capital Markets, Investment Banking, Financial Data & Exchanges, Asset Management, Insurance Brokers, and other insurance groups.

We are also still seeing strength in Software, Cybersecurity, and select AI-related names, along with individual opportunities in areas like marine shipping.

These are legitimate leaders right now, and I will absolutely trade them when the individual stocks meet my criteria. Some represent genuine growth leadership, while others are more cyclical, defensive, or secondary areas.

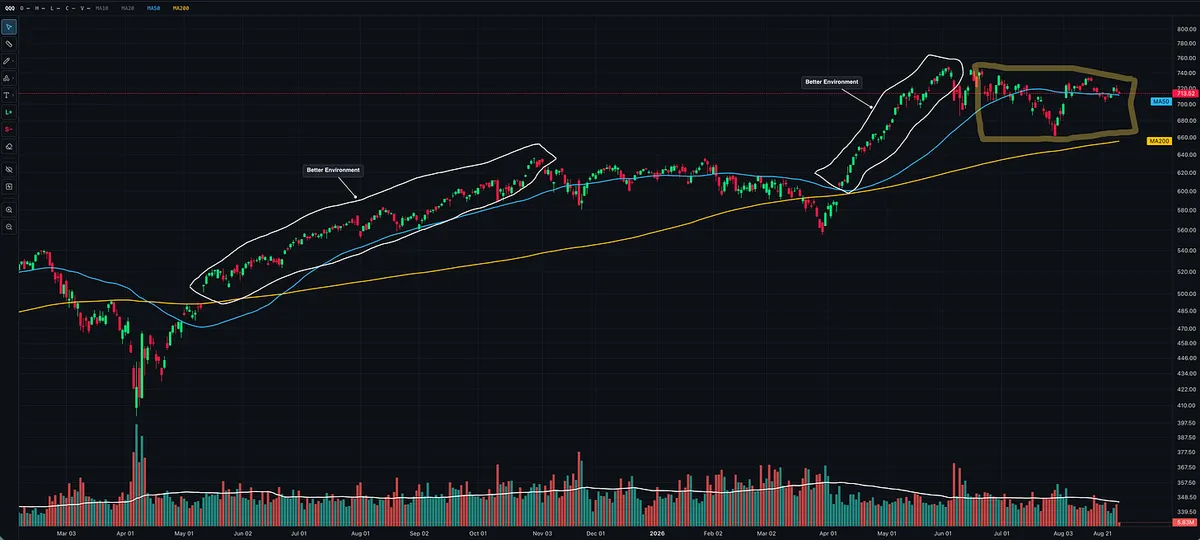
BUT throughout this bull market, many of those non-growth areas have tended to become more prominent when the dominant growth and technology leaders, which have been closely aligned with the AI-driven theme of this bull market, were cooling off, correcting, or moving sideways. During those periods, I generally would have been better served by reducing trade size, frequency, and overall exposure until the stronger growth leadership returned.

That’s the part I’m watching closely.

The market still looks healthy enough to trade, but this is not an easy-money environment.

When a bull market is firing on all cylinders, the strongest growth stocks are breaking out, RS is expanding, and the best setups tend to follow through quickly.

Right now, we are seeing more rotation, more cyclical and defensive leadership, and more laggards beginning to participate, and more failed breakouts. Many of these are the same areas that were overshadowed during the strongest periods of growth and technology leadership in this bull market.

So I would not call this a red-light environment, but I also would not call it a full green-light, easy-money market.

We’re also heading into a seasonally more difficult period for the market, which is another reason to stay alert. Seasonality alone will never determine my positioning. I’ll always let price action, leadership, and my individual trades tell me what to do. But combined with the rotation and changing quality of leadership we’re seeing, it’s something worth keeping in the back of our minds.

It feels more amber right now. Tradable, but cautionary.

View on Substack ↗

Sometimes the Stocks Tell You Before the Indexes Do

In my last note, I talked about why understanding the general market, sectors, and industry groups matters.

But that is only half of my process.

I also agree with Minervini that sometimes the best way to understand the health of the market is to look directly at the individual stocks.

He wrote that constantly updating your list of leading stocks can:

“sharpen your feel for the overall health and quality of the market.”

That is exactly what this short video shows.

When you have the right stock screens, you can often see leadership, rotation, and deterioration developing from the bottom up before it becomes obvious in the indexes or sector charts.

Minervini also points out that many of the best leaders can bottom and begin moving before their sectors, and by the time everyone realizes a group is hot, the strongest stocks may have already made significant moves.

That is why I don’t choose between top-down or bottom-up analysis.

I do both.

Market → Sectors → Industry Groups → Stocks

And then:

Stocks → Industry Groups → Sectors → Market

Sometimes the first clue that the market is changing is simply what starts showing up on your stock screens.

Click to watch the full video:

ArticleHow to Spot the Market’s Next Leading Industry Groups Before the Crowd
View on Substack ↗

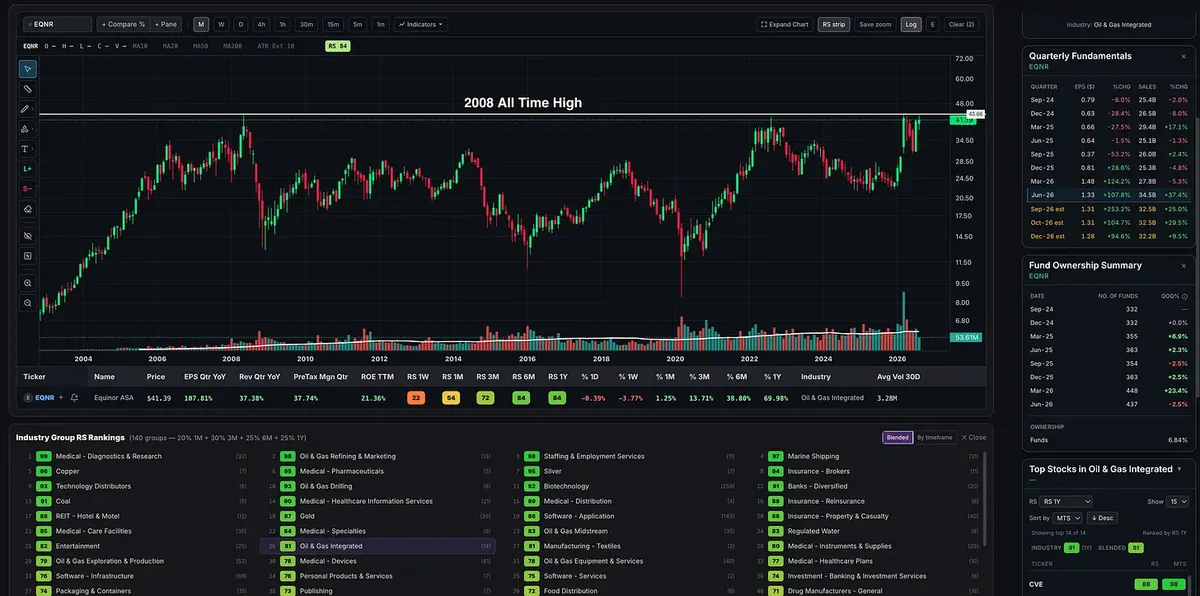
EQNR | Equinor

The chartist in me can’t help but notice EQNR here.

On the monthly chart, EQNR is approaching the major $42–$44 resistance zone that dates back to its 2008 all-time high. It challenged roughly the same area again in 2022 and is now back near it once more.

What makes this attempt interesting is the structure underneath it. Price is tightening while forming higher lows, and the weekly and daily charts show the same character.

Could it reject again? Absolutely.

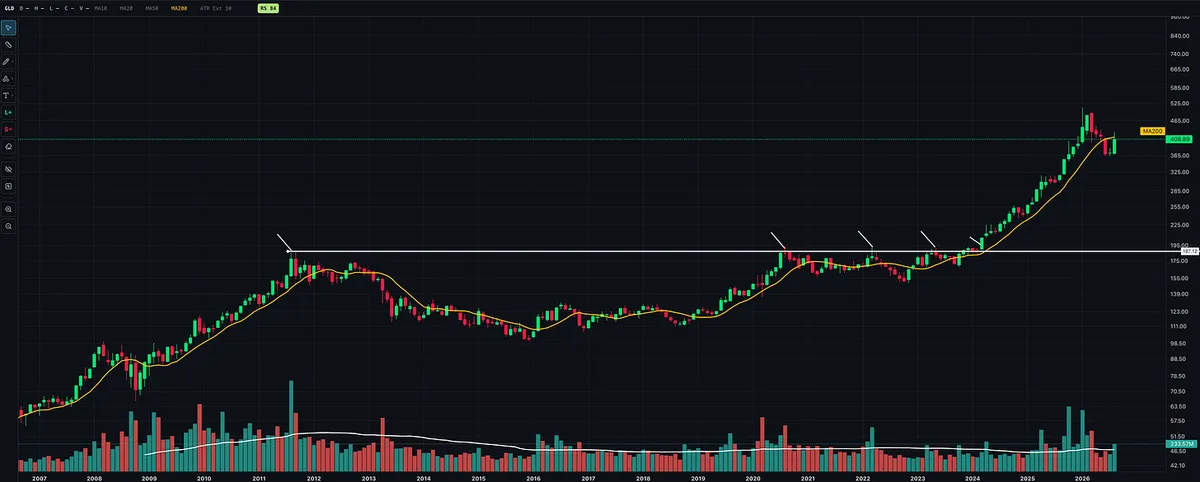
But some of the biggest technical moves begin when price finally breaks free from a massive multi-year base. Gold is a great example. It repeatedly challenged its old highs after the 2011 peak before finally breaking decisively into new-high territory in 2024.

The fundamentals also give us a reason to pay attention:

  • EPS growth: +108%

  • Sales growth: +37%

  • Pre-tax margins: 37.7%

  • ROE: 21.4%

  • 1-year RS: 84

  • Industry RS: 91

One energy name I’m keeping very close on the watchlist.

View on Substack ↗

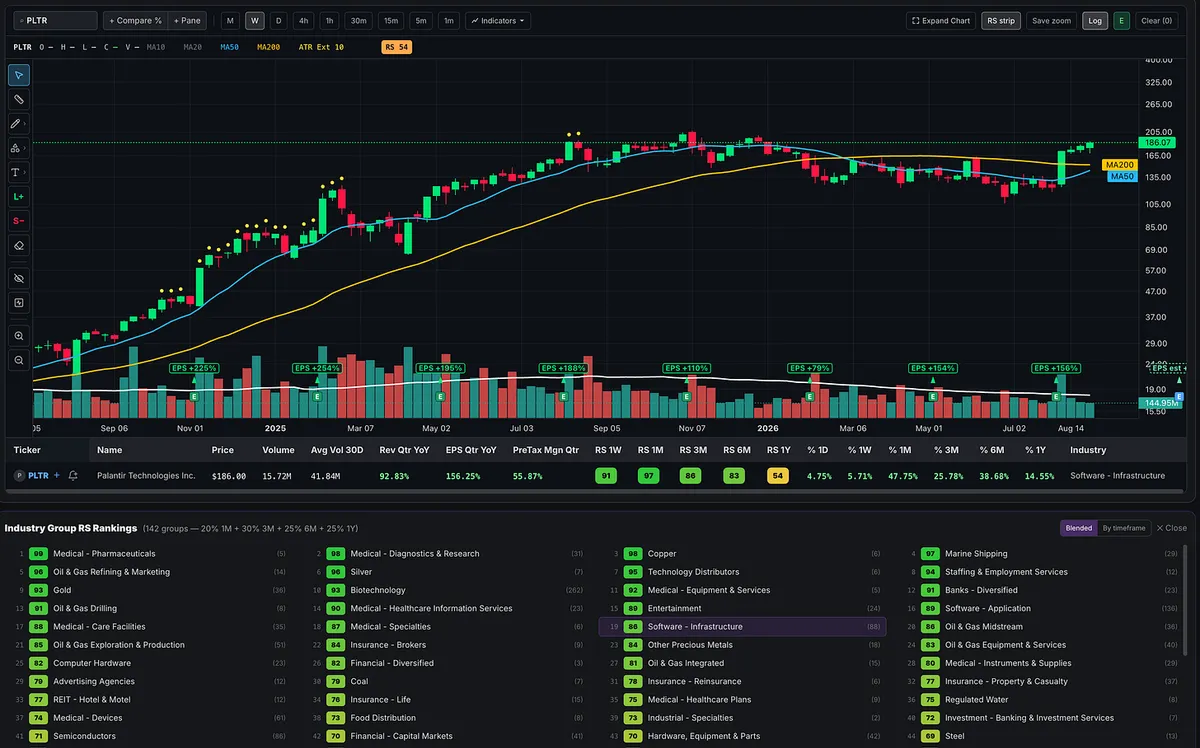
Remember When AI Was Supposed to Kill Software?

Just a few months ago, everyone was convinced that AI was going to destroy the software industry.

Now software stocks are delivering some of the market’s strongest moves and breaking out again.

Markets change quickly. Price tells the truth.

Looks like software is back.

View on Substack ↗

Great Fundamentals Can Still Be a Horrible Buy

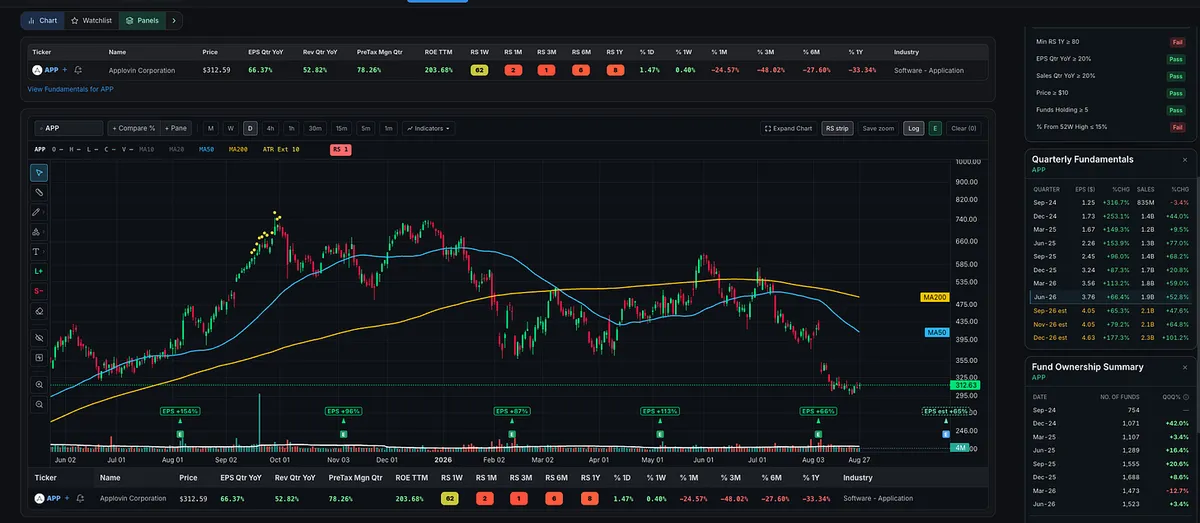
APP is a perfect example of why growth-stock investors need both fundamentals and price action.

The company’s numbers look exceptional:

  • Quarterly EPS growth: +66%

  • Quarterly sales growth: +53%

  • Pretax margin: 78%

  • ROE: 204%

These are exactly the types of fundamentals I look for.

But great fundamentals alone do not make a stock a great buy.

APP currently has a declining 50-day and 200-day moving average, an RS Rating of 8, and a price chart characterized by lower highs and lower lows. That is the complete opposite of the price action growth-stock and momentum traders should be looking for.

APP had several great tradable runs throughout 2023, 2024, and 2025. During those advances, price was above the 50-day and 200-day moving averages, with both moving averages trending higher.

The fundamentals were being confirmed by the price action.

That confirmation does not exist today.

I’m not saying APP cannot eventually have another strong run. But in its current technical condition, it is not a stock I would want to own. The last time its chart looked this weak was in 2022.

This is why I require both:

Strong fundamentals identify the companies with potential.

Strong price action confirms when the market agrees.

A great company can still be a horrible stock to buy at the wrong time.

View on Substack ↗

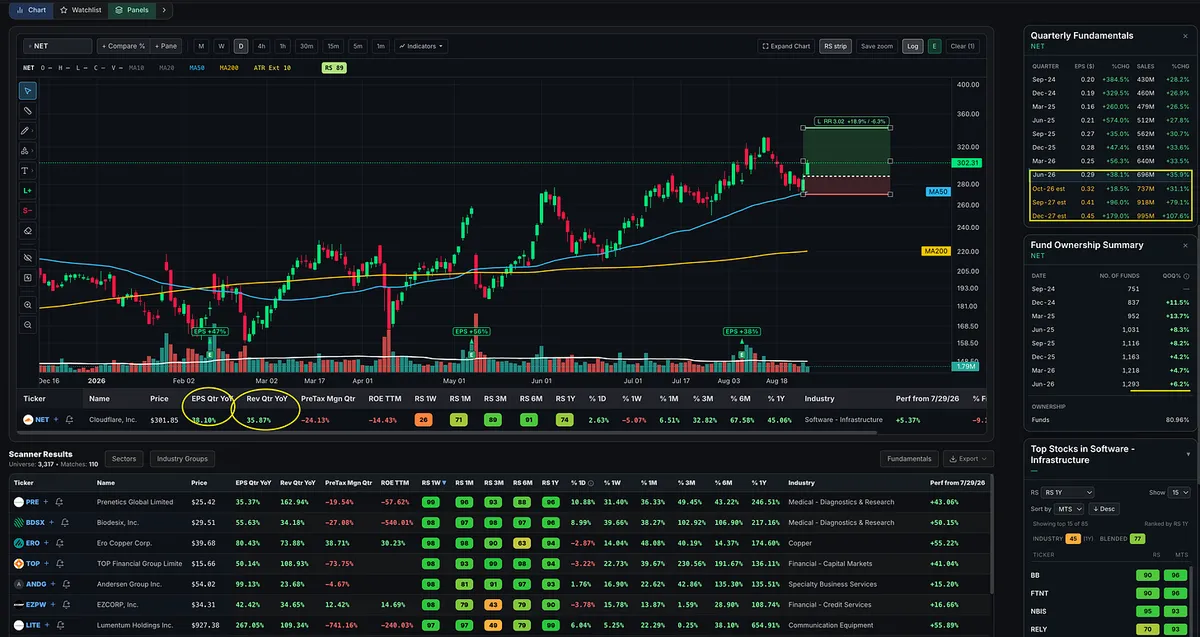
Anyone buy NET?

I like the earnings and sales growth on $NET.

  • EPS +38%.

  • Sales +35%.

  • Estimates look like they're accelerating on the sales side too.

  • Fund ownership is rising quarter after quarter.

  • Strong RS

I would like to see ROE or pretax margins strong, the way O'Neil talks about in his book. These aren't.

The other positives plus a low-risk, high-reward pullback off the 50-day still make this a great trade.

View on Substack ↗

Every Market Cycle Has a “Big Stock.” But the Real Clue Is Usually the Industry Group Behind It.

The market’s biggest winners rarely emerge alone. They are usually part of an industry group benefiting from a powerful new fundamental trend.

2023: AI Compute and Semiconductors

This marked the beginning of a new bull market and the emergence of the generative AI theme.

Big leaders:

  • $NVDA | Nvidia

  • $SMCI | Super Micro Computer

NVDA became the face of the cycle, but the leadership was much broader. Chips, servers, networking equipment, and the entire data-center buildout were beginning to move.

2024: AI Software, Data Platforms, and Power

Leadership expanded from companies building the AI infrastructure to those finding ways to monetize and support it.

Big leaders:

  • $PLTR | Palantir

  • $APP | AppLovin

AI adoption spread into software, data platforms, advertising optimization, networking, and power generation. The theme was evolving, but the underlying driver remained the same.

2025: Memory, Storage, and the AI Data Stack

The market’s attention shifted toward the next major bottleneck. AI systems required enormous amounts of high-performance memory, flash storage, and data-center capacity.

Big leaders:

  • $SNDK | SanDisk

  • $WDC | Western Digital

  • $STX | Seagate Technology

  • $MU | Micron Technology

These became some of the market’s biggest winners as demand for AI memory and storage accelerated.

2026: The Memory Supercycle Continues

Leadership continued into 2026 and semiconductors remerged as a leading group rather than transitioning into an entirely new theme.

Leaders:

  • $SNDK | SanDisk

  • $MU | Micron Technology

  • $STX | Seagate Technology

  • $WDC | Western Digital

But don’t overlook what happened outside the dominant AI theme.

Metals and mining also developed into a major winning group during this bull market period 2024-2026. The market can have one dominant secular story while still producing powerful leadership in completely different areas.

The next monster winner probably won’t be random.

It will likely emerge from a strengthening industry group with accelerating earnings and sales, increasing institutional sponsorship, elite Relative Strength, and a chart that refuses to break.

2023: AI compute and semiconductors

2024: AI software, data platforms, and power

2025–2026: AI memory, storage, semis

Meanwhile, metals and mining proved that major leadership can still emerge outside the market’s primary theme.

What industry group do you think becomes the next true market leader for 2026–2027?

View on Substack ↗

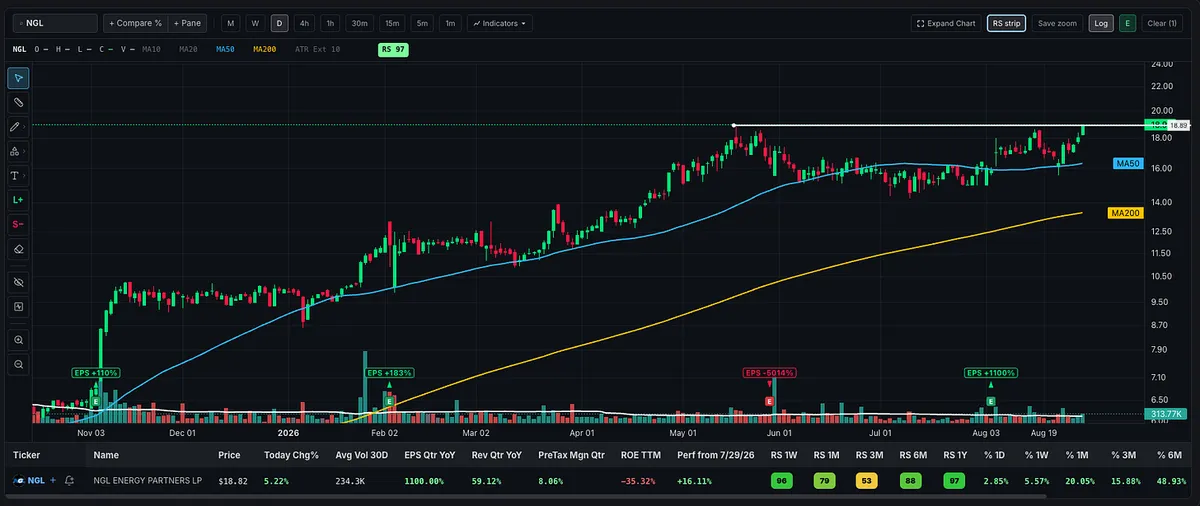
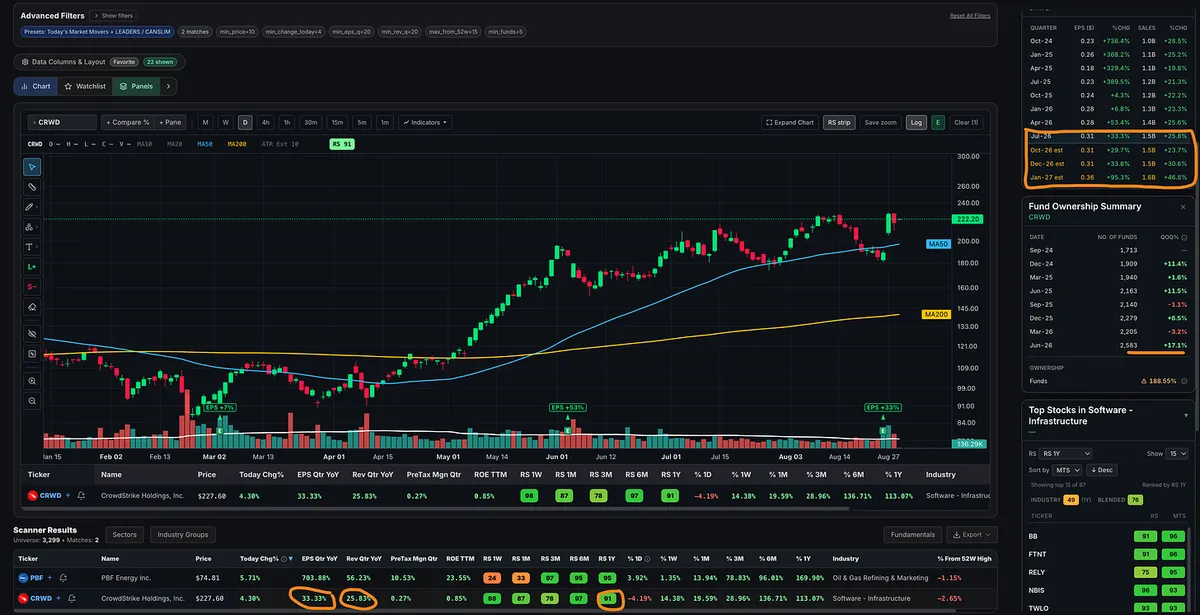
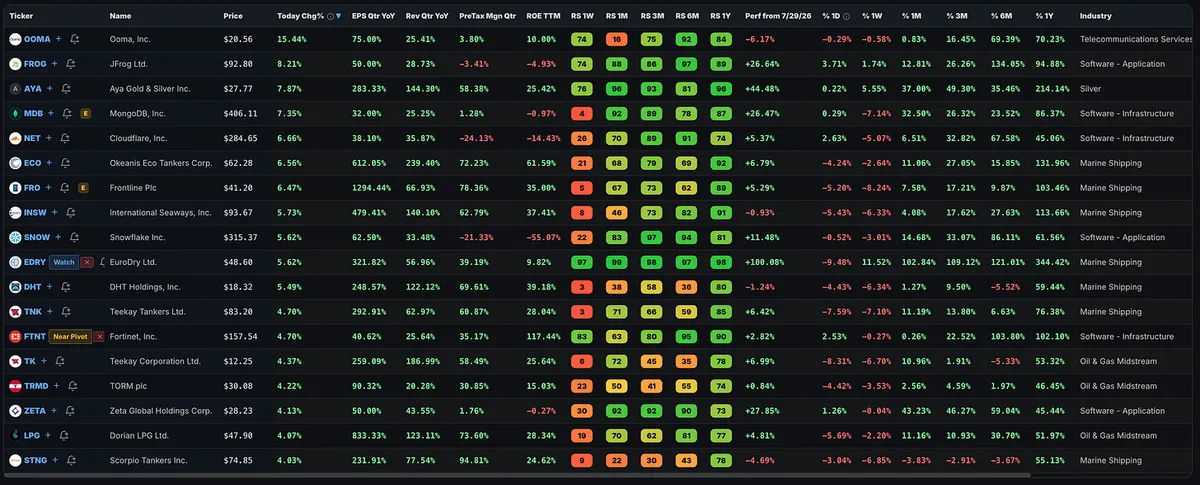
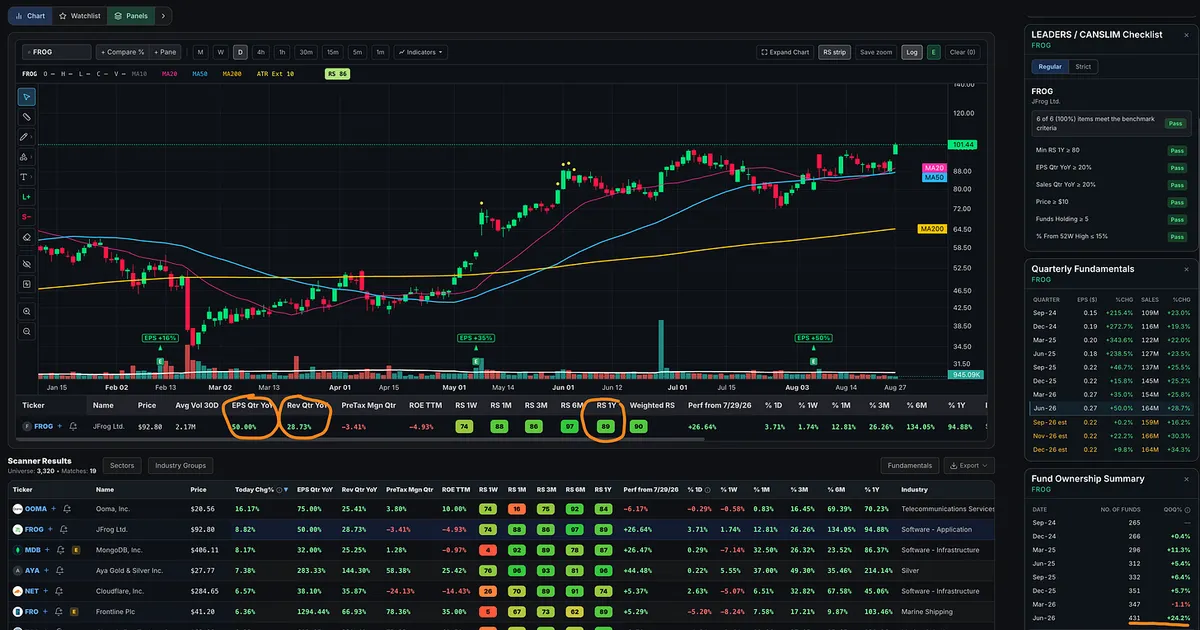
Today’s Biggest Stock Movers 👀

I screened for stocks that are:

  • Up at least 4% today

  • Priced at $10 or higher

  • Growing quarterly EPS by at least 20%

  • Growing quarterly sales by at least 20%

  • Within 15% of their 52-week highs

  • Listed on the Nasdaq or NYSE

Looking through the results, two groups are dominating the list:

🚢 Marine shipping

💻 Software

View on Substack ↗

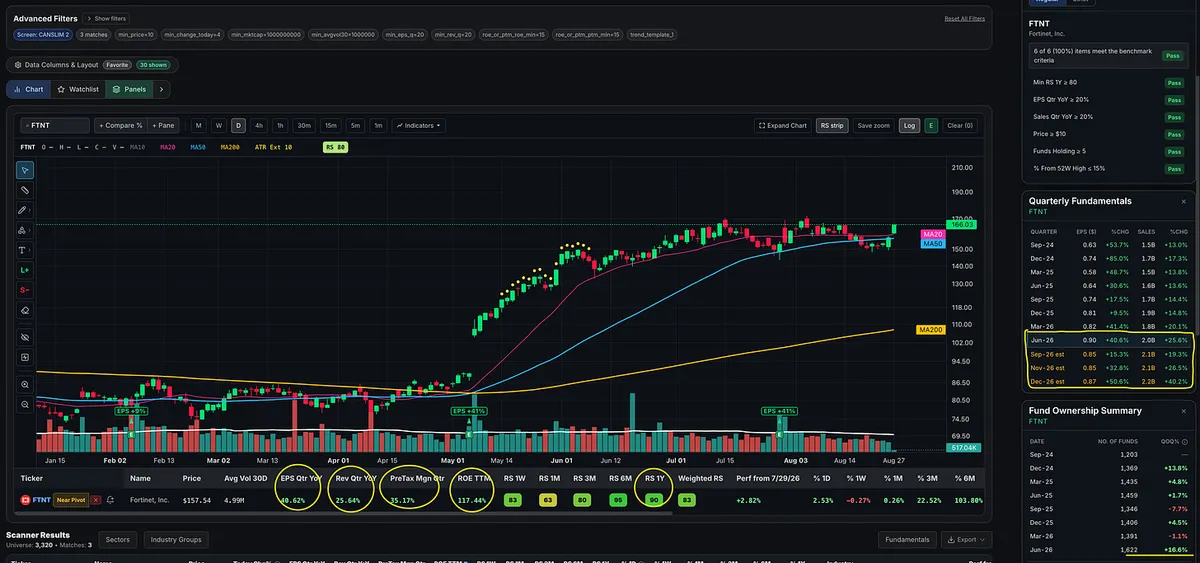
Hello, FTNT 👀

A lot of software stocks are moving today, and Fortinet is one of the names standing out.

  • Up nearly 5% today

  • 40% quarterly EPS growth

  • 25% quarterly sales growth

  • 35% pretax margins

  • 117% ROE

  • 90+ one-year Relative Strength

  • Fund ownership increased 16.6% last quarter

Big earnings. Big sales. Strong margins. Increasing institutional sponsorship.

Now FTNT is pushing back toward its recent highs.

View on Substack ↗

Hey MTS Velocity, Find Me a Fundamentally Strong Stock Moving Pre-Market 👀

Show me stocks with:

  • A minimum price of $10

  • A minimum market cap of $1 billion

  • A minimum 30-day average volume of 1 million shares

  • Quarterly EPS growth of at least 20% year over year

  • Quarterly sales growth of at least 20% year over year

  • ROE and/or pretax margins of at least 15%

  • Price above the 50-day and 200-day moving averages

  • The 50-day moving average above the 200-day

  • 1yr RS 80+

  • Up 4%+ pre-market

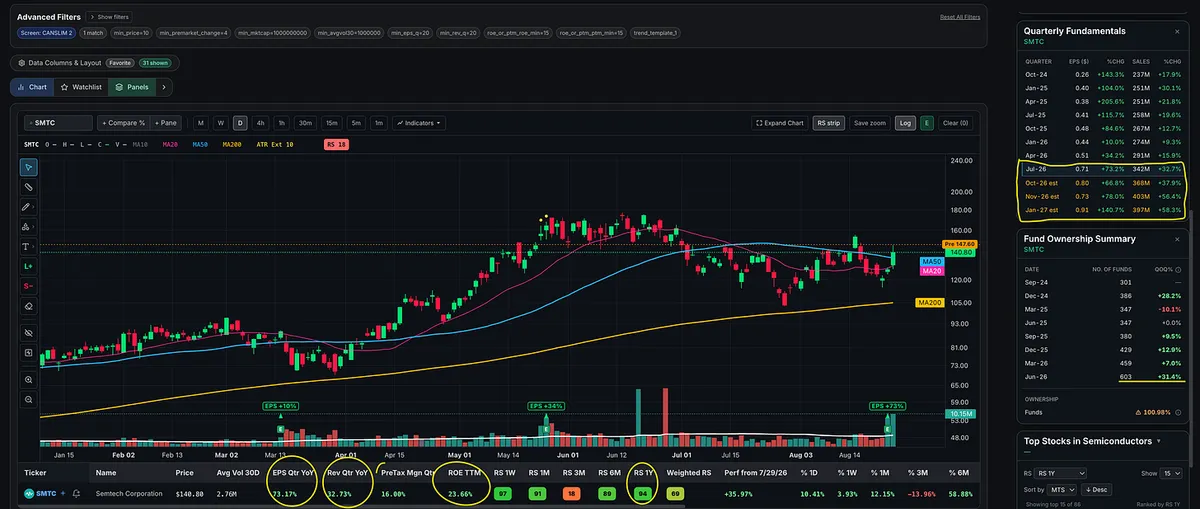
Here’s what came back: SMTC

EPS growth: +73%

Sales growth: +32%

ROE: 23%

One-year Relative Strength: 94

Fund ownership growth last quarter: +31%

Forward estimates point to continued acceleration in both earnings and sales, and the latest earnings report is now out of the way.

View on Substack ↗

Missed CGAU’s First 65% Move? You Still Had Another Chance.

One of the biggest mistakes traders make is abandoning a winning stock simply because they missed its first breakout.

CGAU is a perfect example.

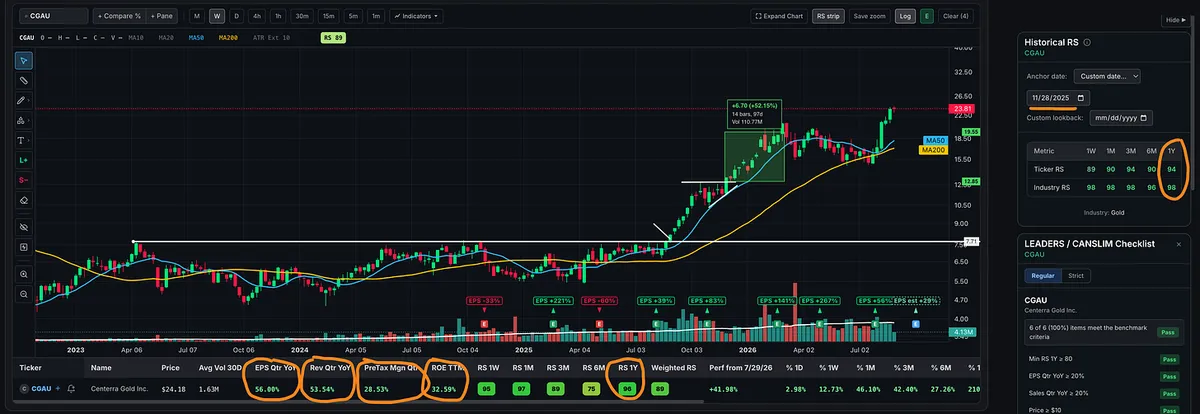
The stock spent years building a large base. As it moved up the right side, price began tightening before finally breaking out during the week of August 29, 2025.

It then ran higher for eight consecutive weeks, gaining approximately 65%.

Missed it?

You didn’t need to chase.

CGAU then moved sideways and tightened for roughly six weeks. The lows continued rising, Relative Strength remained extremely strong, and the stock eventually broke through its prior high during the week of November 28.

That second breakout produced another gain of approximately 50%.

Sometimes the second setup can be even more attractive because the stock has already proven itself:

✅ A powerful initial move on volume

✅ Strong Relative Strength

✅ Big earnings and sales growth

✅ Expanding margins and strong ROE

✅ Increasing institutional ownership

✅ Strength across the metals and mining group

CGAU has recently been appearing on our MTS Velocity stock screens again as metals and mining continue to outperform, something we’ve also been covering in the Big Picture Market Pulse.

Big winners rarely move straight up.

They break out. They advance. They rest and tighten. Then they often offer another opportunity.

Missing the first breakout doesn’t mean you missed the entire move.

View on Substack ↗

We Didn’t Find CDNA After the Breakout. We Were Watching It Before. 👀

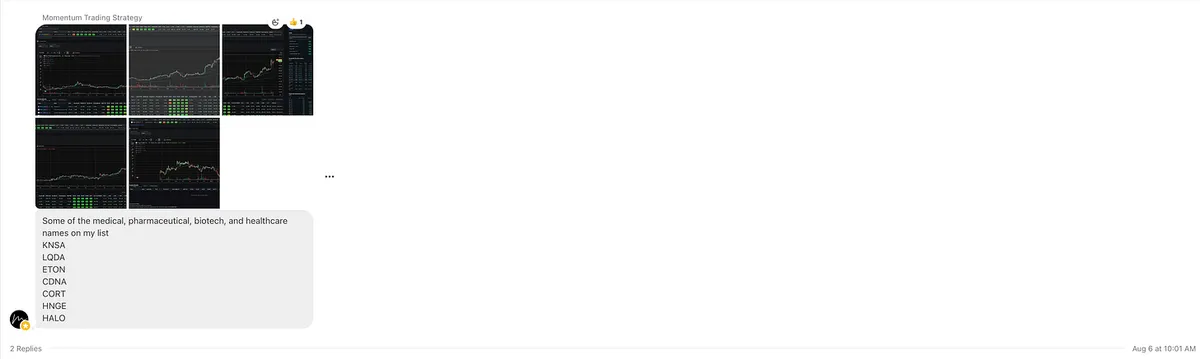
On August 6, I shared a list of medical, pharmaceutical, biotech, and healthcare stocks we were watching inside the MTS Community.

CDNA was on it.

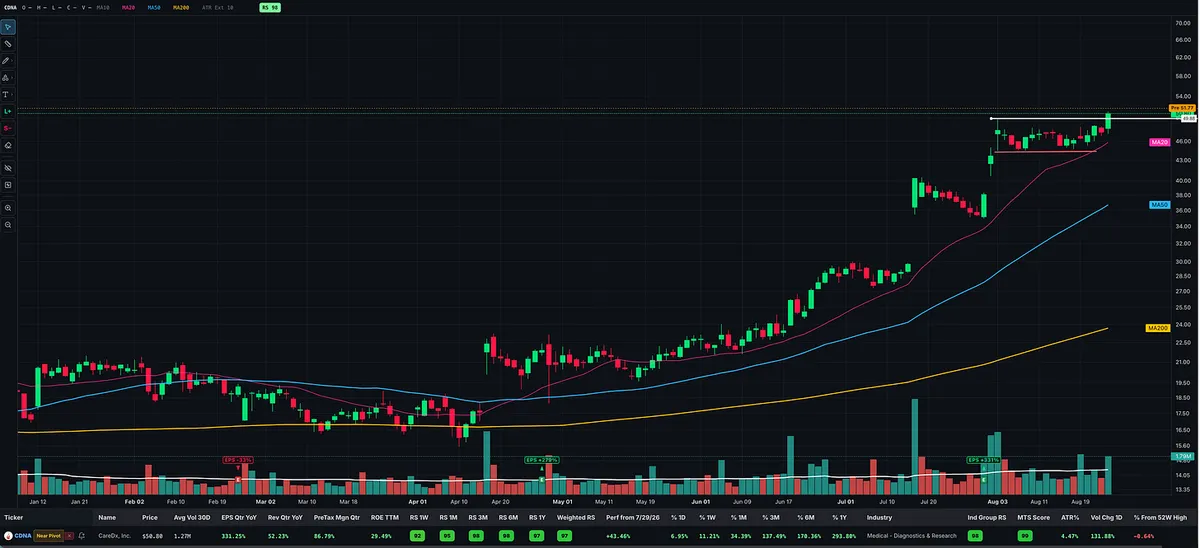
We originally spotted the stock using the MTS Velocity screener, and the numbers made it difficult to ignore:

• EPS growth: +331%

• Sales growth: +52%

• Pretax margin: 86.8%

• ROE: 29.5%

• Relative Strength: 98

• Industry Group RS: 98

After its earnings run, CDNA pulled back constructively on much lower volume.

Then volume began returning on August 19.

Yesterday, it broke out.

Now it’s continuing higher in pre-market trading. 🚀

While much of the market remained focused on the same AI stocks that had stopped leading, relative strength was pointing toward healthcare and biotech.

Most people notice a stock after the breakout candle appears.

The real work happens before it.

MTS Velocity found the stock. The MTS Trading Room tracked the setup. Price and volume confirmed the opportunity.

Screen. Study. Prepare. Then let the stock prove you right.

View on Substack ↗

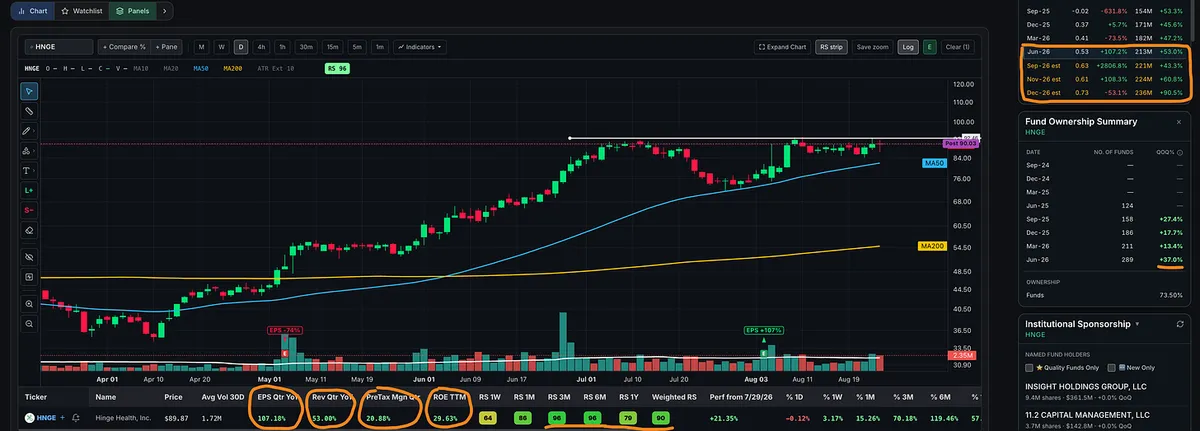
I Screened the Entire Market Using MTS Velocity. HNGE Survived. 👀

One of the stocks that made it through:

HNGE

• EPS growth: +107%

• Sales growth: +53%

• Pretax margin: 20.9%

• ROE: 29.6%

• High Relative Strength

• Funds owning shares: 124 → 289 in one year

And now the stock is tightening near its highs above rising 50-day and 200-day moving averages.

Thousands of stocks. One screen. Hello, HNGE. 👀

View on Substack ↗

The Best Swing Trades Look Like This Before They Explode

Study this chart.

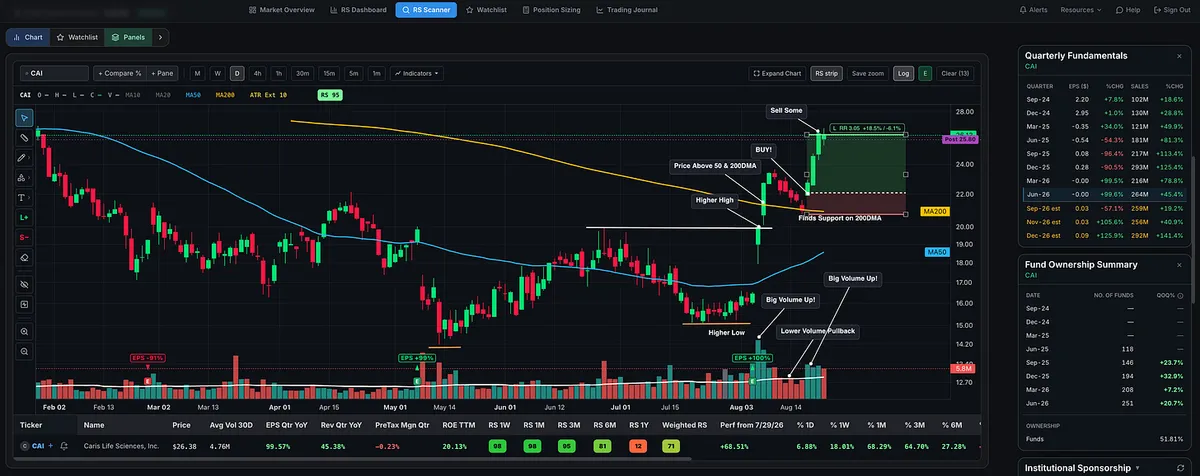
CAI is a great example of what can happen when industry strength, price action, volume, fundamentals, and risk management all align to create a low-risk, high-reward swing-trading setup.

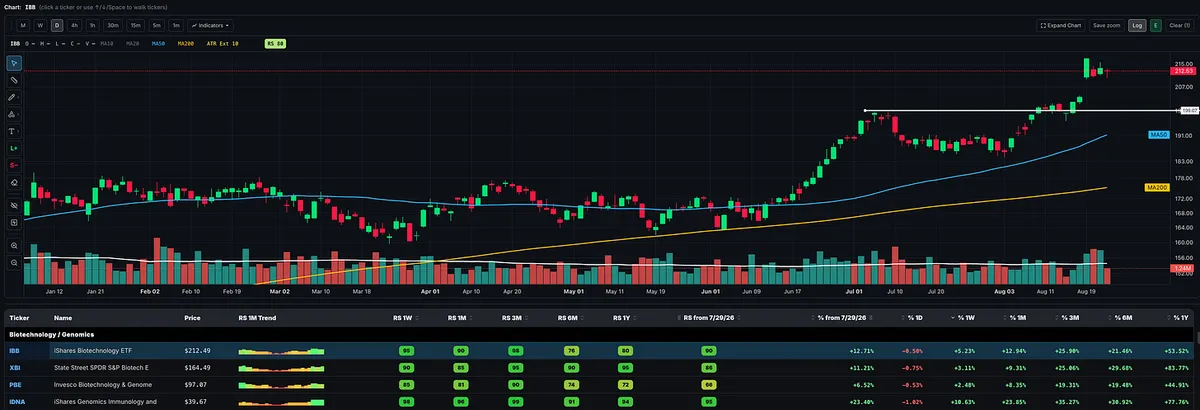
Biotech had a strong run in June. IBB then spent July building a base, formed a handle near its highs in August, and broke out to new highs.

While the industry group was confirming its strength, CAI was setting up.

  1. Character change: The stock established a higher low followed by a higher high. That higher high confirmed the higher low and signaled the character change I look for.

  2. Volume and growth fundamentals: Around earnings, volume expanded dramatically, quarterly sales grew 45%, and price moved back above both the 50-day and 200-day moving averages.

  3. Low-volume pullback: CAI pulled back on declining volume almost perfectly to the 200-day moving average and found support.

  4. Entry: The following day, it gapped higher on increasing volume, providing an entry near the open on August 19.

  5. Clearly defined risk: You could have placed a very tight stop below the low of the entry day. My preferred stop was below the higher low, the 200-day moving average, and the low of the pullback.

  6. Sell into strength: Once the stock reached a multiple of the initial risk, you could sell some into strength to help finance the trade, protect your principal, and give the remaining shares room to capture a potentially larger move.

That is what low risk really means.

It does not mean the trade cannot fail. It means you know exactly where you are wrong, while the characteristics of the setup offer significantly more potential reward than what you are risking.

Even the wider technical stop required less than 6% risk. Within only a few days, CAI had gained approximately 18%, or three times the initial risk. That created an ideal opportunity to sell some into strength while allowing the remaining position more room.

The fundamentals also supported the setup:

  • Sales growth of approximately 45%

  • ROE above 20%

  • The number of funds owning shares more than doubling over the past year

  • Improving forward estimates

  • One-month RS of 98

  • Three-month RS of 95

CAI does not fully meet my longer-term position-trading criteria, particularly because its one-year relative strength remains weak. But for a swing trade, it fits extremely well.

This is why traders like Kristjan Kullamägi focus on the market’s strongest performers over the previous one, three, or six months.

Strong industry group. Character change. Massive volume. A lower-volume pullback. Support at a key moving average. A clear entry and clearly defined risk.

Study these characteristics.