When Low Short-Term Relative Strength Is Actually Bullish (Most Traders Get This Wrong)
A lot of traders misunderstand what they’re seeing when they sort stocks by Relative Strength.
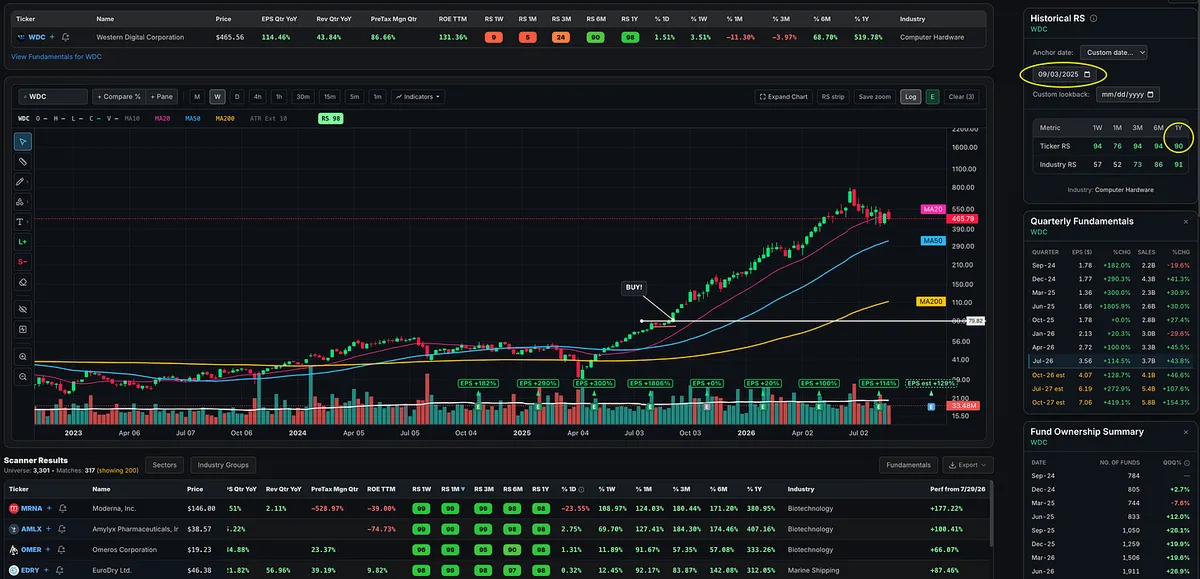
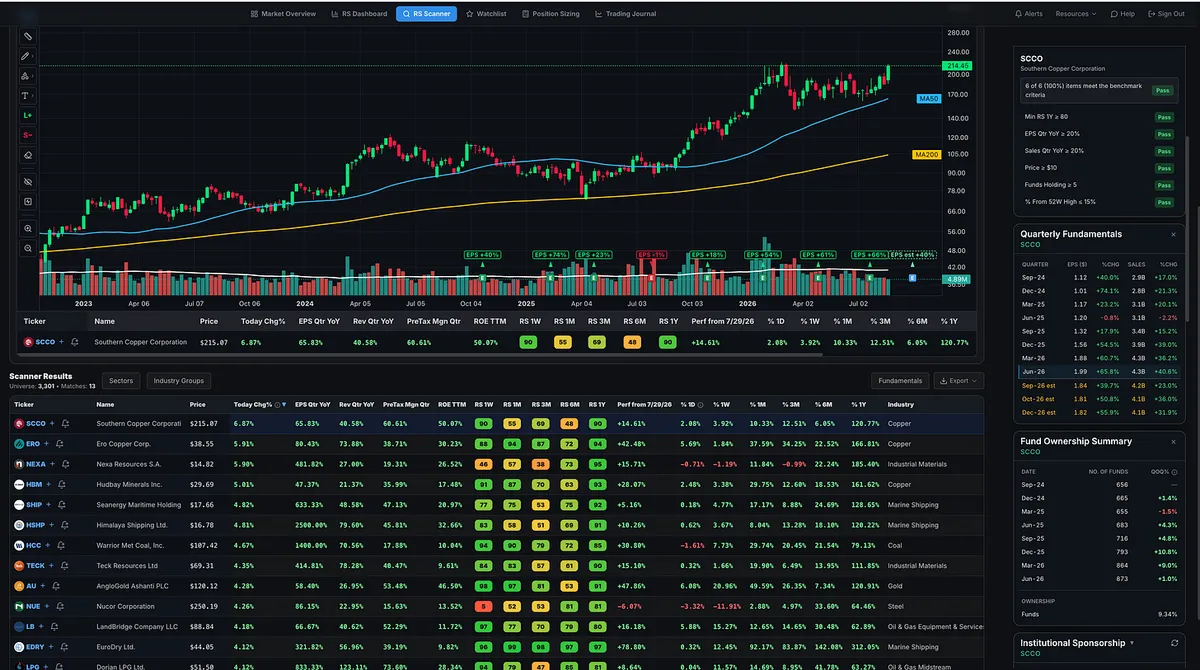
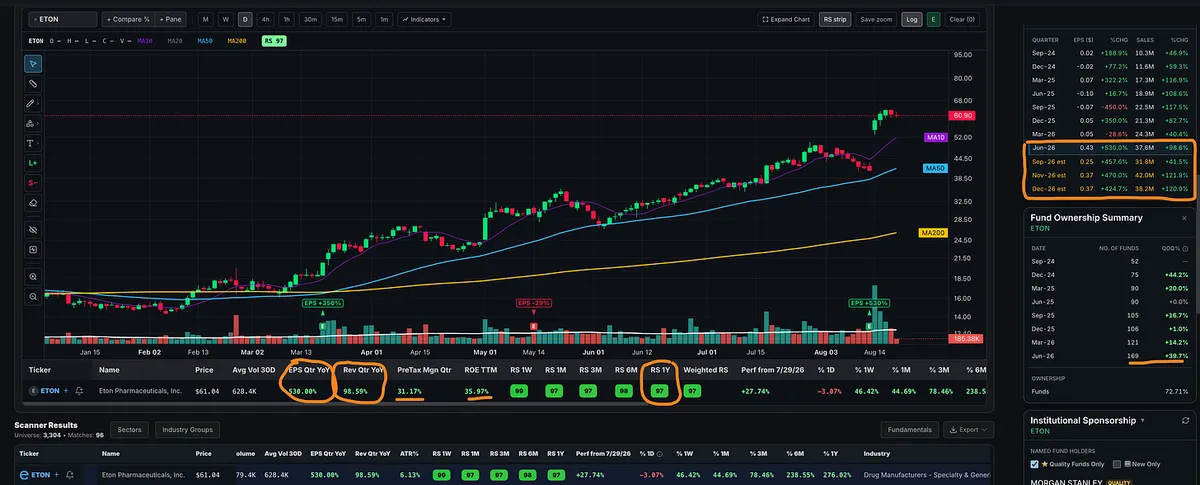
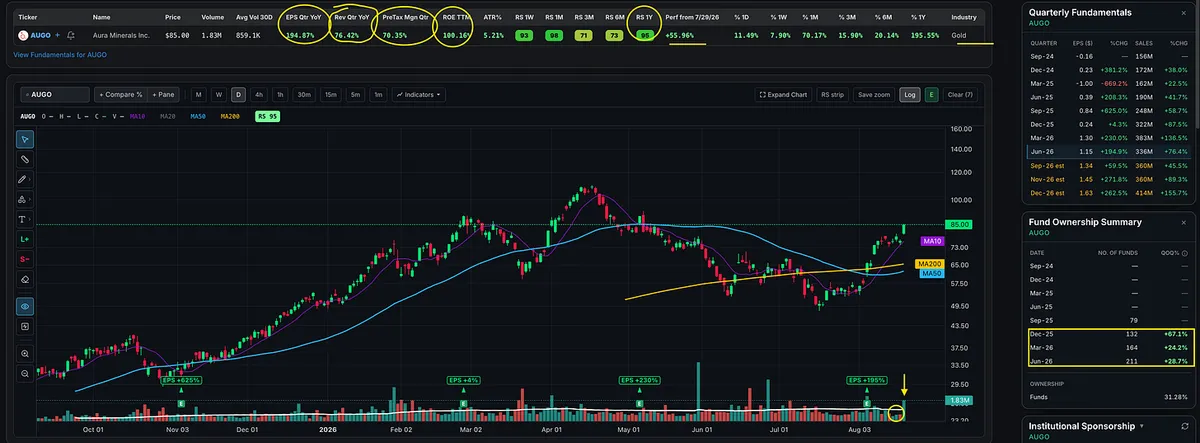
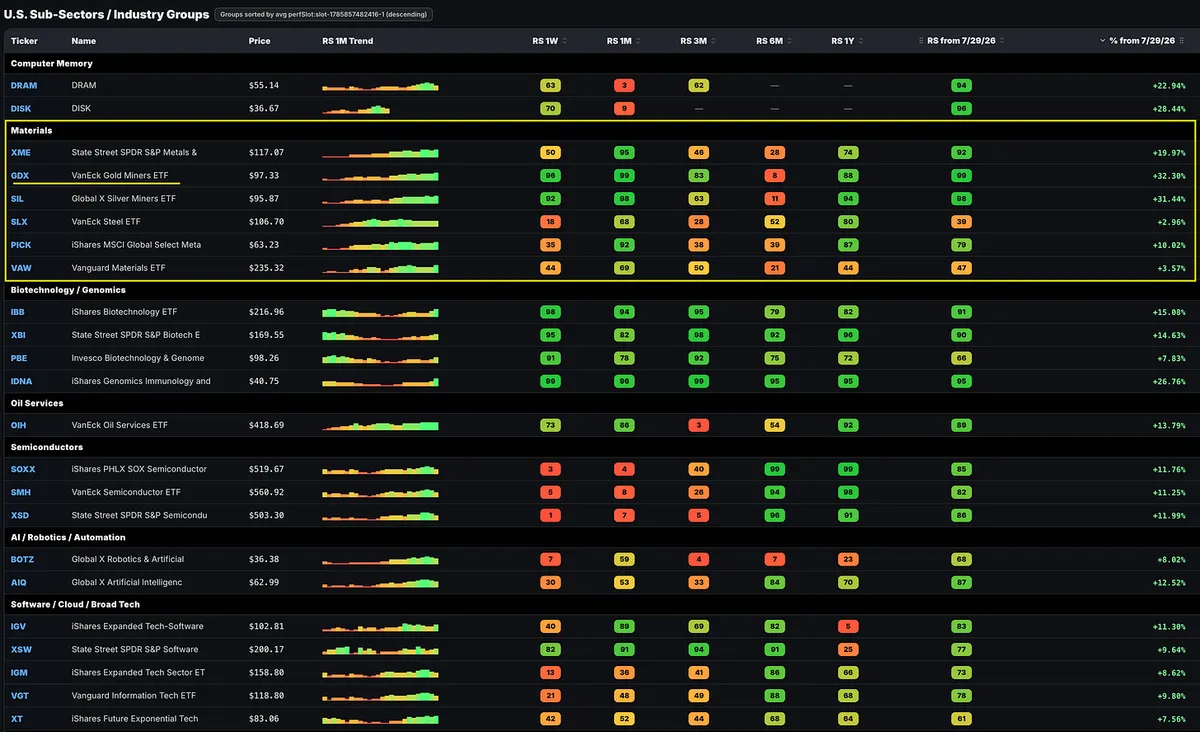
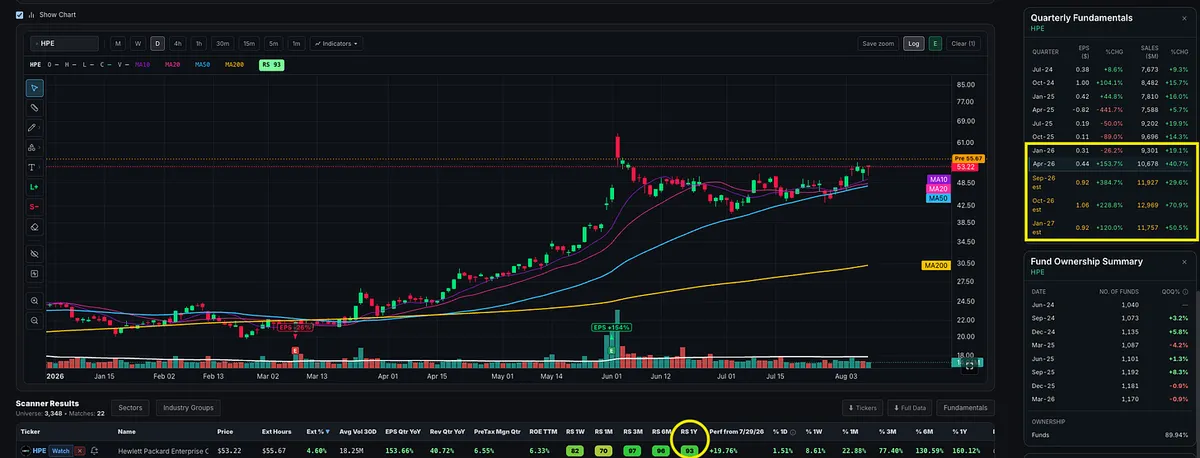
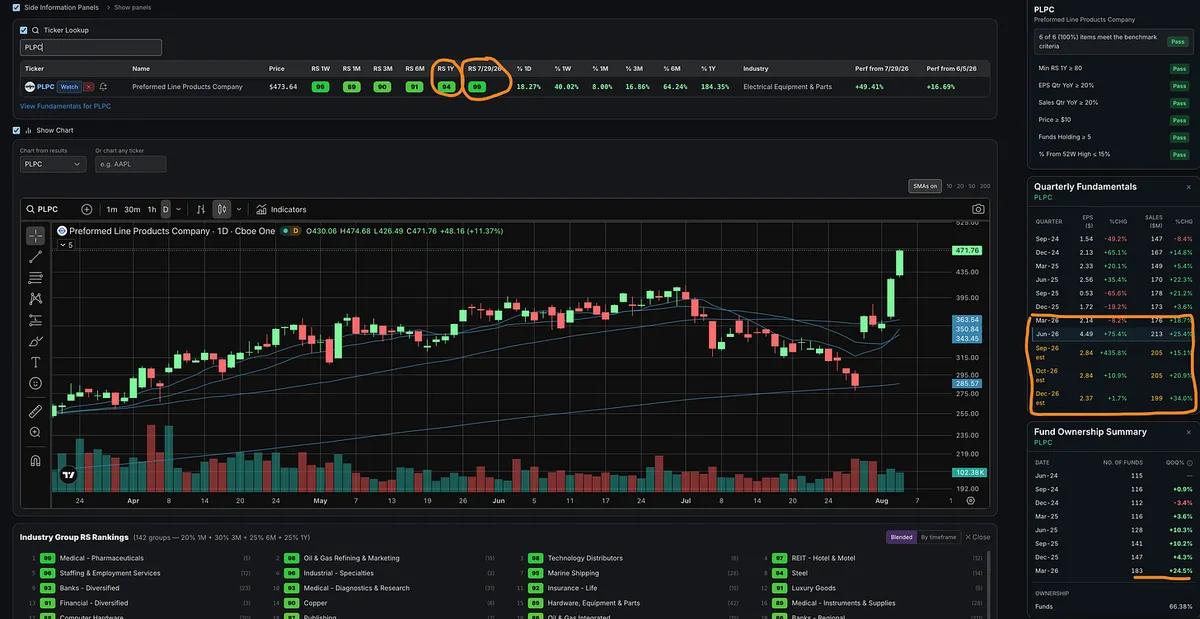
When a stock is ripping higher, you’ll usually see strong RS across nearly every timeframe: 1-year, 6-month, 3-month, 1-month, even 1-week.
But that’s also usually when everyone starts saying:
“It’s too extended.”
The more interesting opportunity can appear when a major leader finally starts to consolidate.
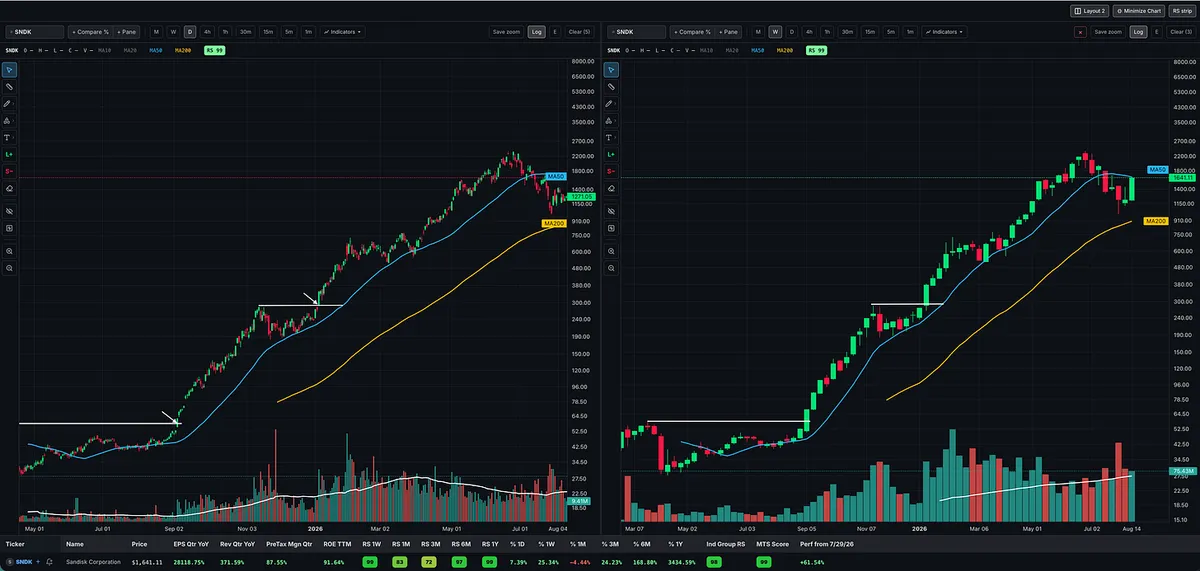
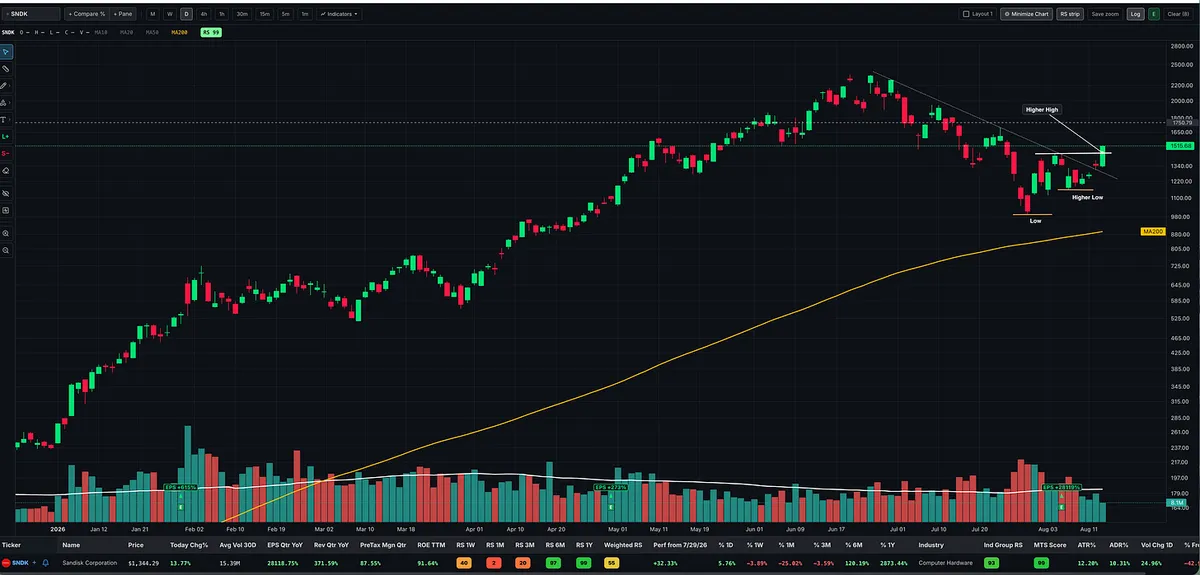
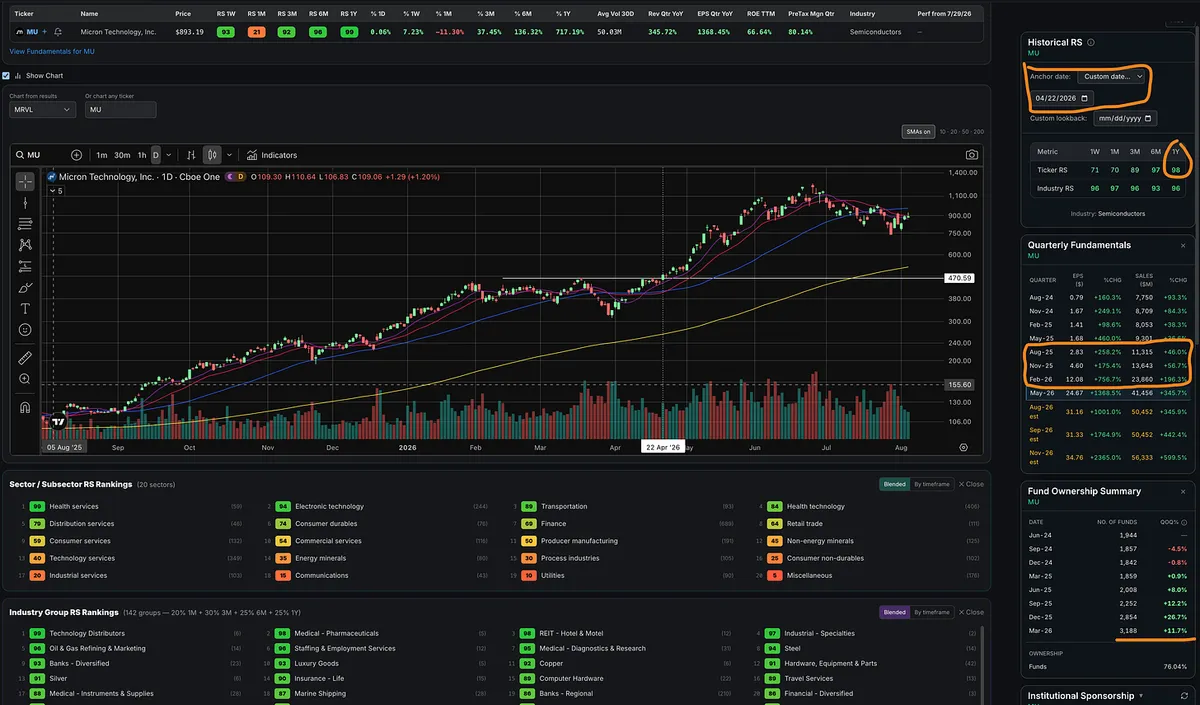
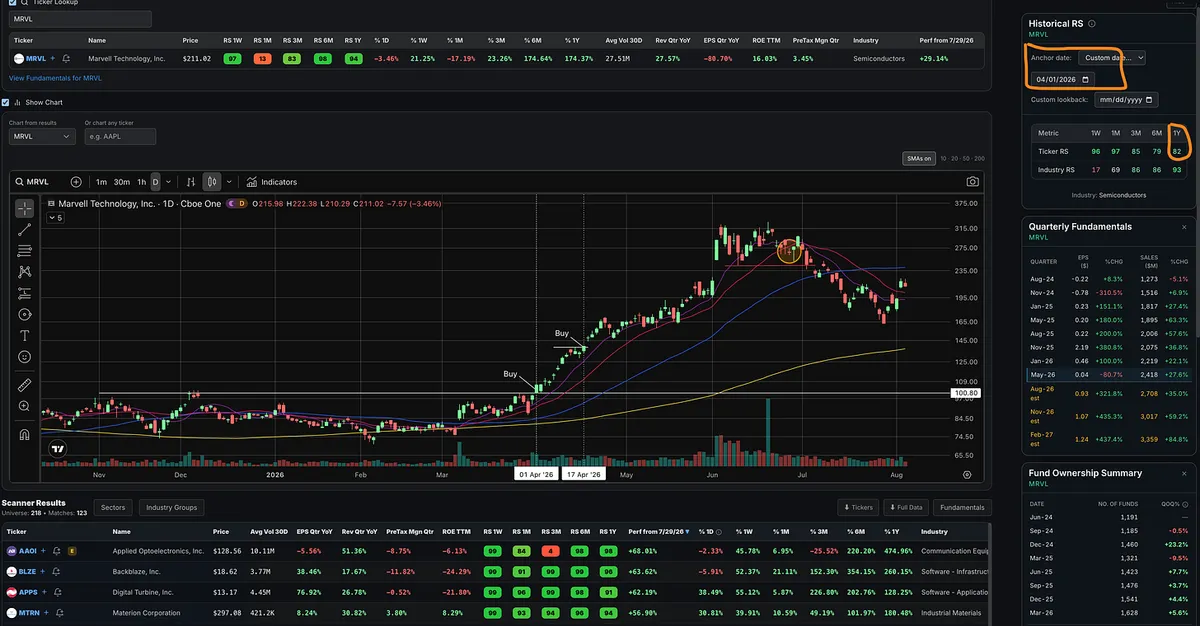
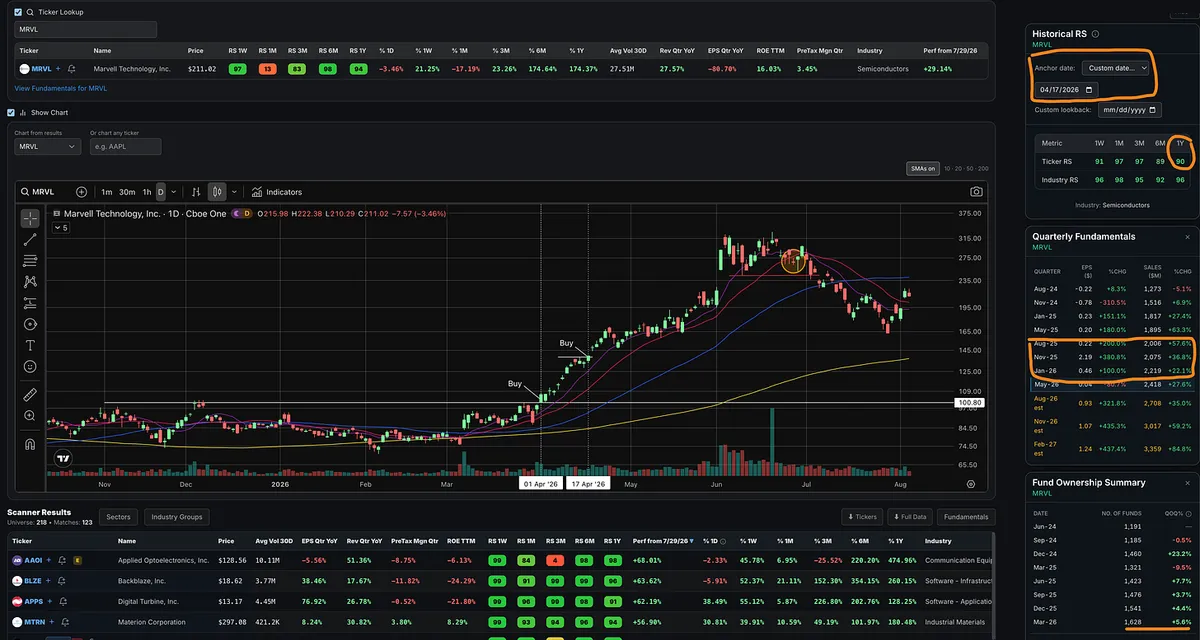
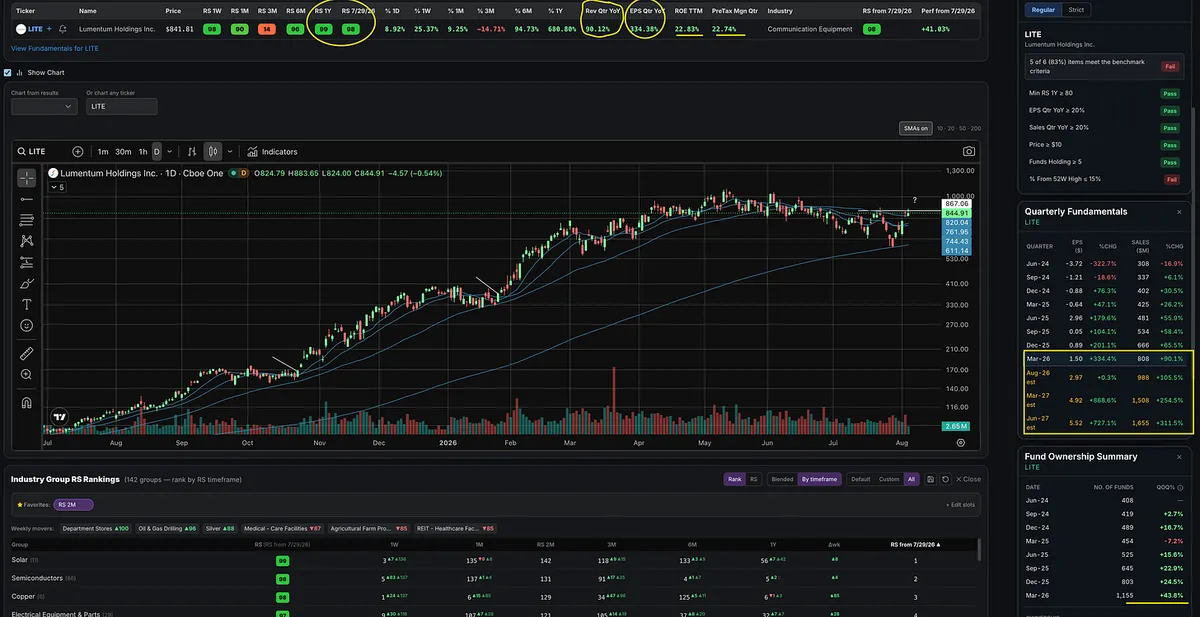
In this SNDK example, the stock still had elite longer-term Relative Strength, but its shorter-term RS started falling as price consolidated, found support, volume dried up, and higher lows began forming.
At first glance, that weaker short-term RS might look bearish.
But in the right context, it can be exactly the opposite.
It can be telling you that a powerful leader has finally stopped running long enough to build another potential buying opportunity.
That’s the part many traders miss.
But there’s a catch.
The exact same RS relationship can also appear when a former leader is actually breaking down.
If price loses important moving averages, fails to reclaim them, starts making lower lows, and the overall chart deteriorates, then falling short-term RS may be confirming that the stock’s leadership is ending.
Same Relative Strength readings. Completely different message.
That’s why I never use Relative Strength in isolation.
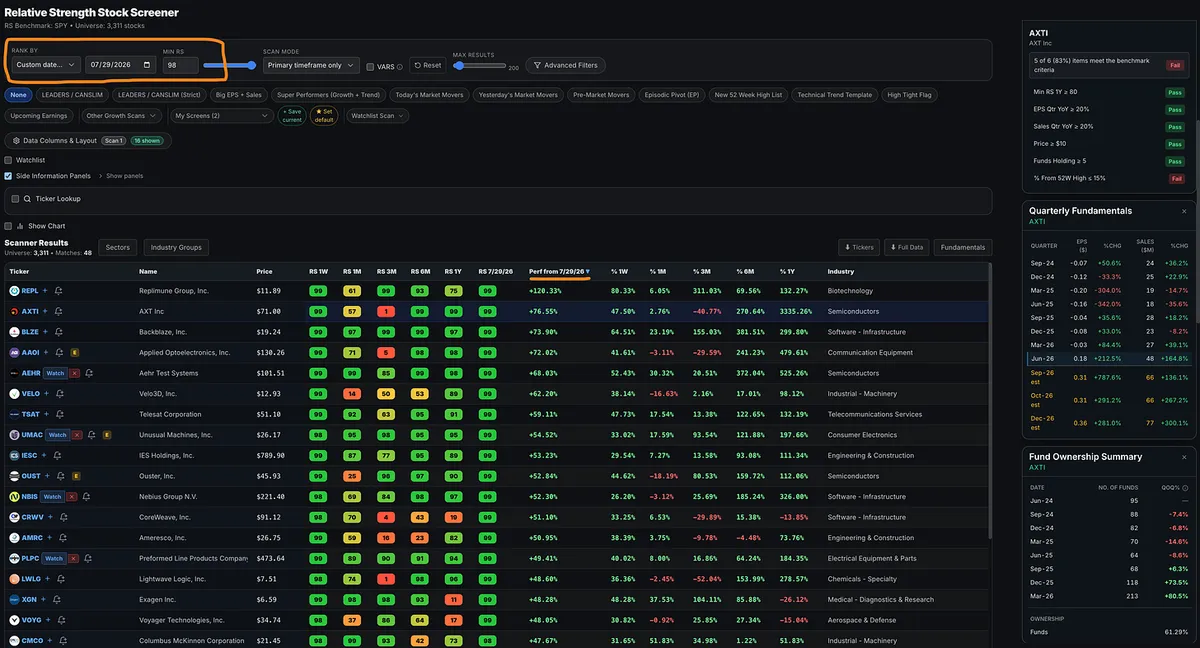
A screener can help me find the stock.
Price, volume, trend, and the chart tell me what the RS actually means.
This clip comes from a longer video where I walk through some of the exact stock screens I personally use inside MTS Velocity, including how I combine different Relative Strength timeframes, fundamentals, volume, trend, and market context to narrow thousands of stocks down to the names I actually want to study.
The full video and MTS Velocity Stock Screener are available to all paid subscribers.