If I Could Only Use One Indicator for the Rest of My Life, It Would Be This
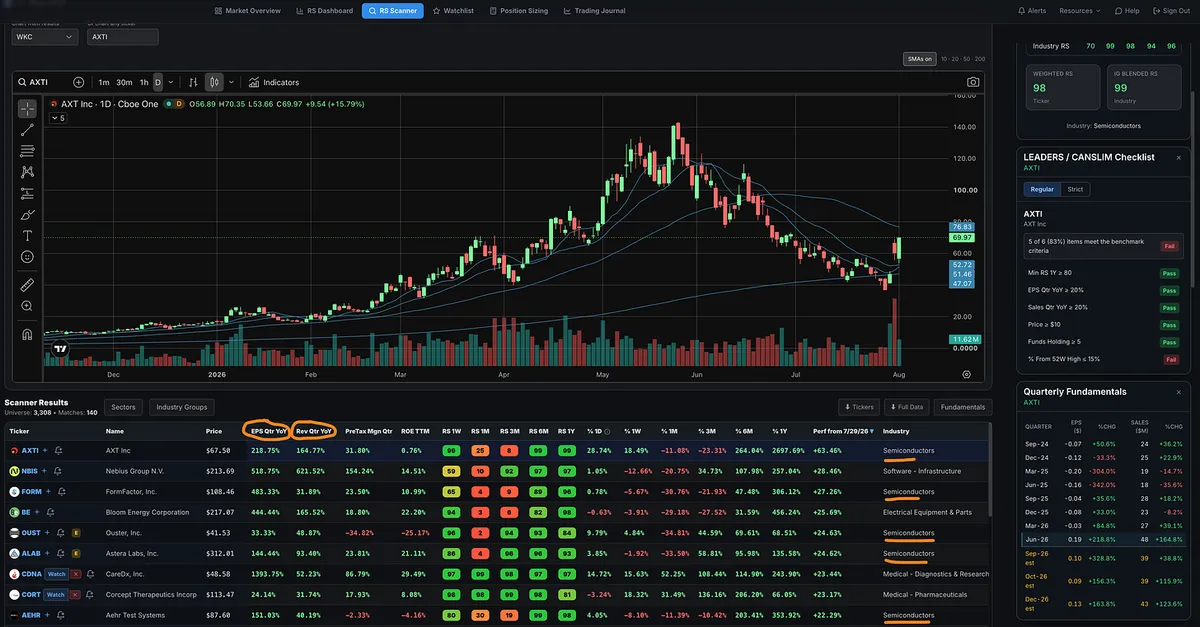
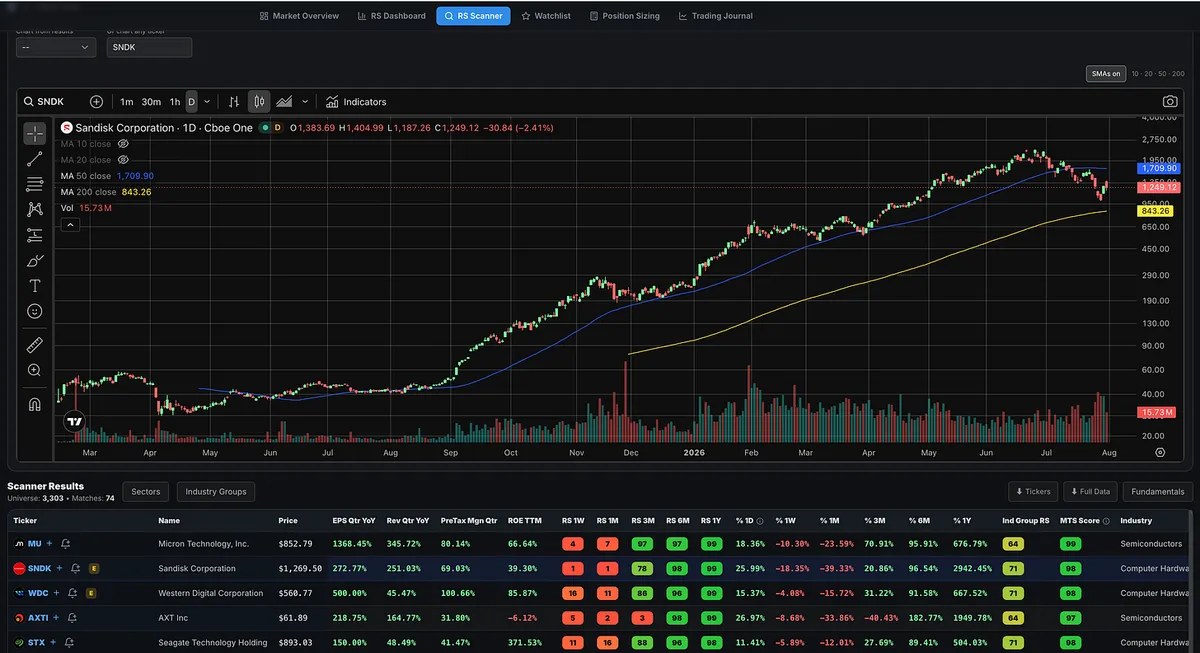
As a momentum trader or growth stock investor, it is hard to beat relative strength.
If I could look at only one thing besides price for the rest of my trading career, it would be RS.
And no, relative strength is not the same thing as RSI.
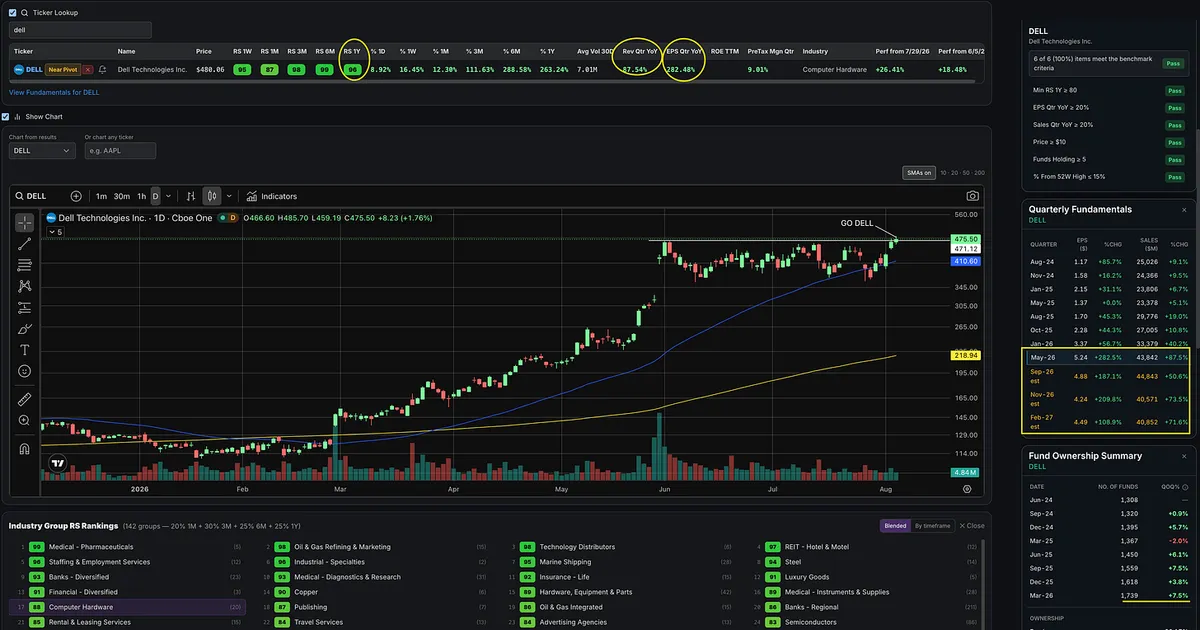
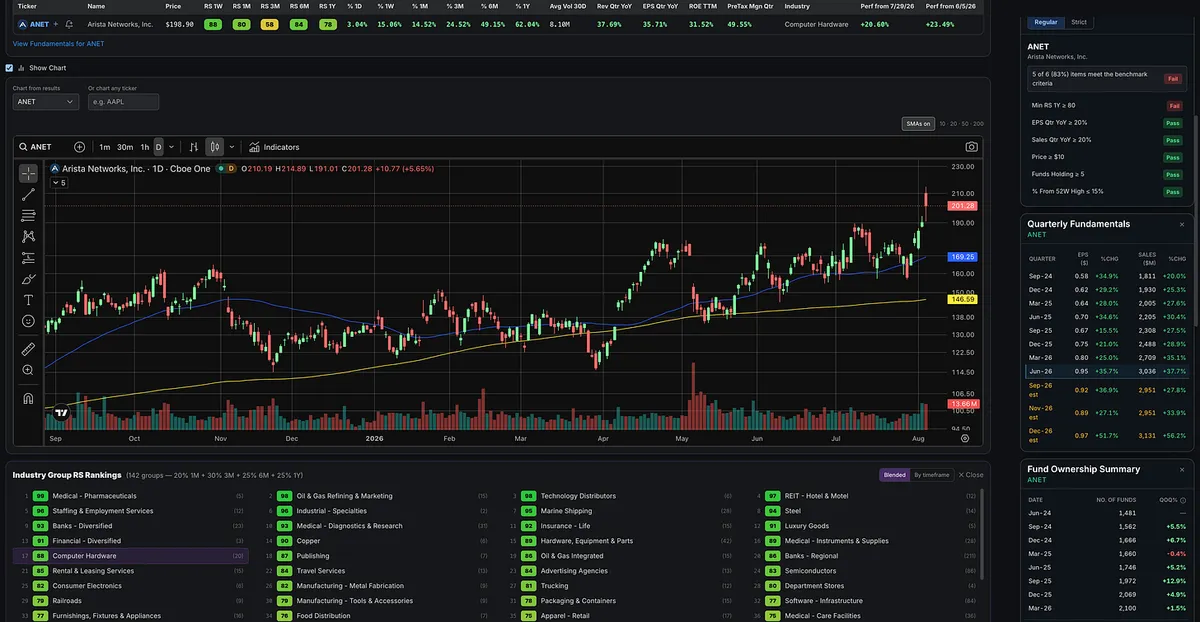
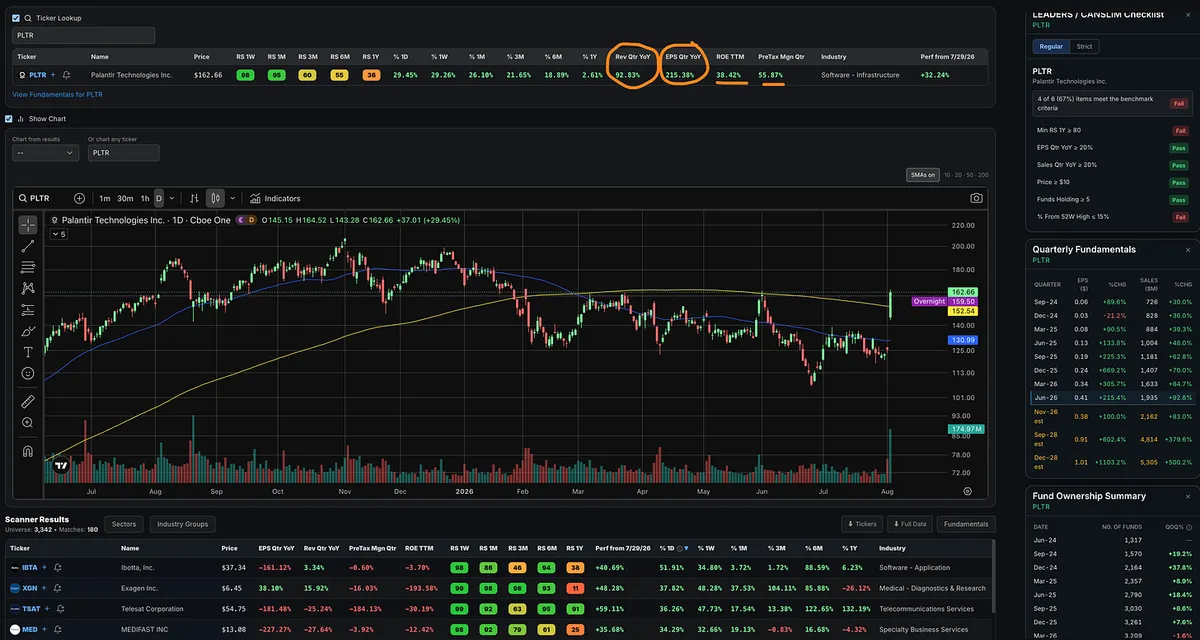
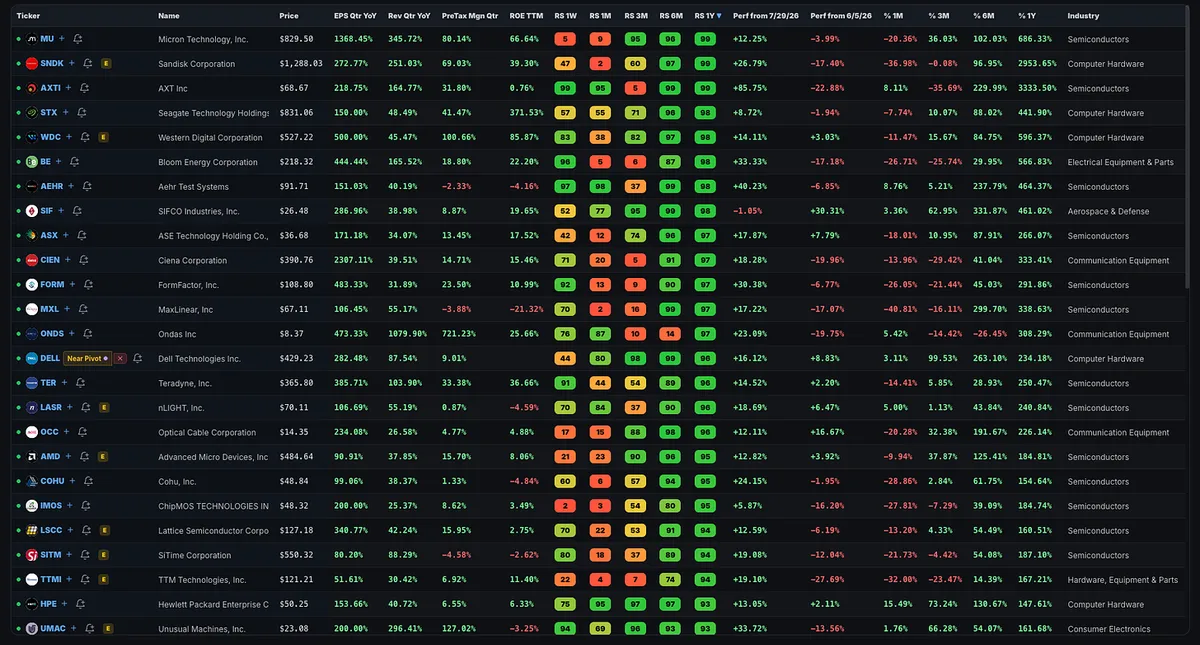
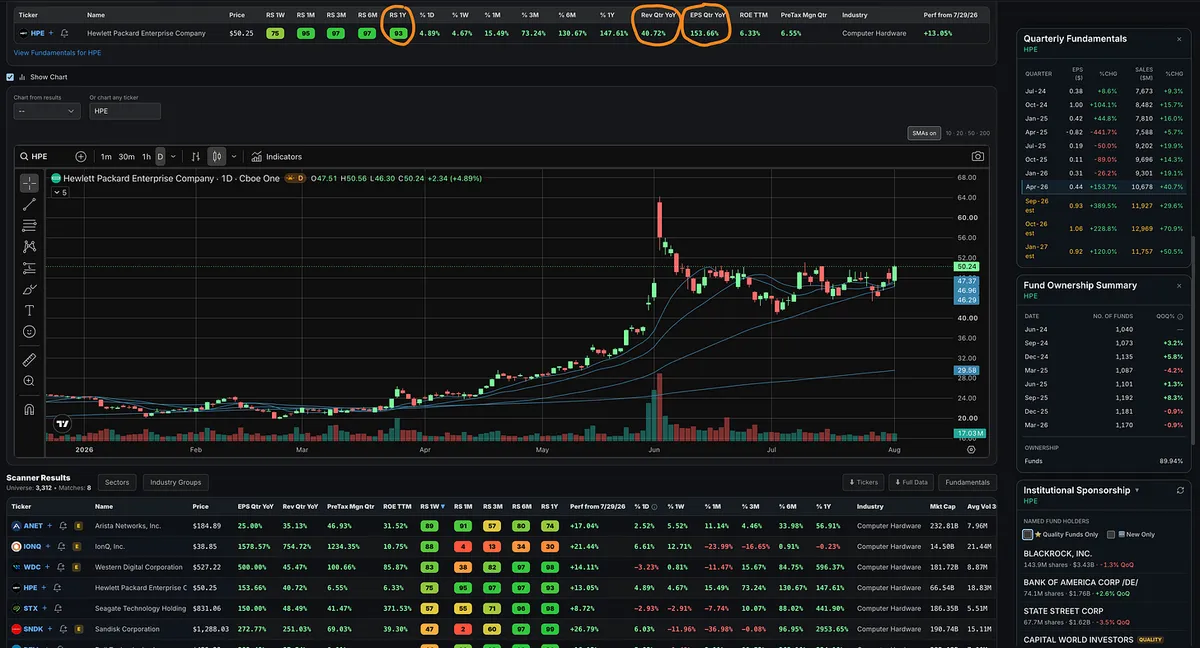
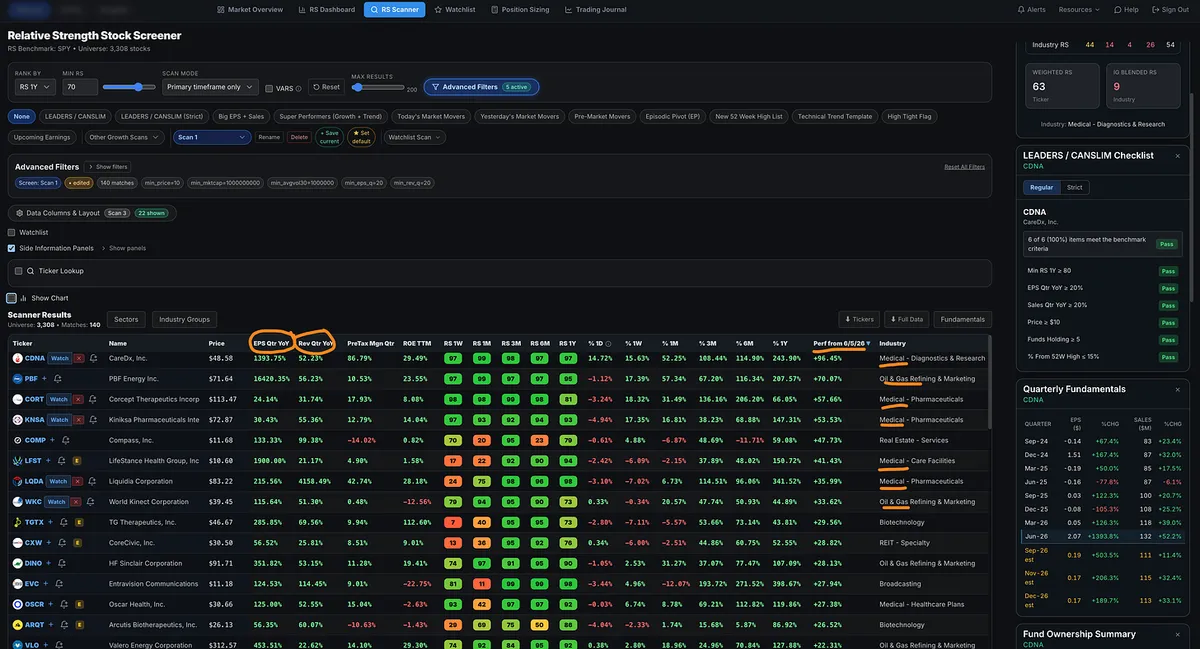
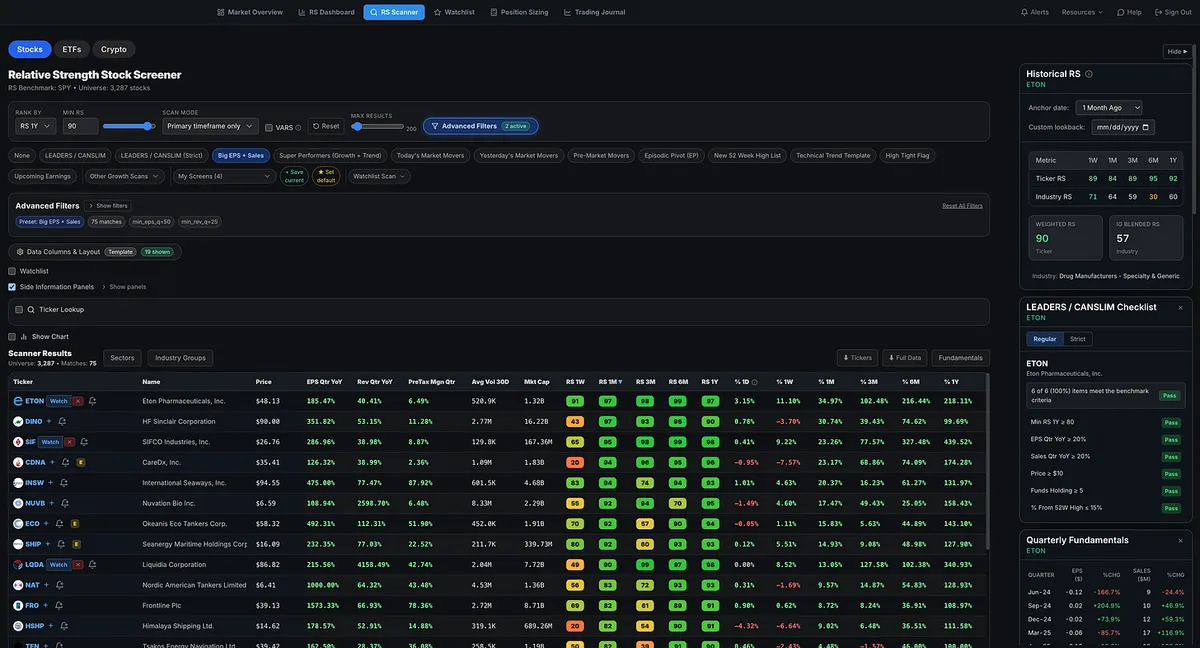
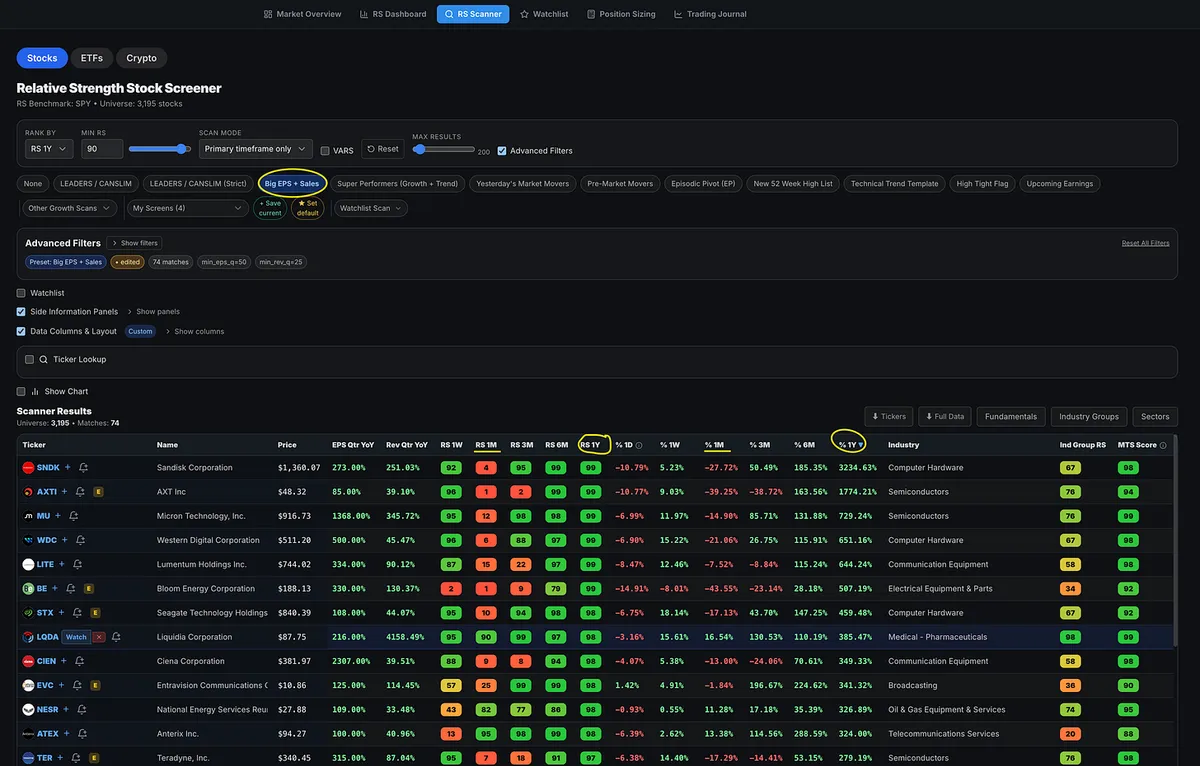
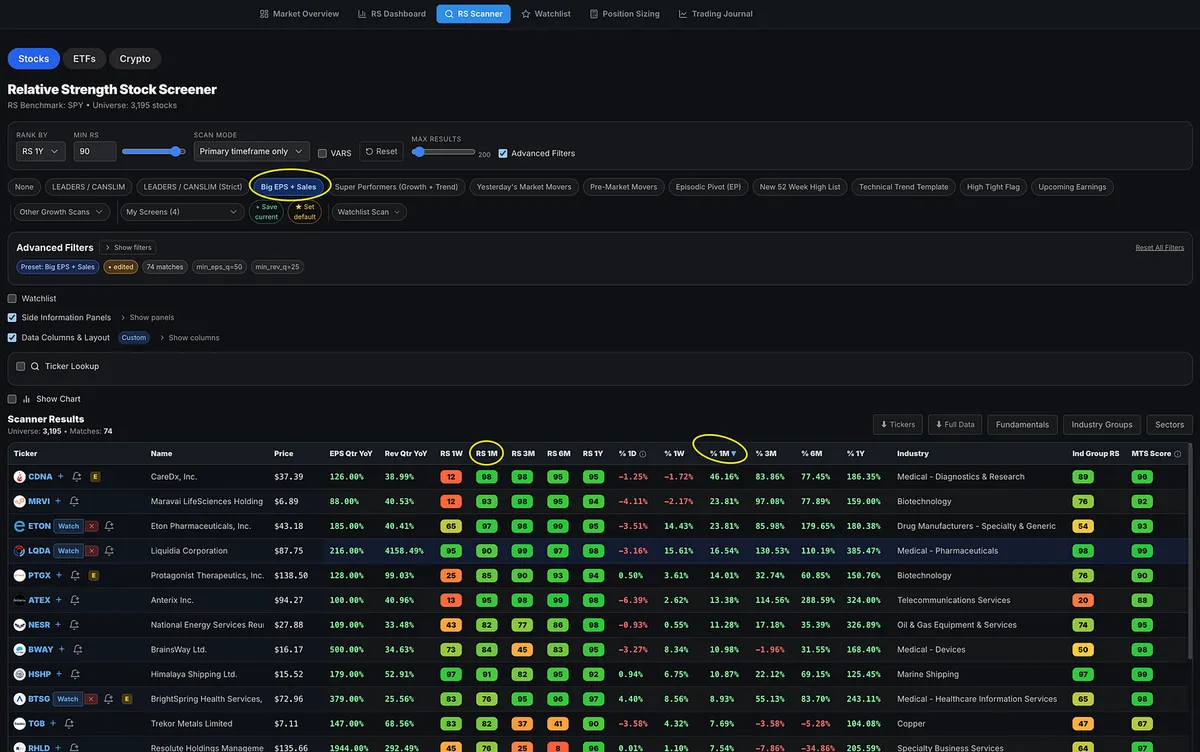
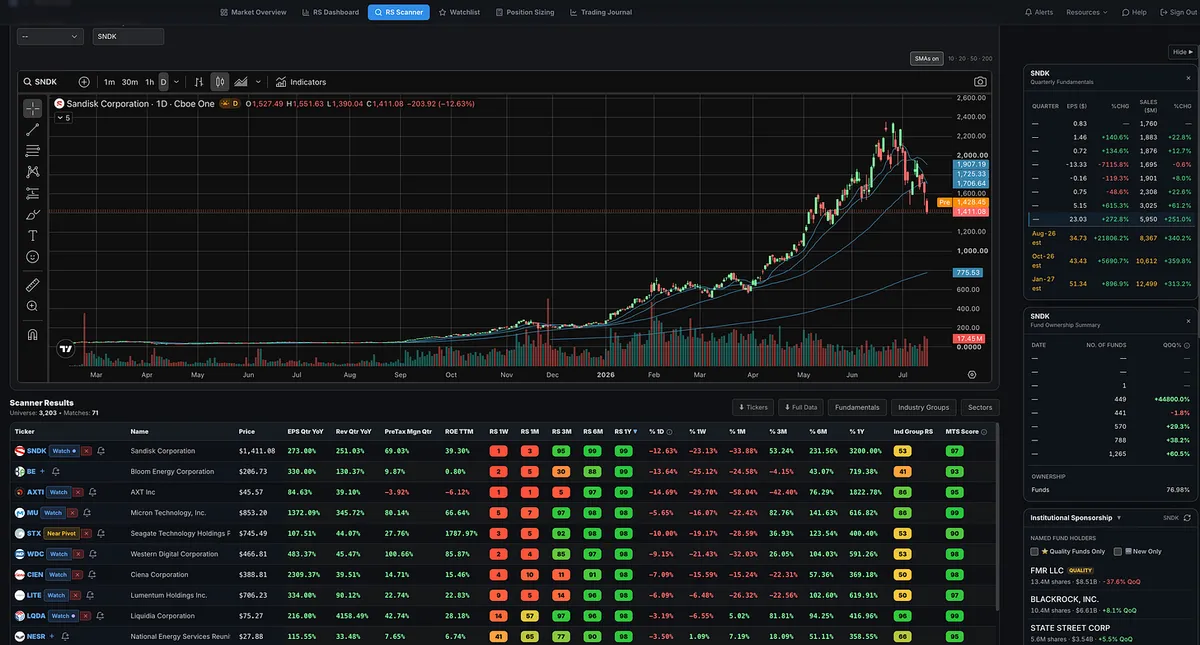
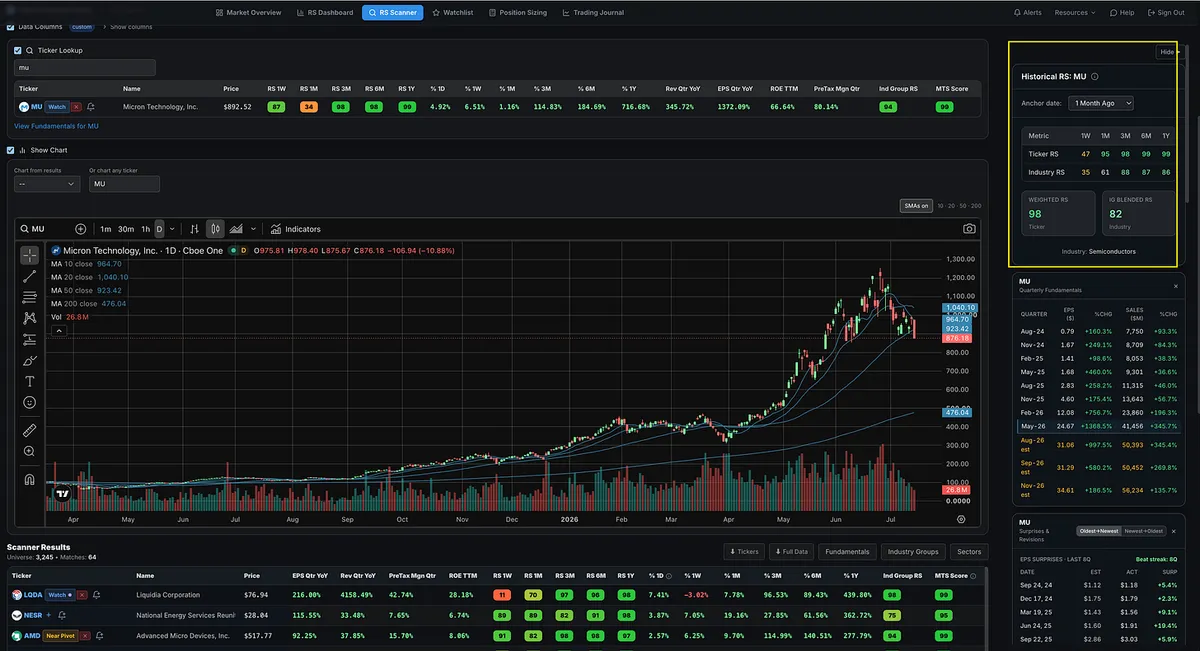
At the most basic level, a standard one-year RS rating ranks a stock’s price performance over the past 52 weeks against every other stock in the market.
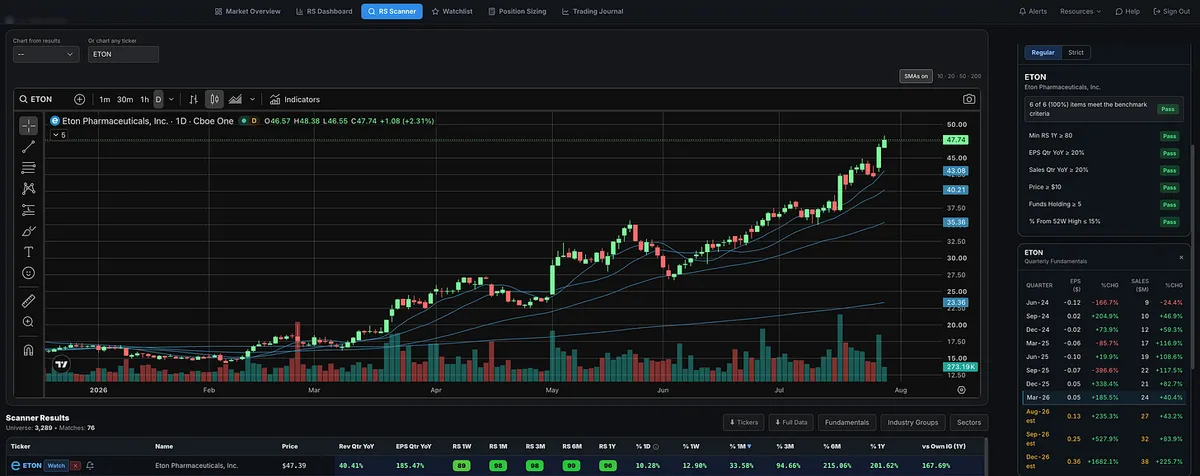
A stock with a 99 RS rating has outperformed 99% of the market. You are looking at one of the strongest-performing stocks over that period.
But relative strength is much more than simply sorting stocks by their one-year rating.
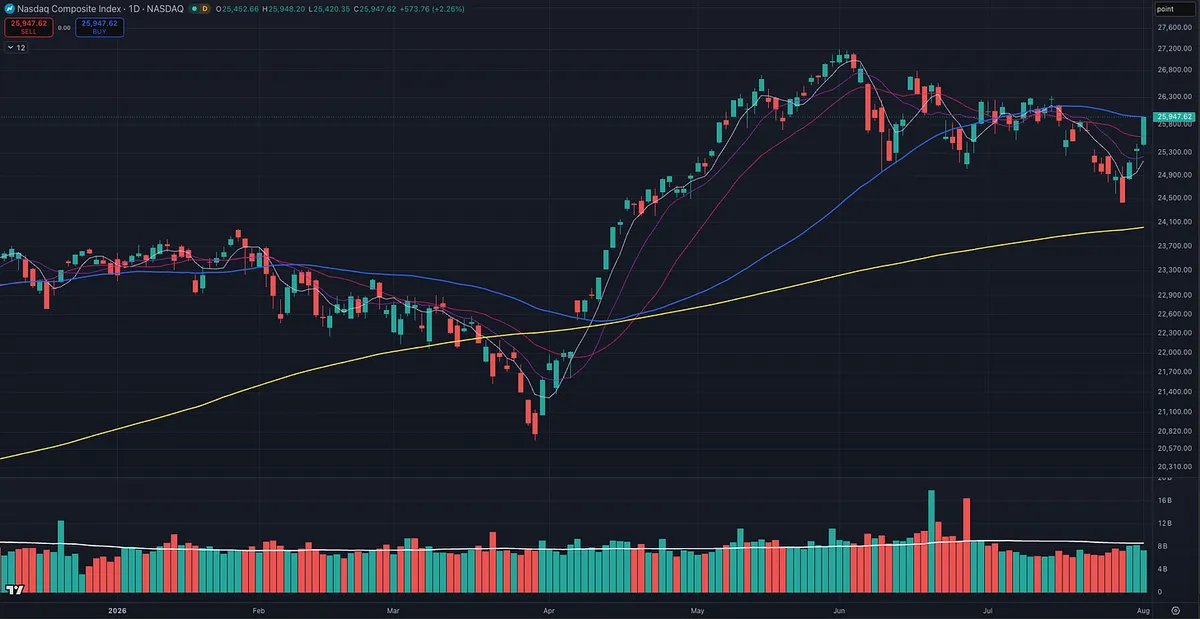
Suppose the market falls 20%, but a stock declines only 10%. That stock is showing relative strength.
If the market is falling or moving sideways while a stock continues advancing, that is relative strength.
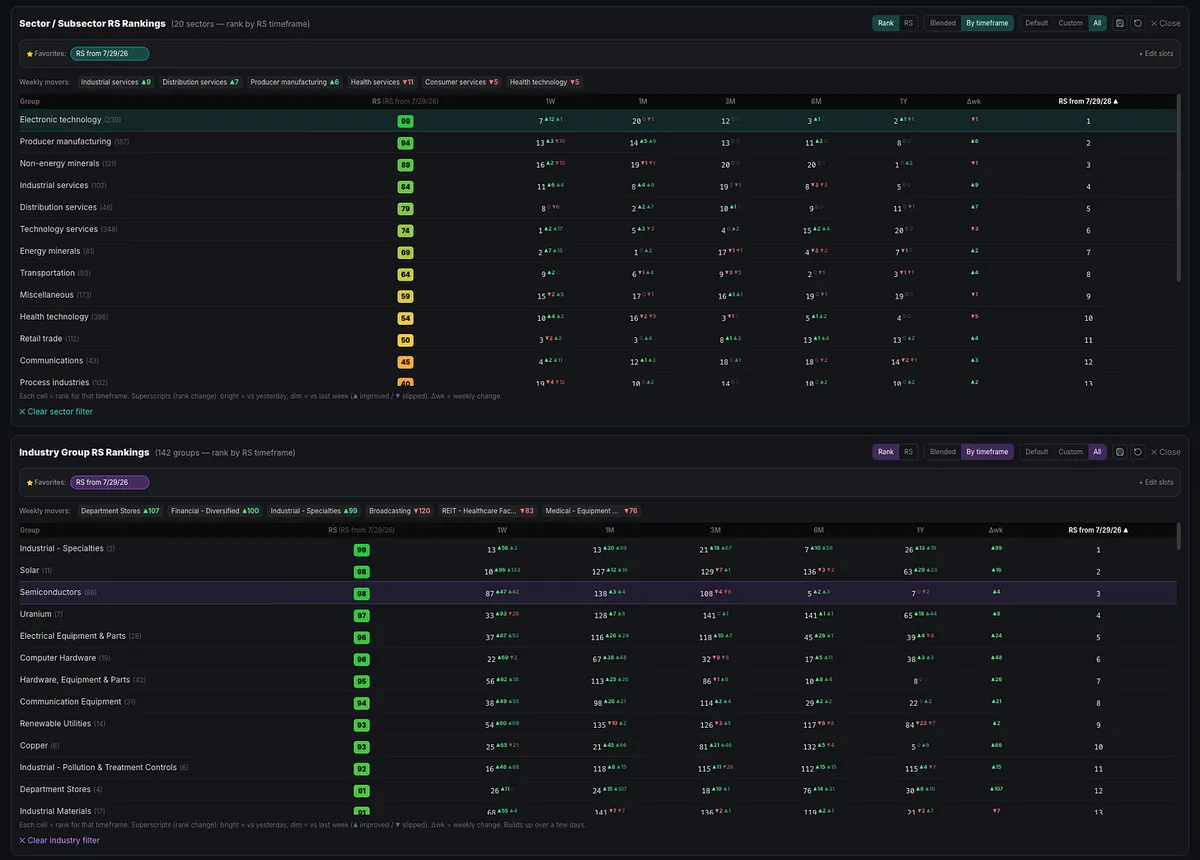
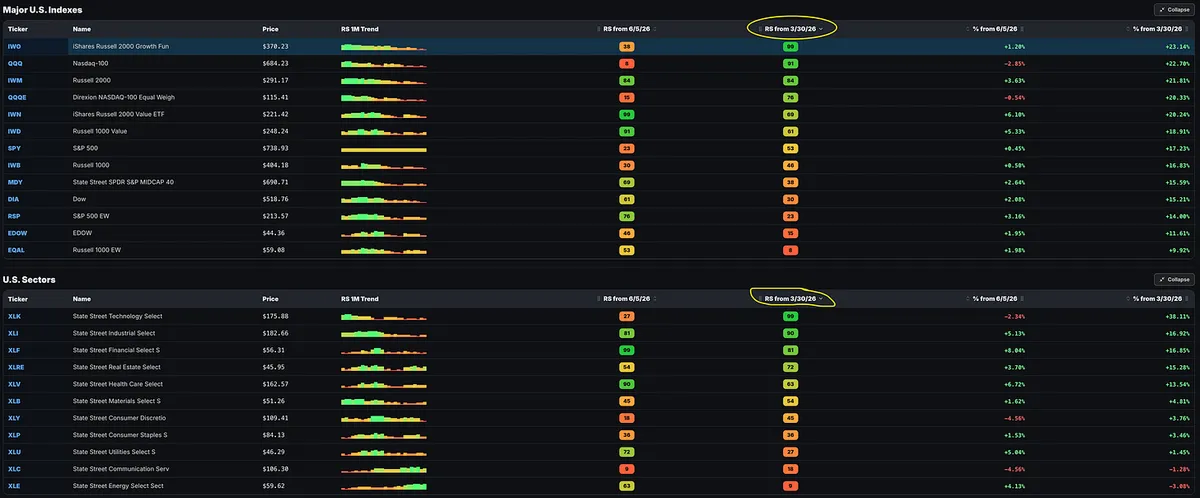
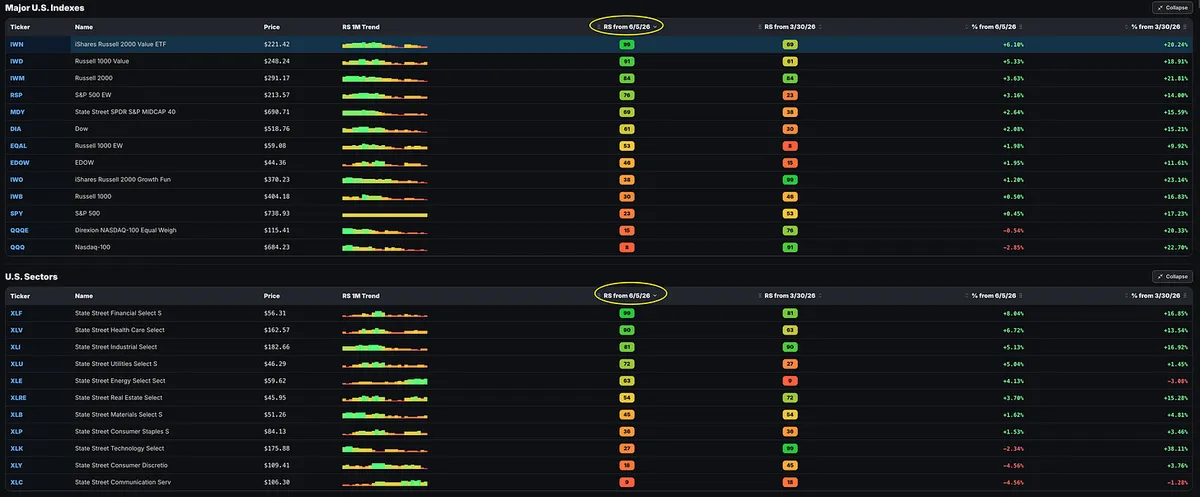
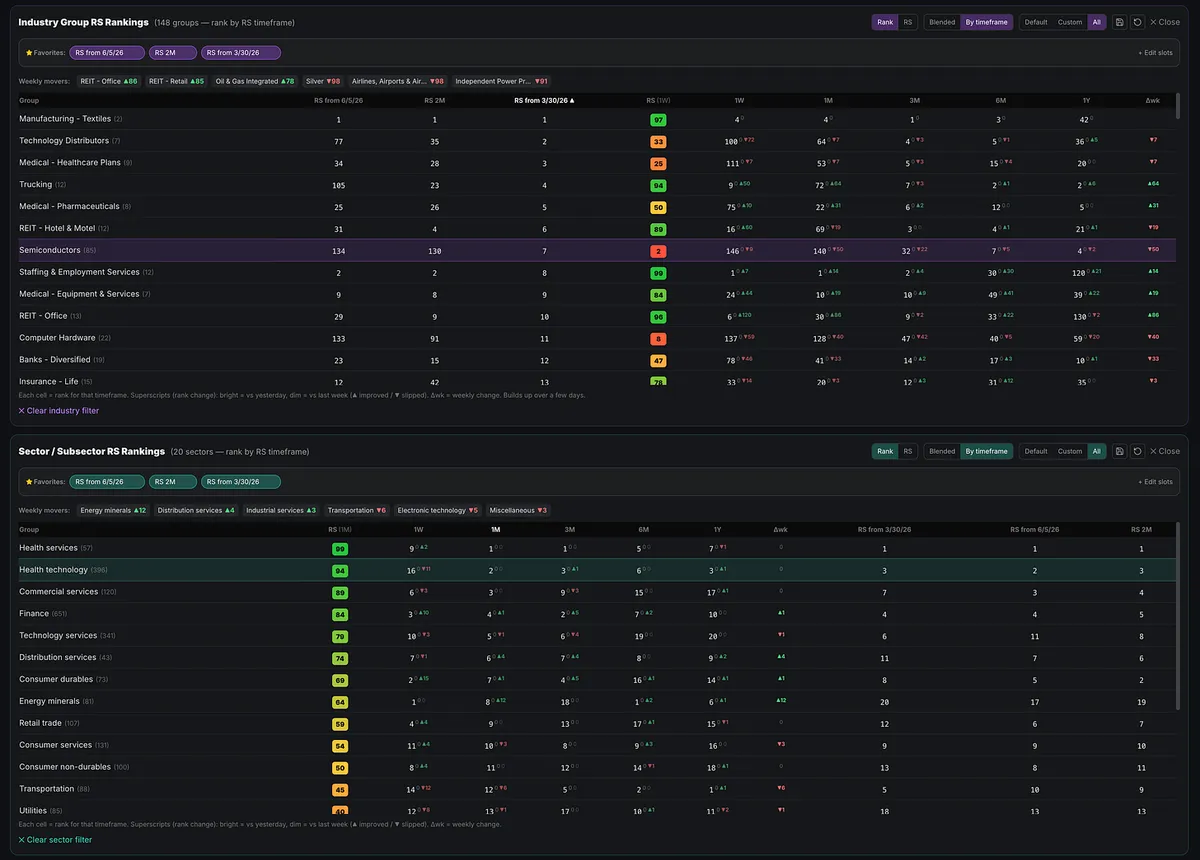
You can take the analysis even further by comparing the stock with its sector, industry group, related ETF, and the strongest themes in the market.
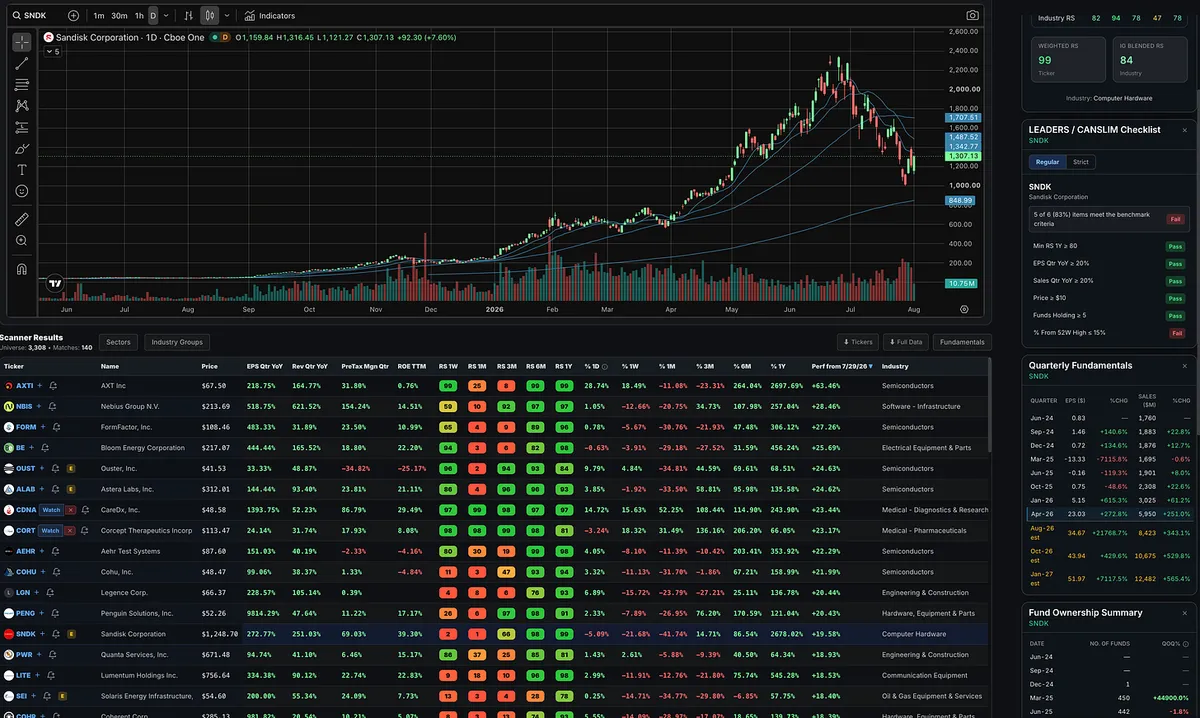
Suppose an industry group is up 50%, but the individual stock is up only 30%. The stock may look strong in isolation, but it is actually showing relative weakness compared with its peers.
Why trade the laggard when stronger names exist within the same group?
Why take the additional company-specific risk of owning an individual stock when the sector or theme ETF is outperforming it?
Ideally, I want to see a stock outperforming:
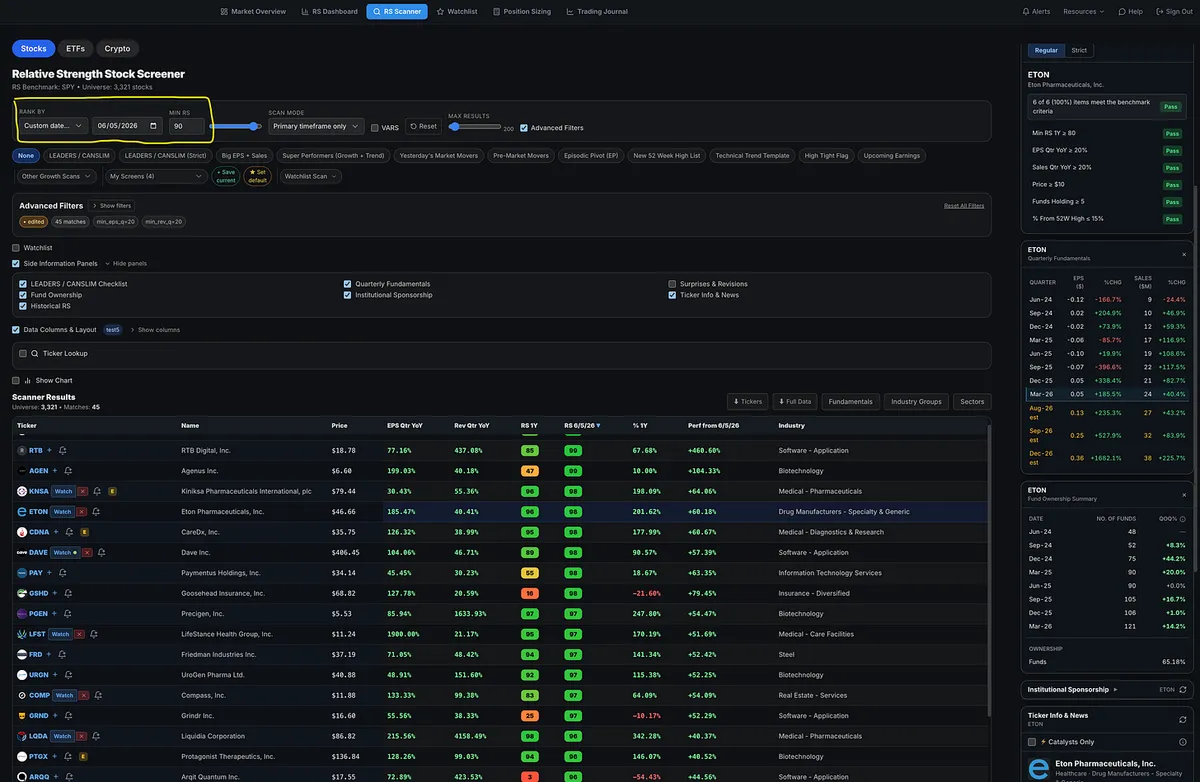
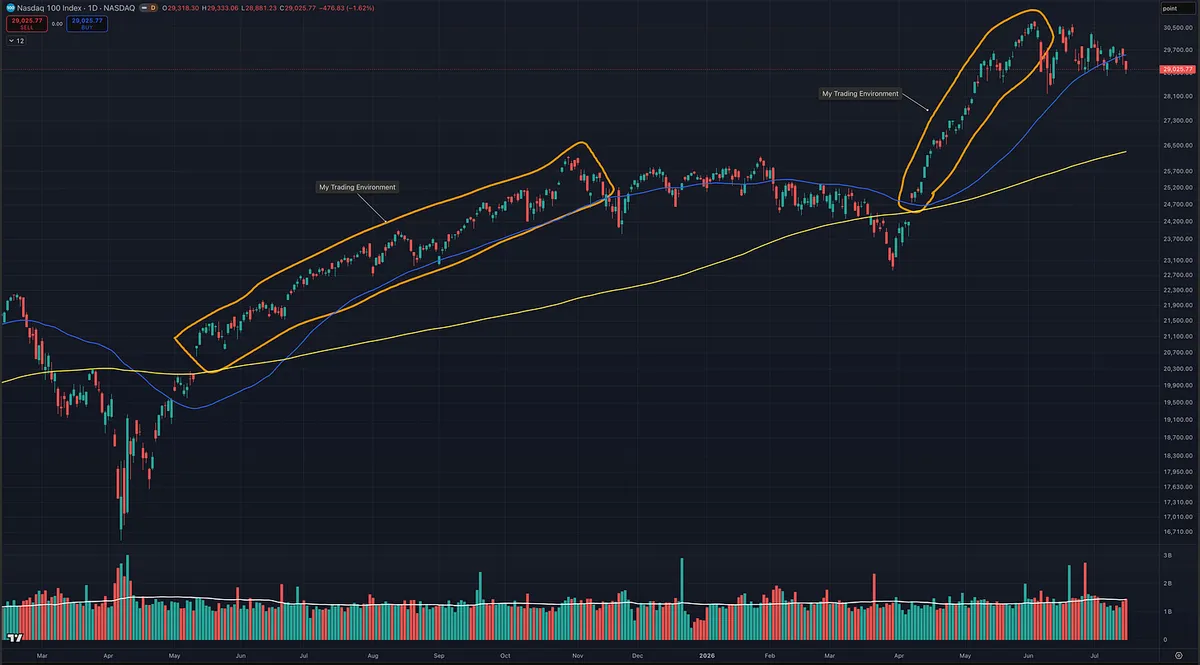
And do not study relative strength only while the market is rising.
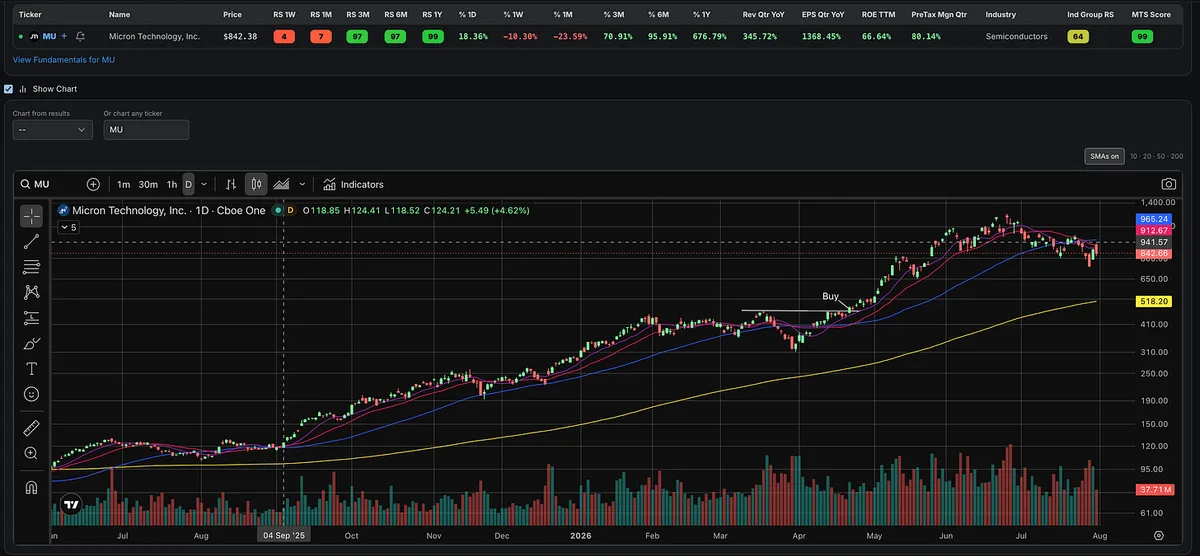
Some of the most valuable information appears during corrections.
When the market is falling, which stocks refuse to break down?
Which names hold above support, decline less than their peers, or continue advancing while everything around them weakens?
Strong relative strength during a correction does not guarantee that a stock will become a future market leader.
But it can be one of the biggest signals a momentum trader can find.
O’Neil’s research found that the best-performing stocks already had an average RS rating of 87 before beginning their major advances. In other words, the greatest winners were already outperforming nearly nine out of every ten stocks before their most explosive moves began.
This was not based on a few cherry-picked examples. O’Neil studied more than 1,000 of the market’s greatest winners, spanning more than a century, and specifically examined the degree of relative strength they displayed before their enormous advances.
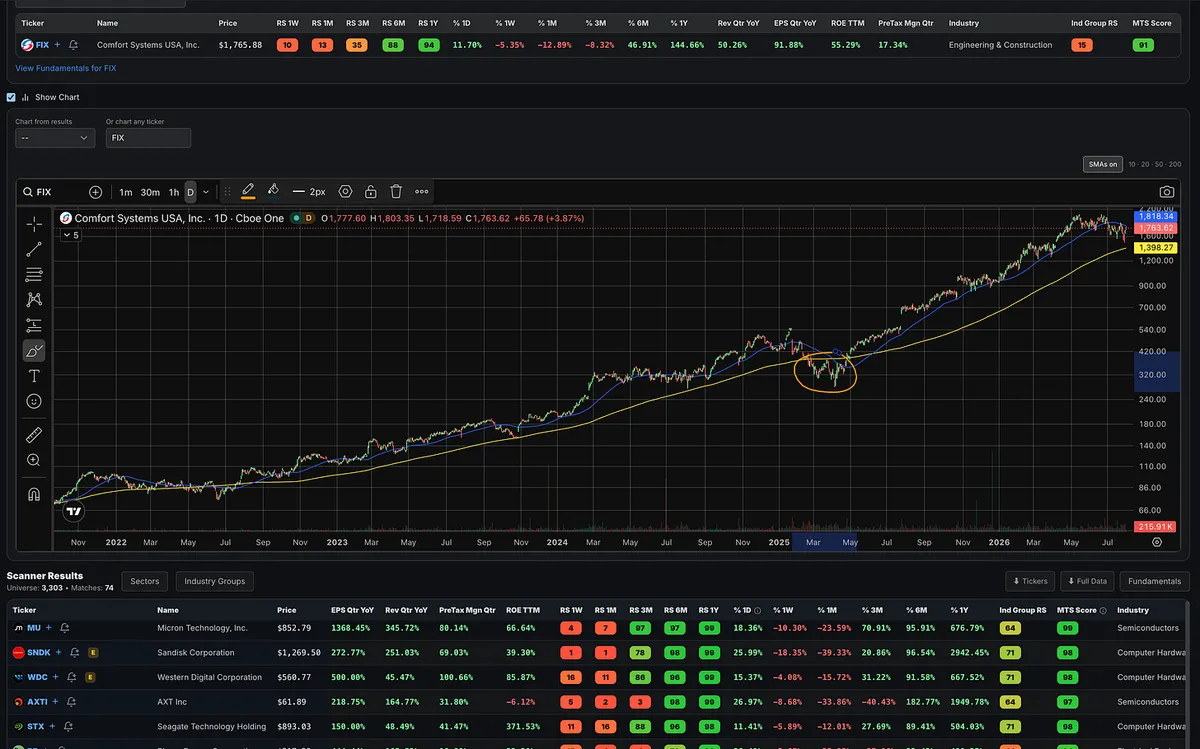
FIX is a perfect modern example.
The stock turned higher and began making new highs while the broader market was still struggling. It revealed itself before the indexes confirmed the new uptrend, then went on to become a massive winner of more than 1,000%.
That is why relative strength during a correction matters so much.
The future leaders do not always wait for the market to give everyone an obvious signal. Some begin separating from the crowd before the indexes turn higher.
However, there is an important caveat.
When growth stocks are being beaten down, defensive areas will often rise to the top of the RS rankings as investors rotate toward safety.
That does not automatically make those defensive stocks the next major leaders.
When the market recovers and growth stocks begin improving, many of those defensive names quickly disappear from the top of the rankings.
Do not confuse temporary defensive strength with genuine emerging leadership.
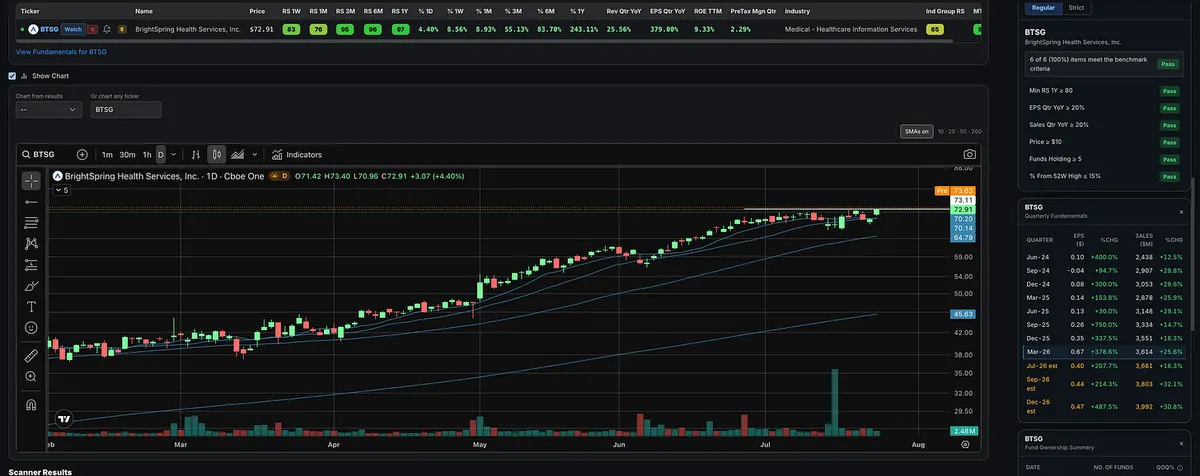
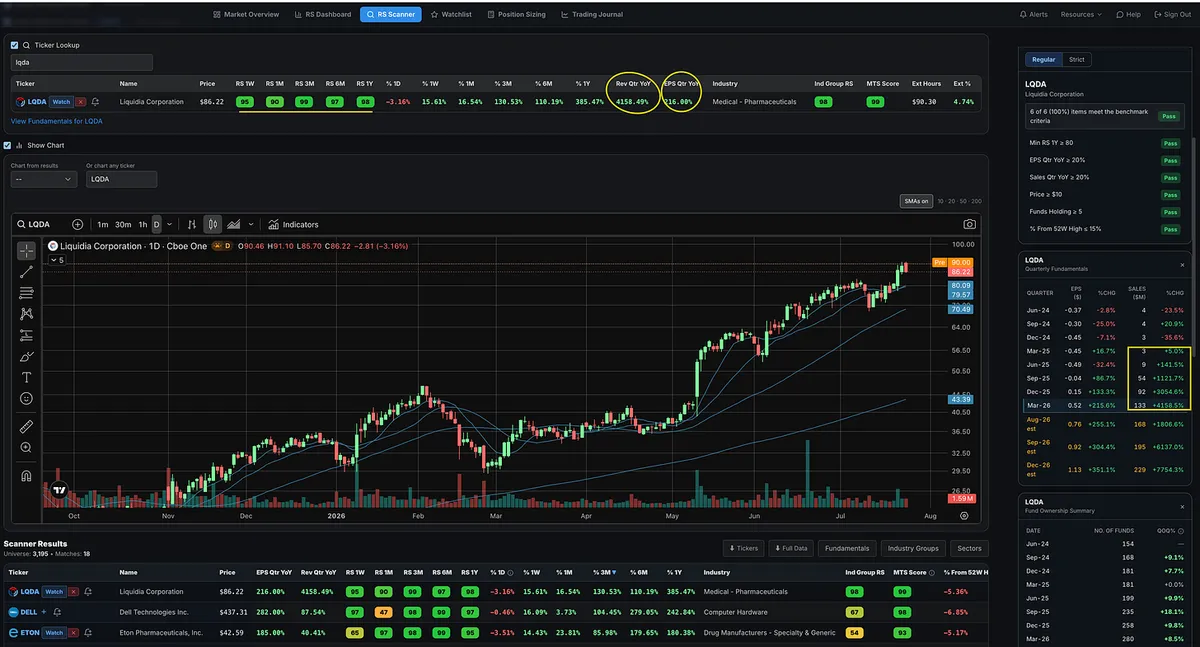
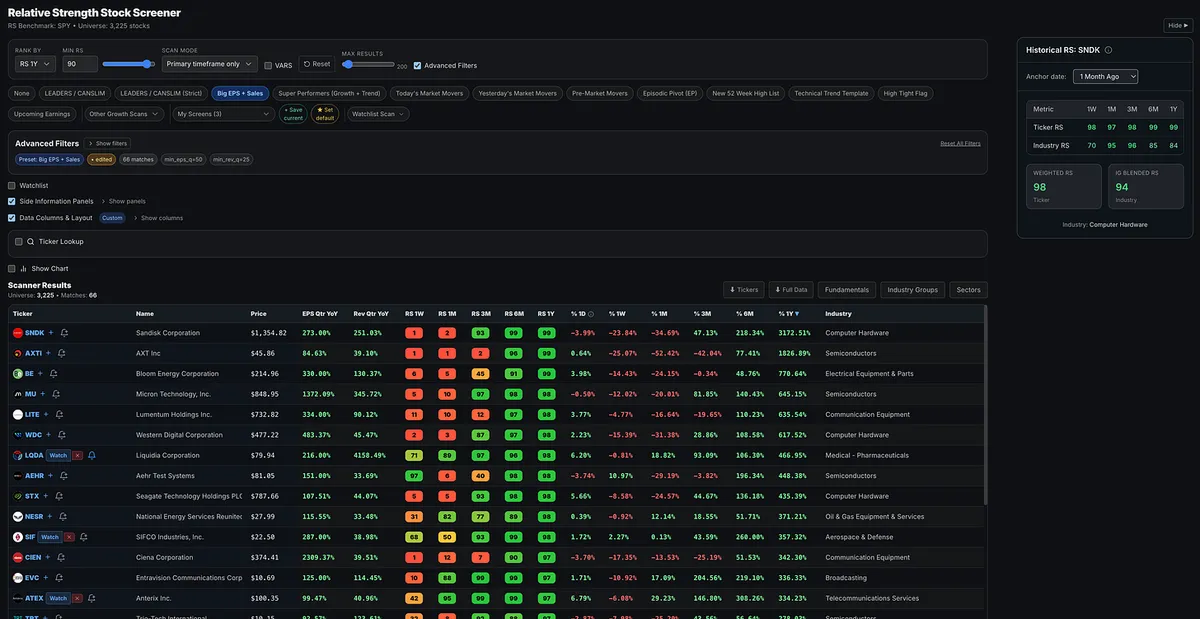
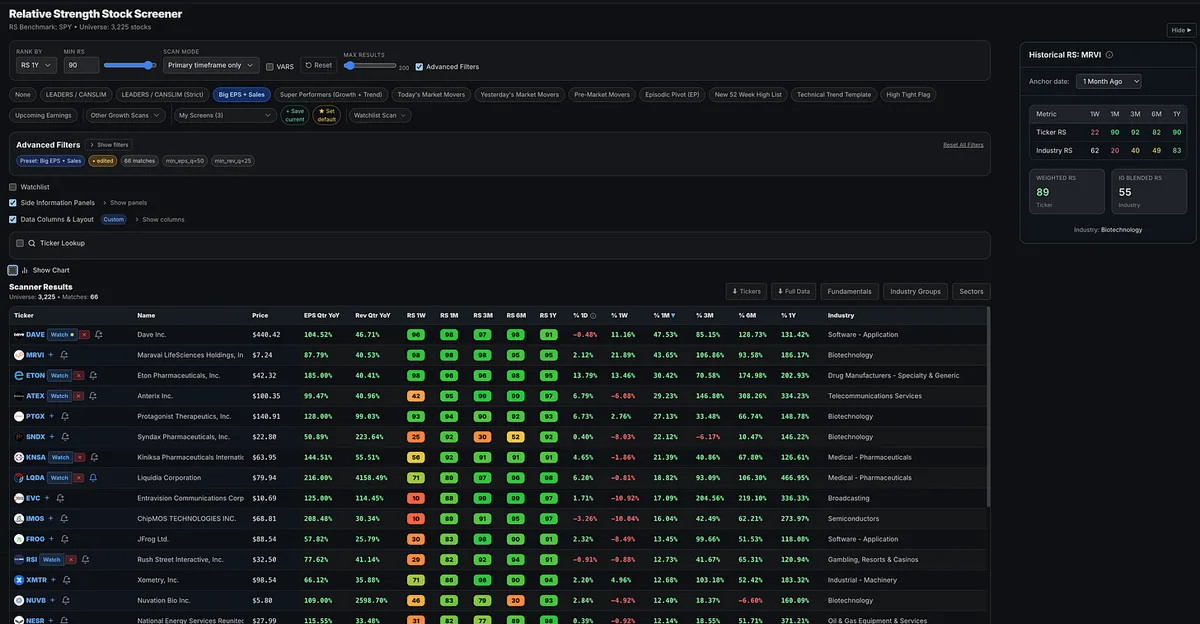
Look for growth stocks with strong earnings and sales, improving price and volume action, strong industry-group support, and exceptional relative strength that are already separating from the market.
Strong RS during a correction is not a guarantee.
But it is one of the most important clues that a future market leader may already be emerging.