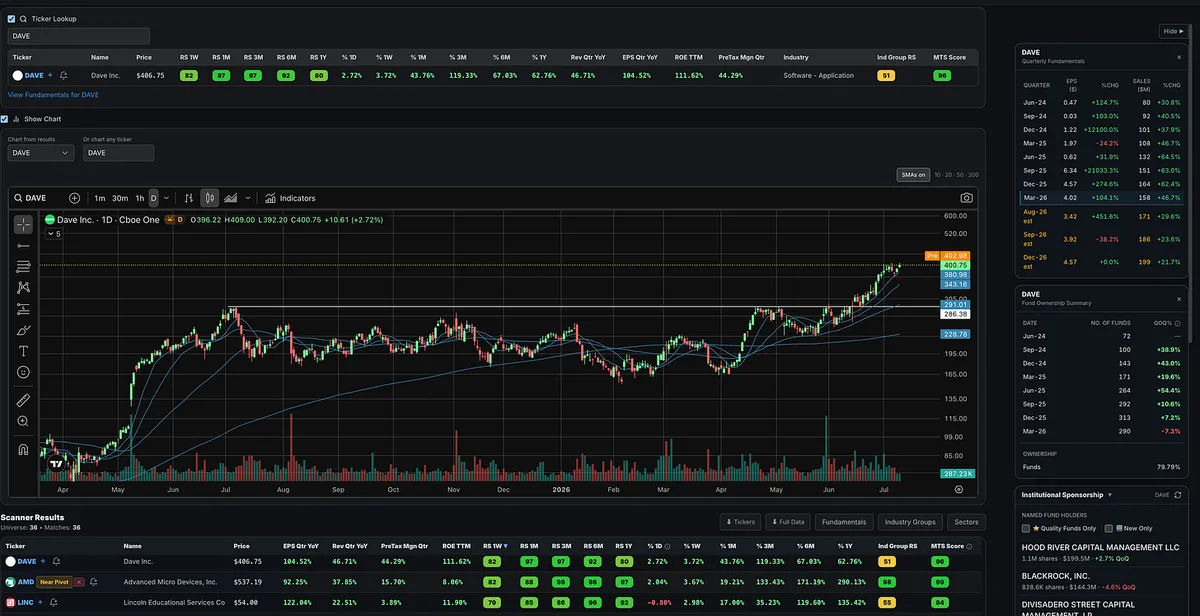
After consolidating for nearly a year, DAVE broke out in mid-June and has been marching higher along the 10-day moving average ever since.
Notes
What to buy: how to find, screen and rank the strongest stocks and industry groups.
Showing 101–120 of 299 notes
After consolidating for nearly a year, DAVE broke out in mid-June and has been marching higher along the 10-day moving average ever since.
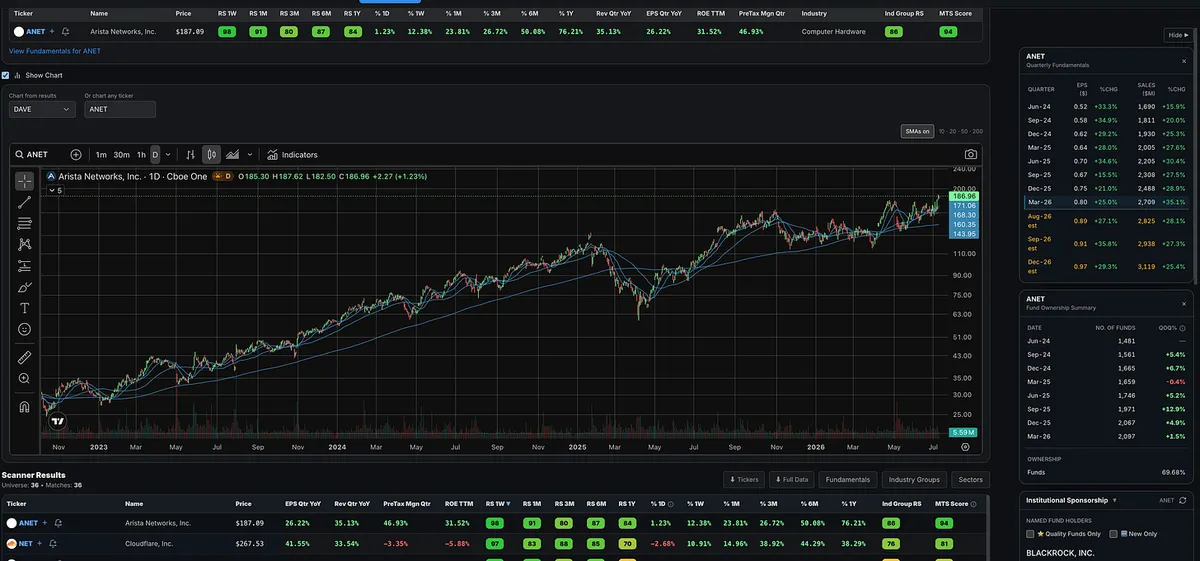
ANET pushed to a new high Friday. Now we’ll see whether it can hold the breakout and continue marching higher.
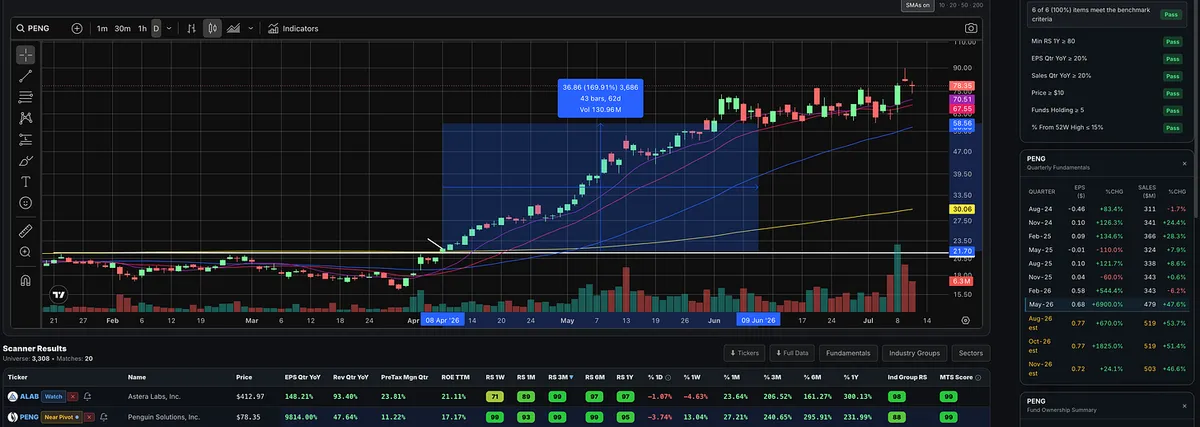
What a beautiful trend from PENG.
The stock broke out in early April and spent the next two months riding the 10-day moving average higher.
Clean. Controlled. Powerful.
This is beautiful.
What’s More Important: The Stock or the Market?
Should you study the market...
Or should you study individual stocks?
You've probably heard both arguments.
"If the market is weak, don't fight it. Most stocks will go down."
True.
But you've also heard this:
"The leading stocks will often break down before the indexes do, and they'll often recover before the indexes confirm a new uptrend."
Also true.
So which one should you focus on?
Both!
Because this isn't an either/or decision.
Think about it.
The market indexes are nothing more than collections of individual stocks. If enough leading stocks begin breaking down, eventually the indexes will reflect it.
But the opposite is also true.
Even the strongest stock with outstanding fundamentals, accelerating earnings, and excellent price action will often struggle if the overall market and its industry group come under heavy selling pressure.
It's the trading version of the classic question:
What came first, the chicken or the egg?
There isn't a useful answer because they're connected.
That's exactly why William O'Neil included the M (Market Direction) in CAN SLIM.
Study the market.
Study the industry groups.
Study the leading stocks.
Each tells you something the others cannot.
The market tells you whether the tide is rising or falling.
The industry groups tell you where the money is moving.
The leading stocks tell you where institutions are placing their biggest bets.
And remember, while the indexes are made up of individual stocks, they don't always tell the whole story.
Sometimes a handful of mega-cap leaders can carry the indexes higher while most stocks quietly struggle. We saw exactly that during parts of 2023 with the Magnificent Seven.
Other times, the leading stocks that carried the market higher start breaking down before the indexes show real damage.
The surface can still look fine for a while.
But underneath, leadership is already changing.
That is often one of the first warnings that the market is weakening.
That's why serious traders don't just watch the indexes.
They watch what's happening beneath the surface too.
Because when you understand the market, the industry groups, and the individual stocks driving them, you see a much more complete picture.
You're seeing the market as it's actually unfolding.
There is no shortcut.
You have to study the market, the groups, and the stocks.
What Is Relative Strength and Why Is It So Important?
Many new traders, or people unfamiliar with relative strength, confuse it with RSI.
They are completely different.
RSI is an oscillator. It moves between 0 and 100 and is often used by traders to identify overbought or oversold conditions.
Relative strength, popularized by William O’Neil and Investor’s Business Daily, is completely different.
It is not asking:
“Is this stock overbought?”
It is asking:
“Is this stock outperforming the market and outperforming almost everything else?”
That is a much more important question.
William O’Neil said it best:
“I rarely pay attention to overbought/oversold indicators.”
And many Market Wizards have expressed a similar idea in one way or another.
The strongest growth stocks can stay “overbought” for long periods of time.
That is often what they do when they are under real accumulation.
They get strong.
They stay strong.
They keep making new highs.
And while everyone else is worried that the stock is “overbought,” the real leaders keep leading.
So that is why we do NOT care about RSI.
That is why relative strength is so valuable.
A true RS Rating is not just telling you whether a stock is moving up.
It is telling you how that stock is performing compared to a benchmark index, usually the S&P 500, and then how it ranks against all the other stocks in the market.
A 99 RS Rating means the stock is beating the market and outperforming almost everything else. It is in the top 1%.
A 90 RS Rating means it is in the top 10%.
A 50 RS Rating means it is roughly middle of the pack.
A low RS Rating means the stock is lagging badly.
Remember, as growth stock investors and momentum traders, we are:
Not looking for cheap.
Not looking for oversold.
We are looking for leadership.
The biggest winning stocks usually show strong relative strength before and during their major advances.
A stock can have an RS Rating of 80, 90, or 99 and still move hundreds or even thousands of percent. SNDK had a 99 RS Rating at the start of the year and moved another 300%.
They hold up better during market pullbacks.
They recover faster.
They push toward new highs while weaker stocks are still stuck below resistance.
RSI does not tell you that.
Relative strength does.
Inside the Momentum Trading Strategy Software, I break relative strength down across multiple timeframes, including 1 week, 1 month, 3 months, 6 months, and 1 year.
We also have functionality to set a minimum RS level across all timeframes, see what is accelerating and getting stronger, and see what is decelerating and losing strength.
That way, you are not stuck looking at one blended number.
You can see whether a stock is showing short-term strength, intermediate-term leadership, long-term leadership, or all three.
The goal is:
Find the strongest stocks in the strongest areas of the market.
Relative strength helps you do that.
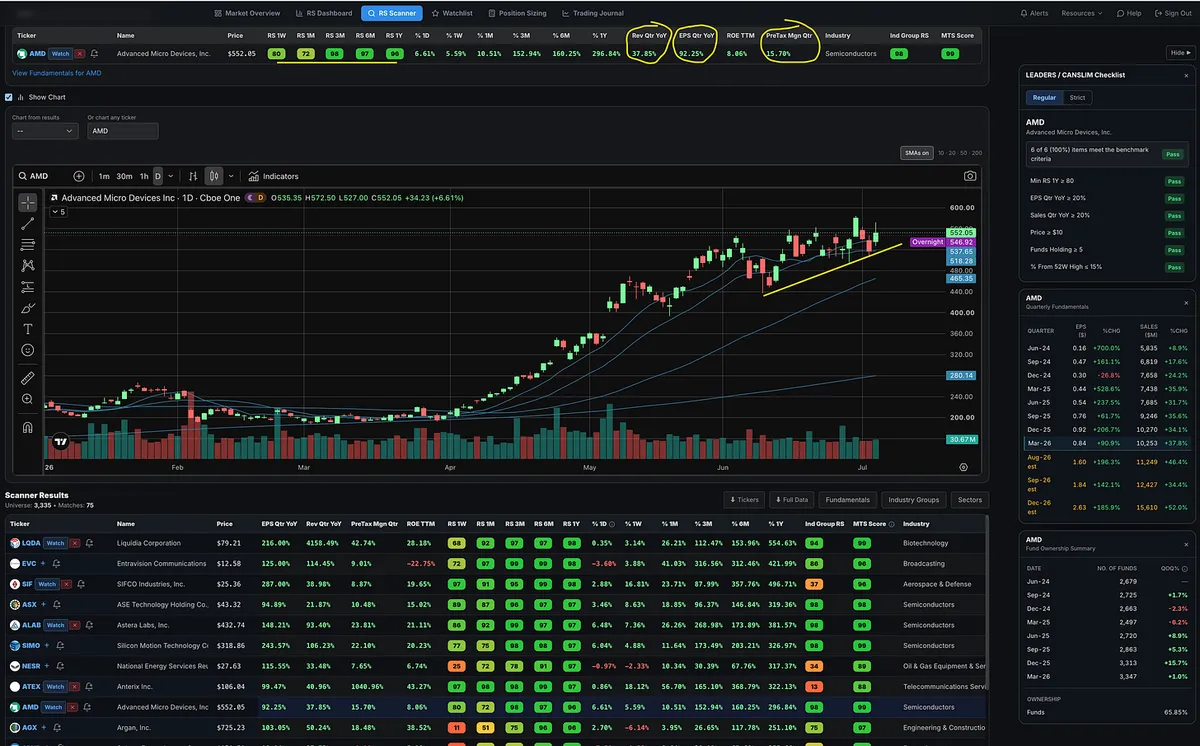
AMD Is Holding Up While Semis Cool Off
While semiconductors have been beaten down over the last few weeks, AMD has held up pretty well.
That is one of the first things I look for when a leading group starts to come under pressure. I want to find the names that are refusing to break down.
AMD is sitting near highs, consolidating in a fairly tight range, and continuing to build higher lows. Price has been finding support around the 10-day and 20-day moving averages, which tells me buyers are still showing up before the stock can pull back too deeply.
When a group gets hit and most names start falling apart, the stocks that hold up near highs are worth paying attention to. They are showing relative strength both within their industry group and against the Nasdaq and S&P.
AMD is still showing strong numbers. Earnings growth is strong, sales growth is strong, and the forward estimates look impressive. That combination of technical strength and fundamental strength is exactly what I want to see.
If the group recovers and the Nasdaq and S&P break out of this consolidating range, AMD could be primed for a nice move higher.
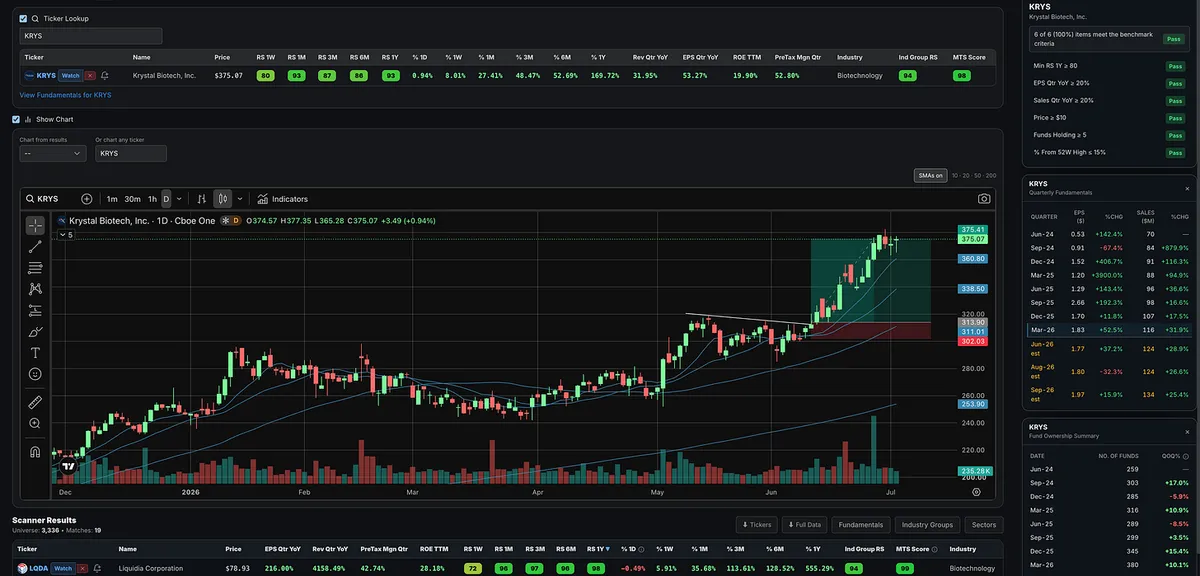
One of the Most Underrated Parts of MTS
A Substack member brought KRYS to my attention, and to everyone in the group chat, back in May after the earnings catalyst.
This is exactly the type of stock we are trying to find.
Big earnings and sales growth. Strong relative strength. Fund ownership increasing. 19.9% ROE. 52.8% margins.
He also caught what turned out to be a leading industry group earlier than most. That’s important because the best stocks usually come from the best groups.
This is one of the most underrated parts of Momentum Trading Strategy.
It is not just the course, the stock screener, or the market analysis. It is also having like-minded traders sharing quality ideas in a professional way.
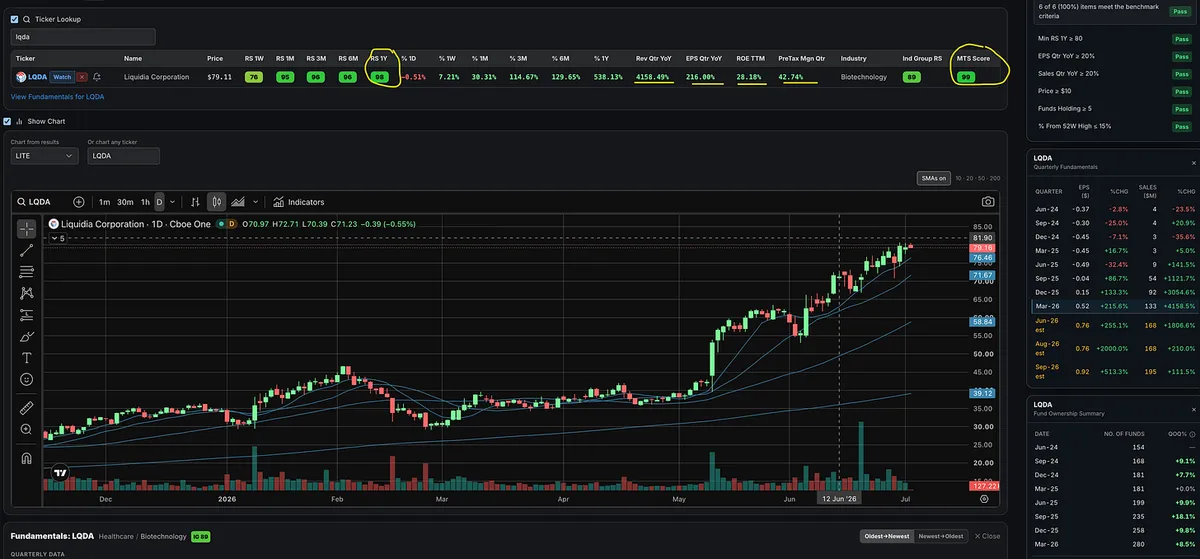
LQDA: This Is What a Real Earnings Catalyst Looks Like
LQDA has had a strong run since the May 11 earnings catalyst.
High relative strength, MTS Score at 99, strong industry group ranking, and major acceleration in earnings, sales, and profitability.
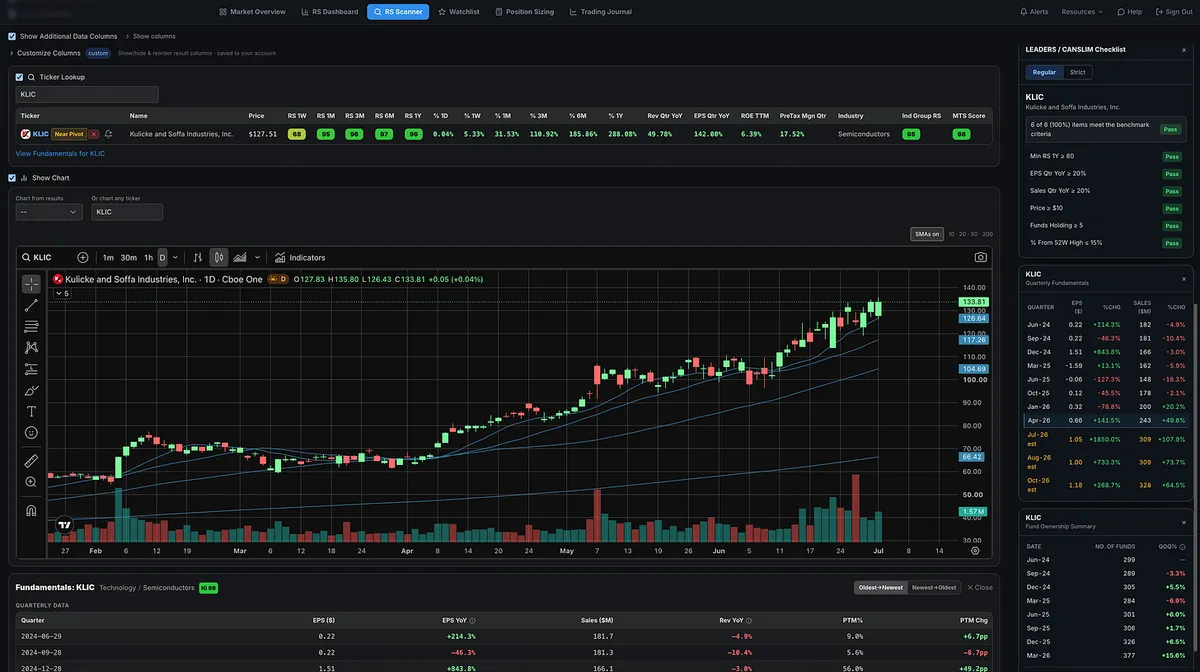
KLIC continues to stand out.
Strong relative strength, and MTS Score at 98.
Growth fundamentals are also accelerating, with big EPS and sales growth showing up in the recent and forward estimates.
Fund ownership is accelerating too.
The Screen Behind Today’s Breakout List
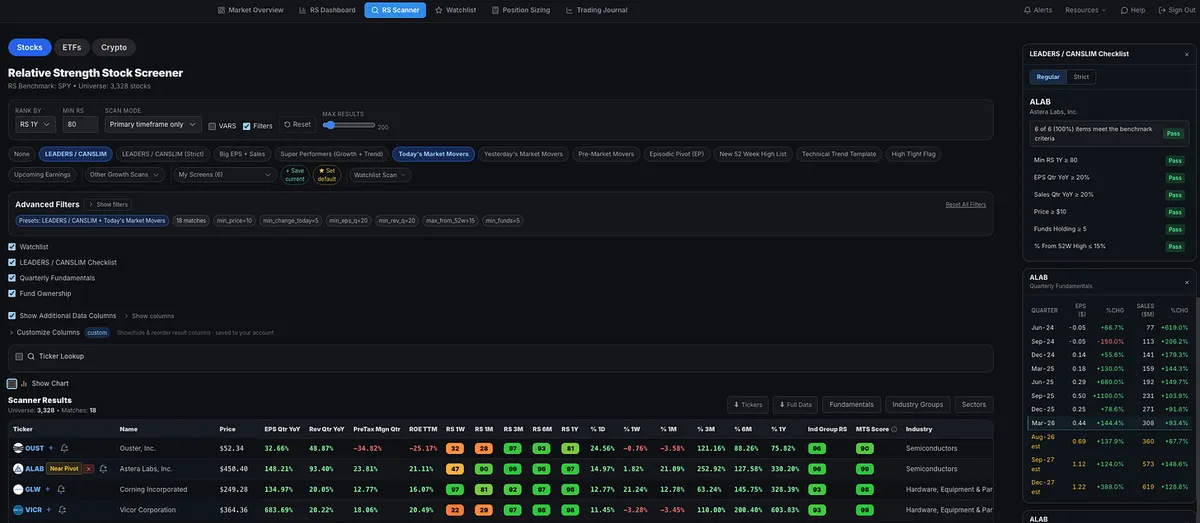
One of my favorite ways to use the Relative Strength Stock Screener is starting with the Leaders / CANSLIM preset, then layering Today’s Market Movers on top of it.
That combo has been surfacing a lot of names I like today.
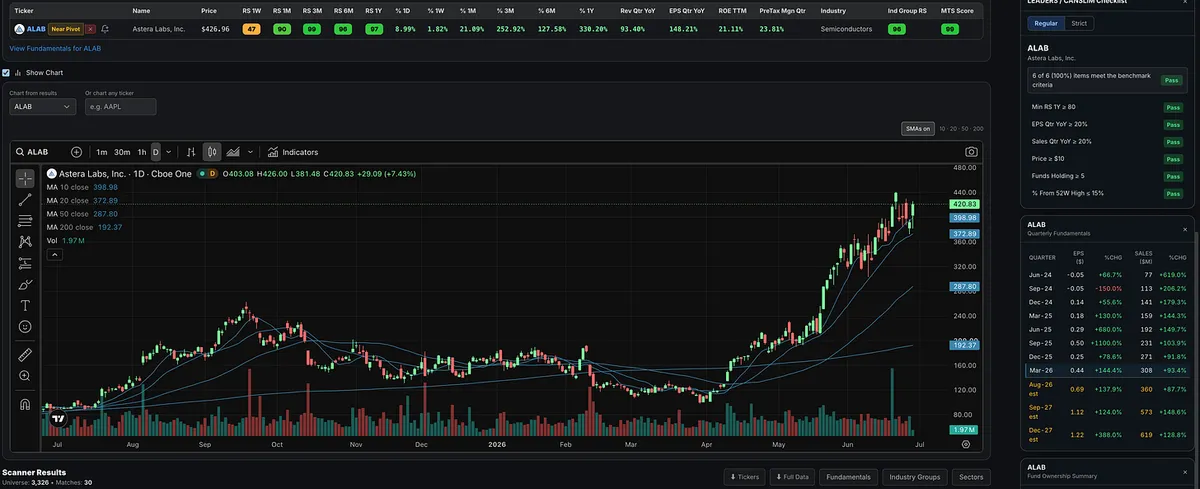
ALAB is breaking out to new highs.
LRCX is breaking out to new highs as I write this.
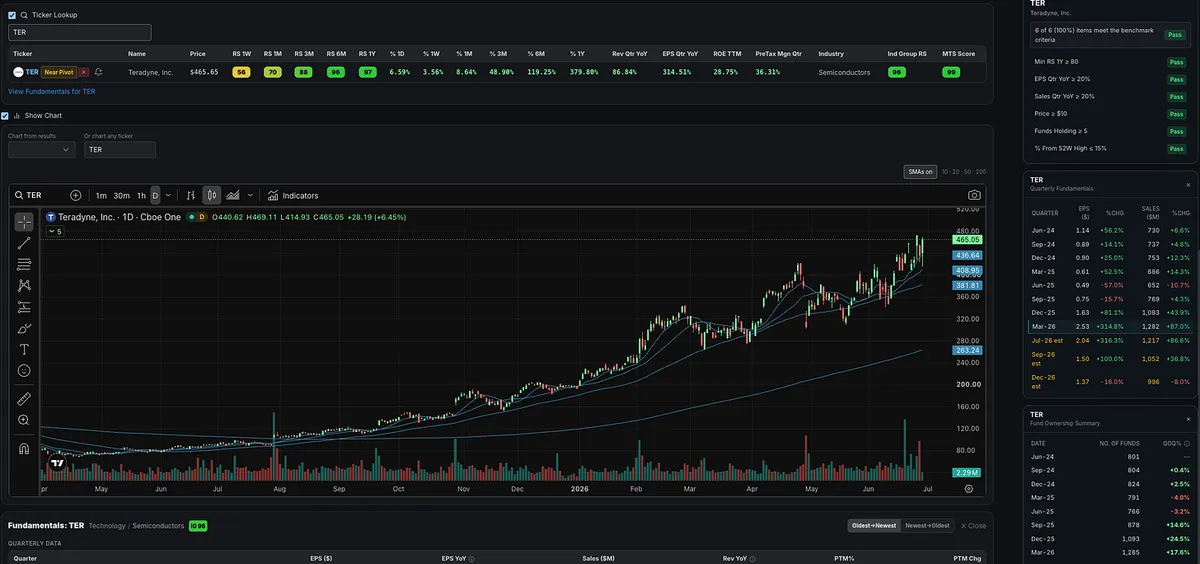
TER is right near new highs.
This is why I like combining leadership filters with current-day strength. It helps narrow the market down to the names that already have strong characteristics and are actually moving right now.
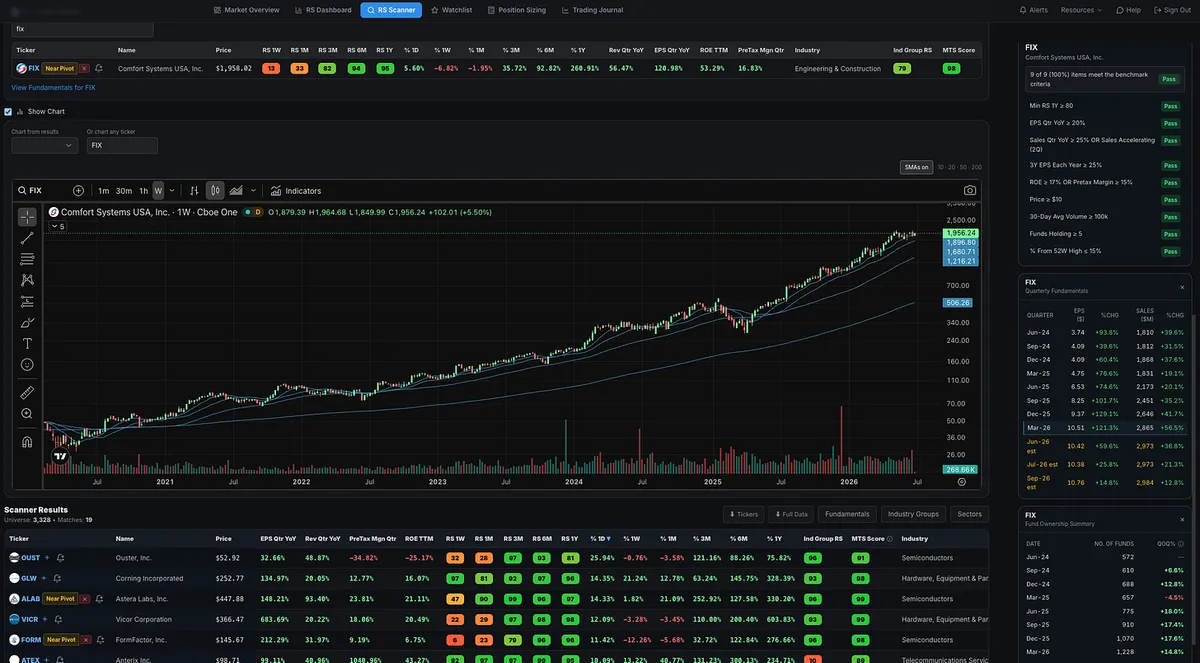
Can’t Stop, Won’t Stop: FIX
Comfort Systems USA (FIX) continues to refuse to end its trend.
Every time the stock looks like it may finally need a deeper reset, buyers show up. It has repeatedly found support around key moving averages, including the 10-week and 50-day area, and continues to hold near highs after a massive multi-year advance.
This is what real leadership often looks like. Strong stocks do not always give easy pullbacks. They ride the short-term moving averages, shake out weak hands, and keep pressing higher while traders wait for a better entry that never comes.
The fundamentals still support the move. FIX continues to show strong earnings growth, strong sales growth, high ROE, and a 98 MTS Score.
At some point, every trend ends.
But until price actually breaks, the message is simple:
The trend is still alive.
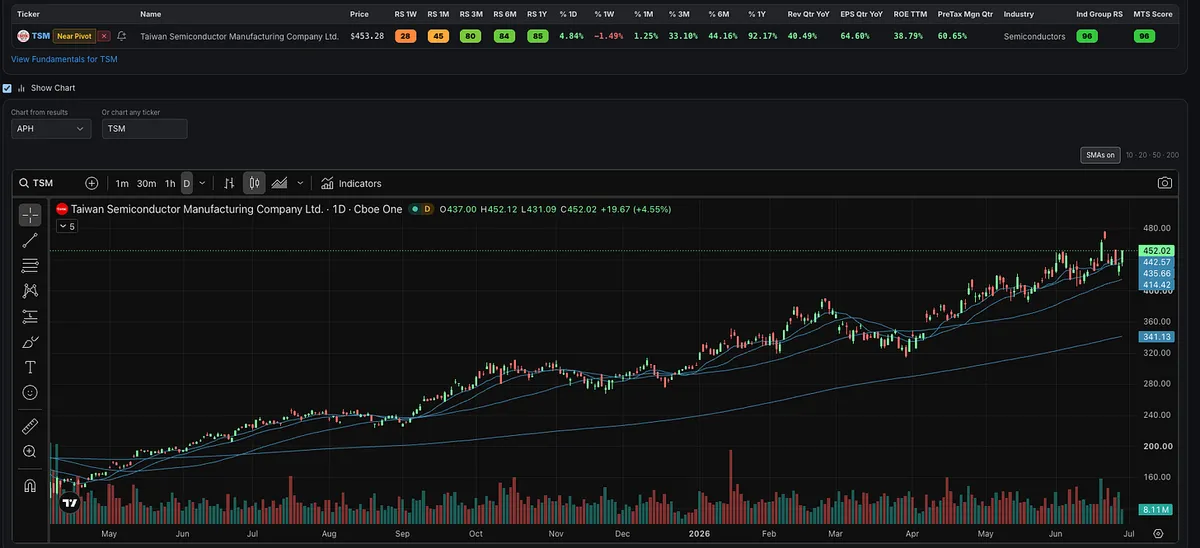
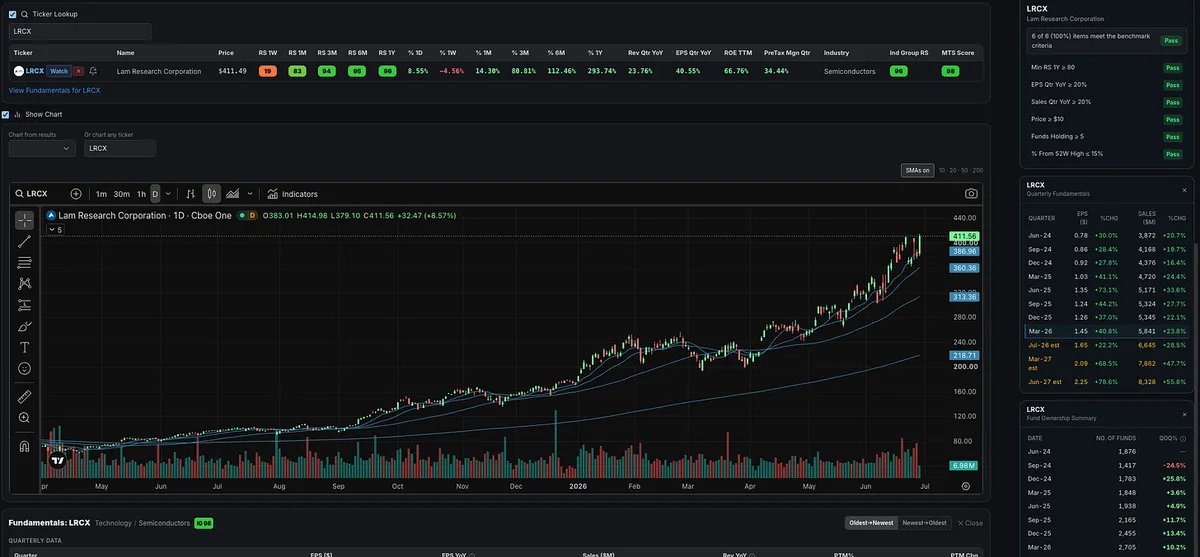
Not All Semis Are Breaking Down
Semiconductors have weakened, but leadership has not disappeared.
A few names are still bucking the trend.
TER, TSM, and LRCX are all acting well, with each either near new highs or breaking out toward new highs today.
Right now, TER, TSM, and LRCX are still showing strength.
Is APH Setting Up for Another Run?
Amphenol (APH) has already been a big winner.
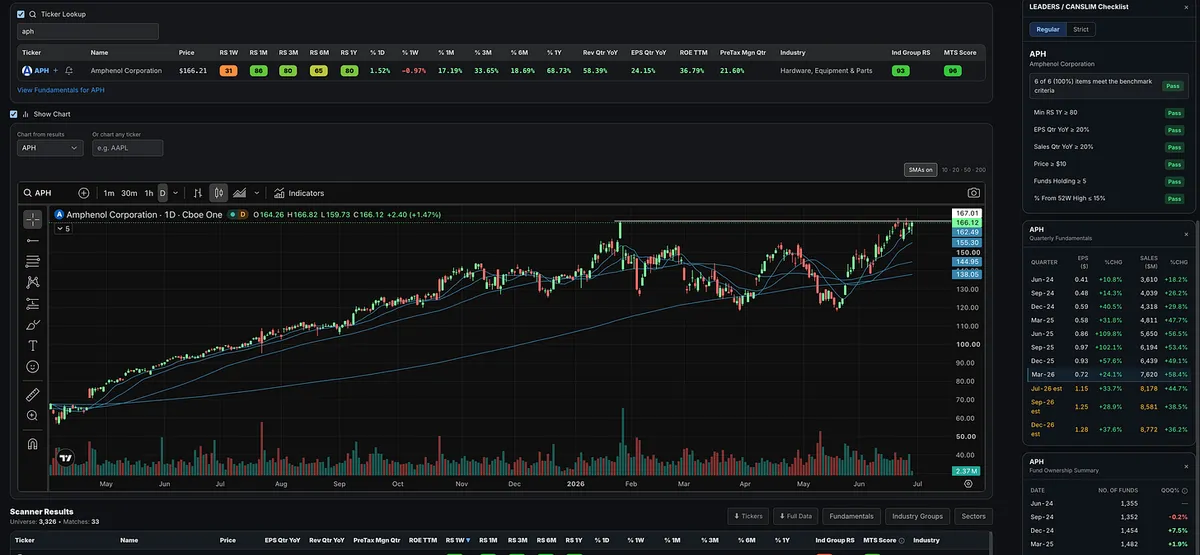
It was strong in 2023, followed through in 2024, and continued higher through 2025. Since setting its high in early 2026, the stock has been consolidating and forming what looks similar to a double-bottom type structure.
The fundamentals are still strong.
Earnings growth had started to decelerate, but sales have remained consistently strong. Now estimates suggest EPS growth could begin picking back up while sales strength continues.
APH currently has an RS Rating of 80, which meets the O’Neil leadership threshold. Sales growth is running near 58%, EPS growth is around 24%, ROE is 36%, and pre-tax margins are near 21%. It is also part of the Hardware, Equipment & Parts group, which has been a leading industry group.
Technically, APH is approaching new highs again after rejecting near all-time highs in late June, pulling back to the 10-day line, and now moving back up. That pullback created a higher-low shelf, giving traders a logical area to define risk.
The breakout level is around $167.
A breakout through that area on volume would be ideal. With a stop around $155.50, the setup offers a defined risk area and a potentially attractive risk/reward if buyers step in.
APH may not be the flashiest growth stock in the market, but it has the combination that matters: a long-term winning trend, strong sales, good earnings, high-quality margins, relative strength, and a technical setup near highs.
Nasdaq at the 50‑Day, ALAB Near Highs
The leaders usually show up first.
ALAB is doing something worth paying attention to.
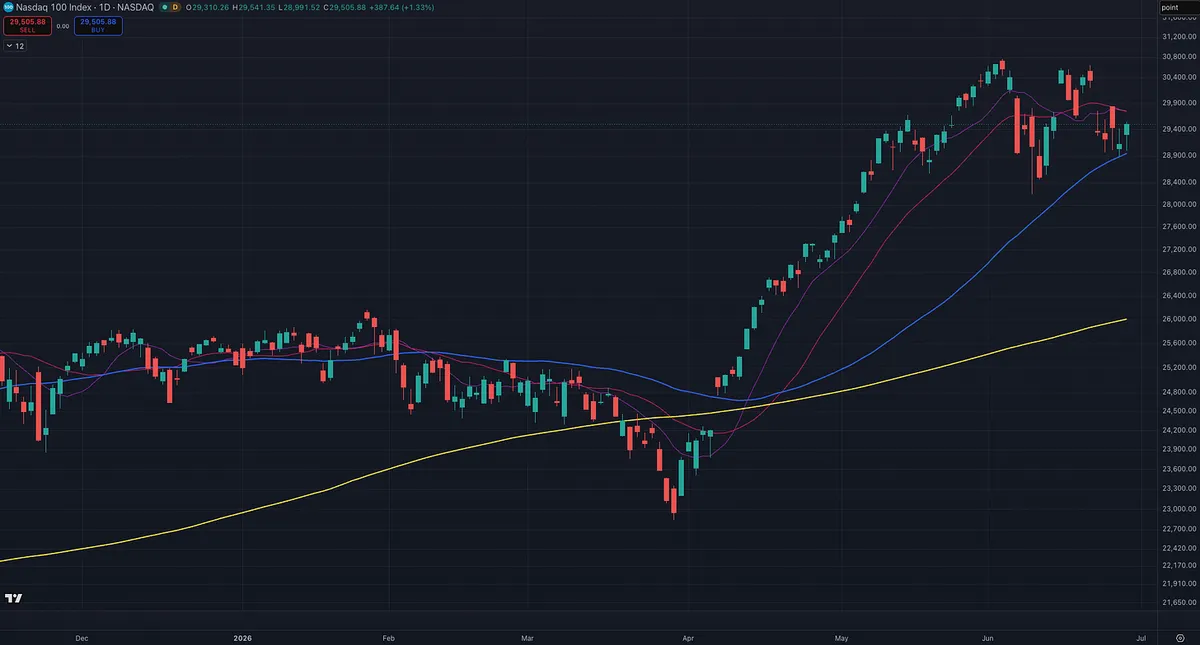
While the Nasdaq 100 has pulled back to its 50‑day moving average and the broader market has been weak, ALAB has continued to act like a true tech growth leader. It is holding near its highs, riding above short term key moving averages, and showing strong relative strength across multiple timeframes. That is not something to ignore if you study leadership and momentum.
William O’Neil put heavy emphasis on leadership, relative strength, earnings power, price action, and overall market direction. Their work shows that the best stocks often reveal themselves before the indexes fully confirm a new leg higher. The strongest stocks tend to correct less, tighten up faster, and move back toward their highs while the averages are still working through supply.
O’Neil described this dynamic clearly when he wrote about powerful stocks that refuse to break down during market weakness. In How to Make Money in Stocks, he noted that a true leader can pull back, build a tight consolidation while the general market makes new lows, and then be one of the first names to break out to new highs when the pressure comes off. In other words, a leading stock that holds up better than the market during a pullback is often giving you a constructive signal, not just random noise.
That is exactly the kind of behavior you want to see from potential big winners. True leaders:
Hold up better than the market during pullbacks.
Recover faster once selling pressure eases.
Push toward or through new highs while the average stock is still trying to find support.
None of this means you blindly chase strength. The overall market still matters, and any entry still has to offer a defined risk/reward with a logical pivot and a clear line in the sand if you are wrong, but this is exactly why tracking leadership and relative strength is so important.
When a stock with strong fundamentals and a powerful price trend keeps acting right while the Nasdaq 100 and S&P 500 is sitting on its 50‑day moving average, it is usually telling you something. Right now, ALAB is showing the kind of leadership that belongs on the radar.
The Biggest Winners Were Already Winning
There is a persistent belief in investing that the biggest winners start out hidden, cheap, and overlooked.
The data tells a different story.
“From the early 1950s through 2008, the average RS Rating of the best performing stocks before their major run ups was 87. In other words, the best stocks were already doing better than nearly 9 out of 10 others when they were starting out on their most explosive advance yet.”
— William O’Neil
What is striking is how little this has changed since 2008. Markets have evolved. Technology has accelerated everything. Information moves instantly. Yet the same pattern holds. The strongest stocks tend to keep getting stronger.
This runs against instinct. Buying strength feels like chasing. Waiting for something to look cheap feels safer and more rational.
But the market does not reward what feels comfortable.
The next big winner will not look like a bargain. It will look like a stock that is already outperforming, already attracting demand, and already separating itself from the crowd.
Most people will wait for a pullback that never comes.
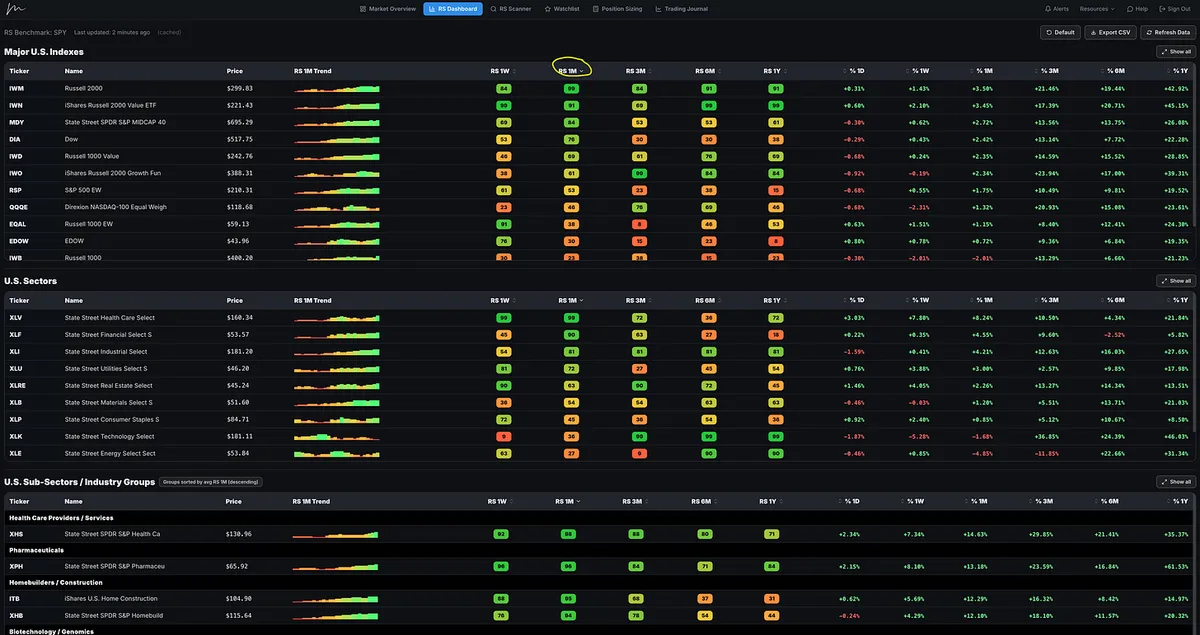
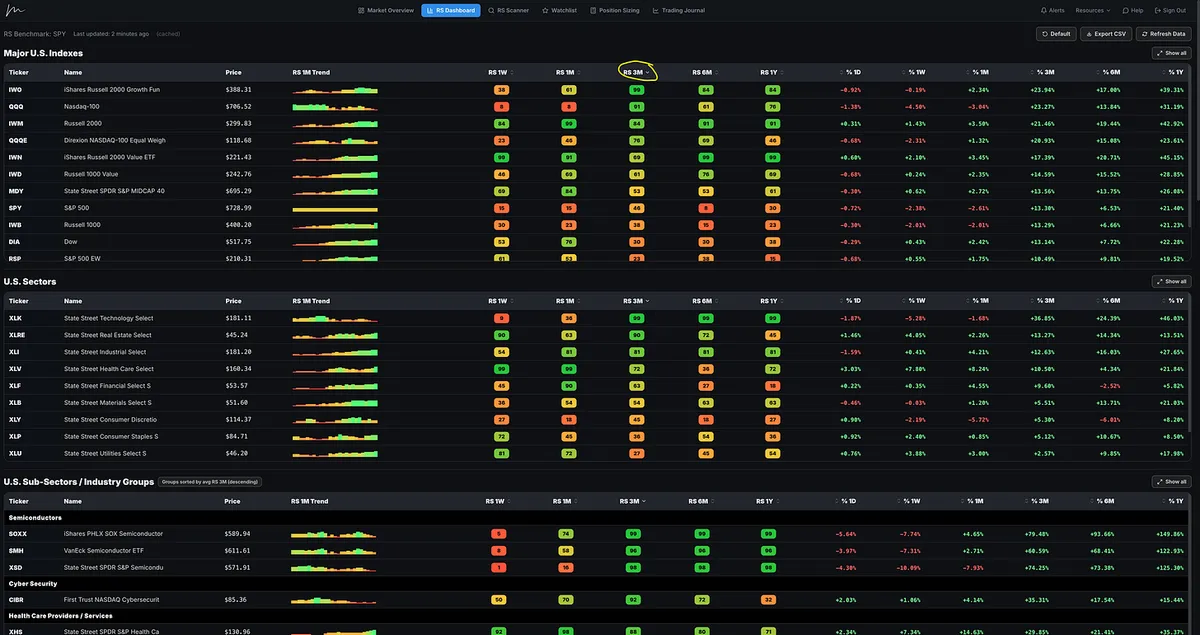
Big Shift in Relative Strength
Big change in relative strength over the last few weeks.
For weeks/months, the clear leadership across the major indexes has been the Nasdaq 100, Nasdaq 100 equal weight, Russell 2000 growth, and IWM.
Sector leadership has also been obvious: XLK technology has dominated, with semiconductors leading this Stage 2 uptrend since the March 30th lows. That strength has been followed by other tech-related groups like computer hardware, electrical equipment, software, and other growth areas.
But this week, the shift is much clearer.
Now the leadership is coming from:
• IWM, Russell 2000
• IWN, Russell 2000 Value
• MDY, S&P 400 Mid Caps
• DIA, Dow Jones
On the sector side, XLV healthcare is leading, followed by financials, industrials, and utilities.
Under the surface, the strength is showing up in healthcare providers, pharmaceuticals, homebuilders, biotech, insurance, and banks.
This has been building for a few weeks, but this week is the clearest rotation we’ve seen.
Make sure to dive into the next Big Picture Market Pulse before the market opens Monday.
It should be out soon.
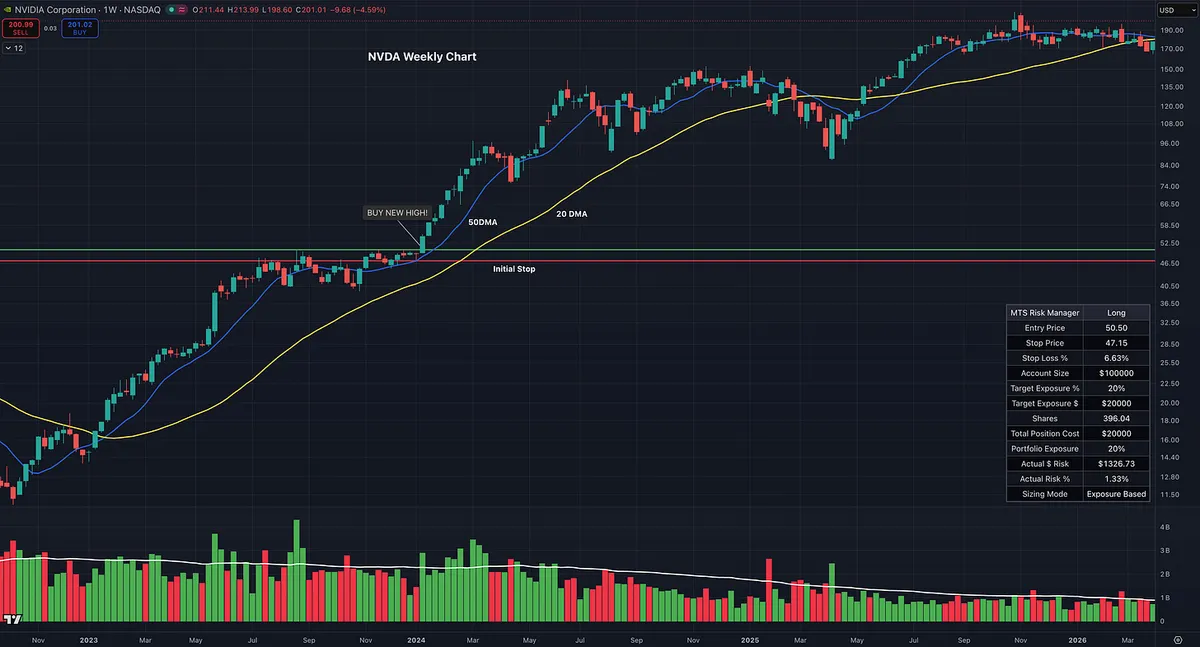
The New Highs Everyone Is Afraid to Buy
Most investors are trained to look for bargains.
But the greatest growth stocks often begin their biggest moves near new highs, not cheap-looking lows.
That does not mean chasing anything that is up.
It means learning when strength is evidence of leadership.
New post below.
https://tradingmomentum.substack.com/p/the-stock-looks-too-high-that-might
Most Investors Miss Great Stocks for This Reason
A stock can be high and still be early.
That one idea is hard for most investors to accept.
They see a stock breaking into new highs and immediately think:
“It’s already up too much.”
But many of the biggest winners in history looked “too high” before they went much higher.
The real skill is learning the difference between a stock that is extended and a stock that is emerging as a true leader.
The Stock Market’s “Great Paradox”: The Answer
For all the growth stock investors and momentum traders, the answer is:
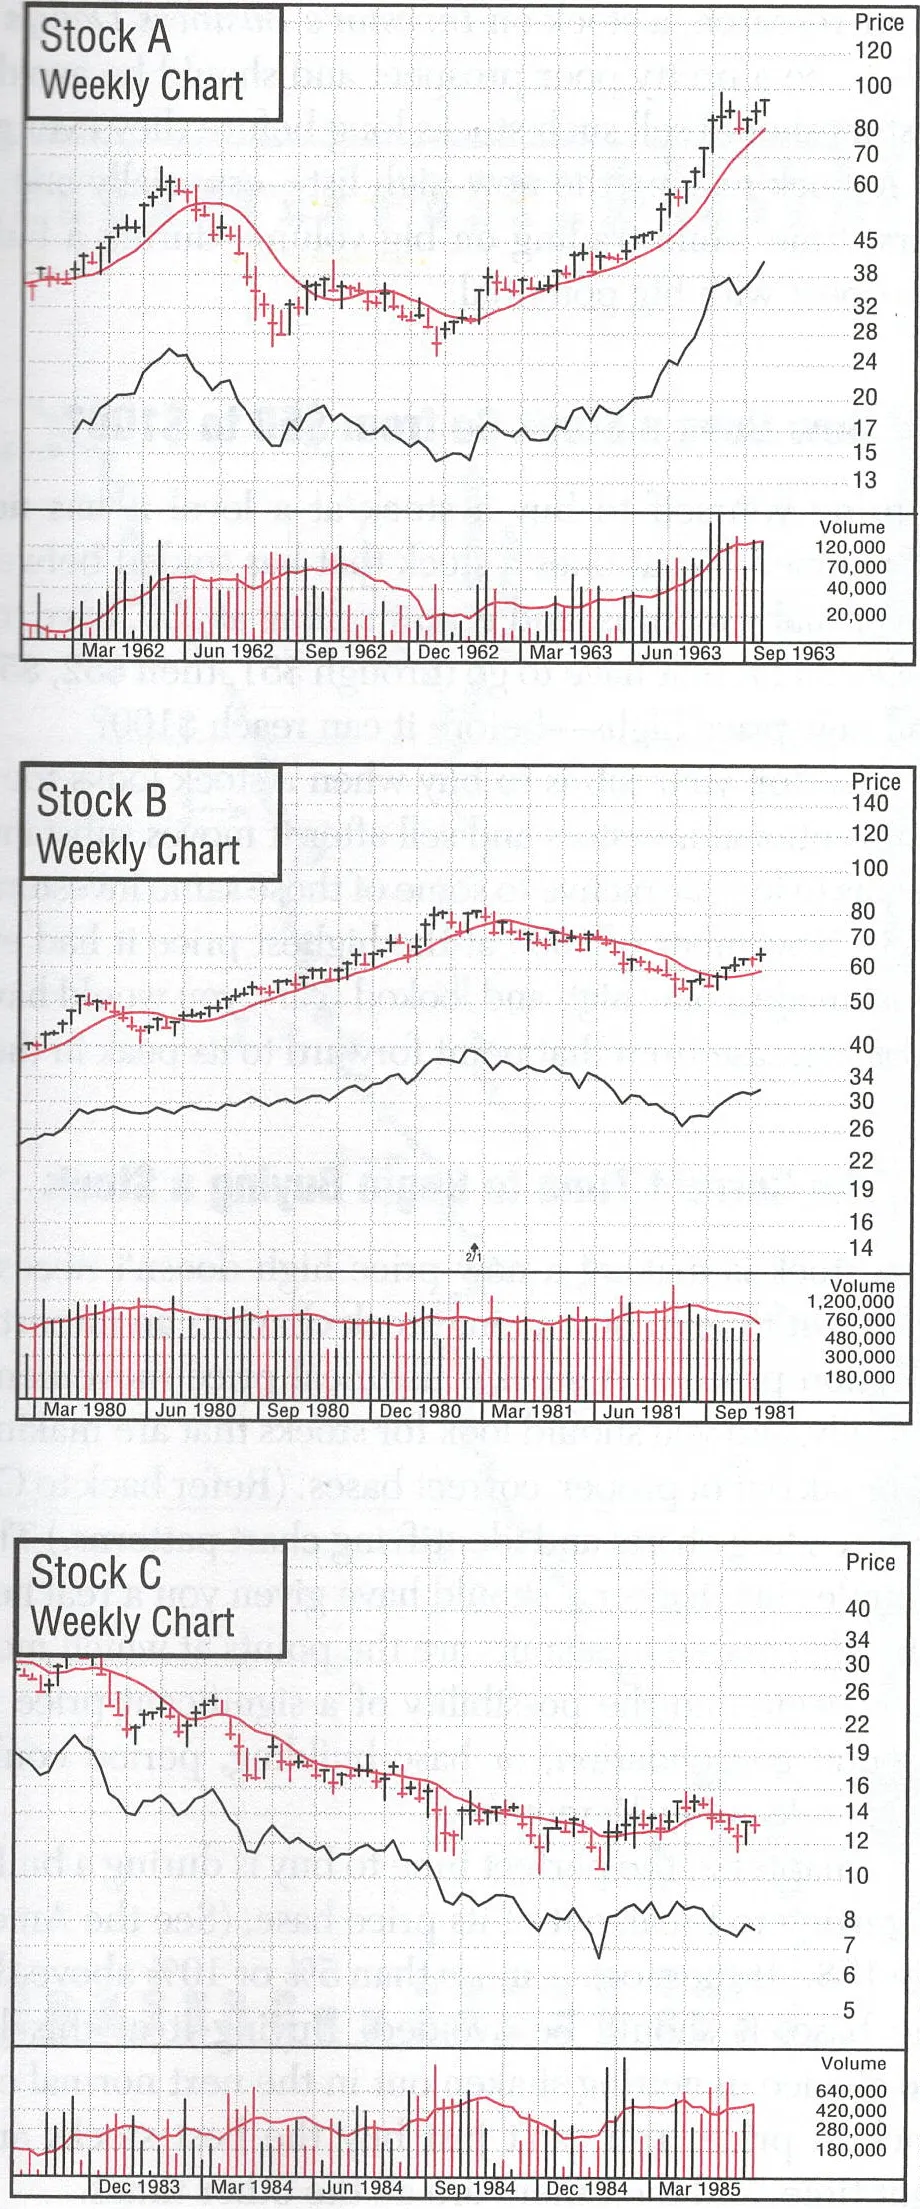
Stock A.
And here’s why.
If you didn’t pick A, don’t feel bad.
Most of us probably would not have picked A when we first started either.
That is part of what makes the market so difficult.
A lot of what feels safe is actually dangerous.
And a lot of what feels risky is often where the real opportunity is.
Most people are naturally uncomfortable buying stocks near new price highs.
William O’Neil saw this over and over again.
He explained that many individual investors who attended his seminars felt uncomfortable buying stocks making new highs, and it was not just retail investors. He found that even many institutional investors had the same problem.
Why?
Because most people think it is safer to buy something that looks cheap.
They see a stock that is down and think:
“It’s already fallen so much. How much lower can it really go?”
But O’Neil’s study of the greatest stock market winners proved the opposite.
The old saying “buy low and sell high” sounds smart, but for growth stock investing and momentum trading, it is often completely backwards.
O’Neil said:
“What seems too high in price and risky to the majority usually goes higher eventually, and what seems low and cheap usually goes lower.”
That is the great paradox.
The stocks that look extended, expensive, or “too high” to most people are often the same stocks under heavy institutional accumulation.
The stocks that look cheap, beaten down, and like “good deals” are often cheap for a reason.
O’Neil also studied stocks making new highs versus stocks making new lows across many different bull market periods.
The conclusion was clear:
Stocks on the new high list tended to continue higher.
Stocks on the new low list tended to continue lower.
And this was not just something O’Neil preached.
Jesse Livermore figured this out decades earlier.
Nicolas Darvas found the same thing with his box method.
Jack Dreyfus, one of the best-performing mutual fund managers of the 1950s and 1960s, was also buying stocks making new highs. O’Neil studied Dreyfus and found the same lesson again:
The biggest winners were usually not hiding in the bargain bin.
They were showing strength.
Mark Minervini, David Ryan, Dan Zanger, Kristjan Kullamägi all understand this and the importance of focusing on stocks that look like Stock A.
Strength is not something to fear.
For this style of trading, strength is usually where you want to be looking.
If you didn’t pick Stock A, it may just be a signal that there is more work to do.
This weekend, read a chapter or two of William O’Neil’s How to Make Money in Stocks.
Or maybe you discover that growth stock investing and momentum trading does not fit your personality.
And that is okay too.
But I think the first option is much more likely.
Most of us felt uncomfortable with this style at first.
Many of us only came to it after failing with other strategies that felt easier, safer, or more logical.
But the market does not reward what feels comfortable.
It rewards what works.
Have a great weekend.
The Stock Market’s “Great Paradox”
William O’Neil talked about what he called one of the stock market’s great paradoxes.
Before explaining it, he showed three charts and asked a simple question:
Which stock would you buy?
Stock A?
Stock B?
Stock C?
I’ll follow up with O’Neil’s answer, which I completely agree with.
But before I do, be honest:
Which one would you buy?