Momentum Trading Strategy

Notes

Finding Leading Stocks

What to buy: how to find, screen and rank the strongest stocks and industry groups.

Showing 121–140 of 299 notes

View on Substack ↗

The Simplest Screen Most Traders Ignore

One simple screen you can run daily and every weekend:

The New Highs List.

Look at what stocks are making new price highs.

That may sound basic, but this is how many of the greatest growth stock investors and momentum traders have found big winners for decades.

A lot of people forget this part of CANSLIM too.

The N does not just stand for new products or new services.

It also includes:

New price highs.

Remember, the strongest stocks often look “too high” before they go much higher.

View on Substack ↗

Why Waste Time on B+ Stocks When A+ Stocks Exist?

This is the type of screen I care about most.

  • Strong sales.

  • Strong earnings.

  • Strong margins and/or ROE.

  • Top-tier relative strength.

  • A leading industry group.

  • Funds increasing quarter after quarter.

  • And most importantly, price confirming with higher highs and higher lows.

That is an A+ growth stock profile.

This is not some new idea either.

This is what O’Neil taught. It is what Minervini looks for. It is what David Ryan studied. It is what Dan Zanger used.

The details may vary from trader to trader, but the foundation is very similar.

Remember, institutions drive major sustained moves. Retail does not.

When I see rising sales, rising earnings, good margins and/or ROE, and funds increasing quarter over quarter, I know the stock has the ingredients of a potential major growth leader.

Then price has to confirm it.

Plenty of names have strong fundamentals, but price is saying NO.

Plenty of names have price moving higher, but without the sales, earnings, margins, ROE, or institutional support behind it, the move is less likely to last. Think CAR in April 2026.

And yes, this is an ideal screen.

Most of the time, you will not get every single ingredient. That is okay.

Sometimes I trade stocks with big sales and earnings growth, but margins or ROE are not great yet. Sometimes fund ownership is flat instead of rising. Those stocks can still work.

But I know they are NOT as high quality as a stock that has everything lining up at once.

So if there are big liquid names showing all the characteristics, why waste time forcing trades in lower-quality stocks?

When the fundamentals are strong, funds are building positions, the group is acting well, and price is confirming, that is where I want my focus.

View on Substack ↗

Stop Waiting for Someone to Hand You the Next Big Winner

If you are struggling to find the big winning stocks, you do not need to wait around for me or anyone else to tell you the names.

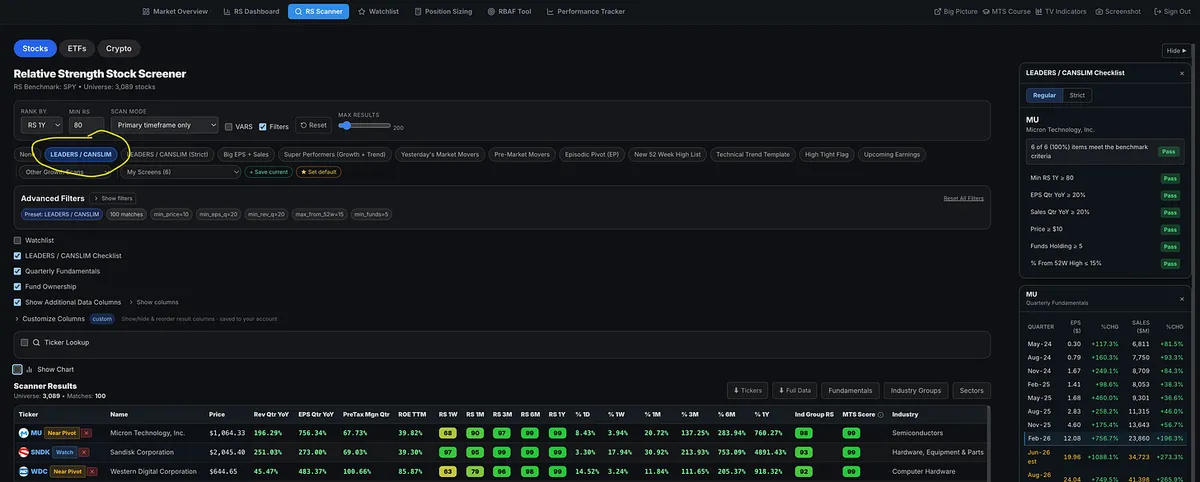
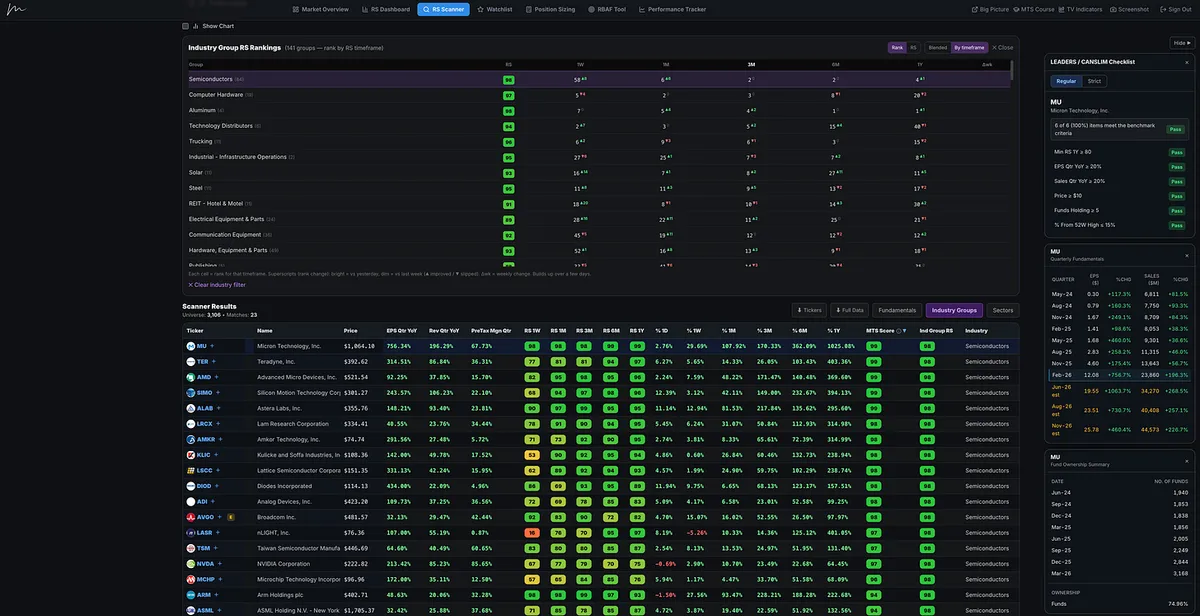
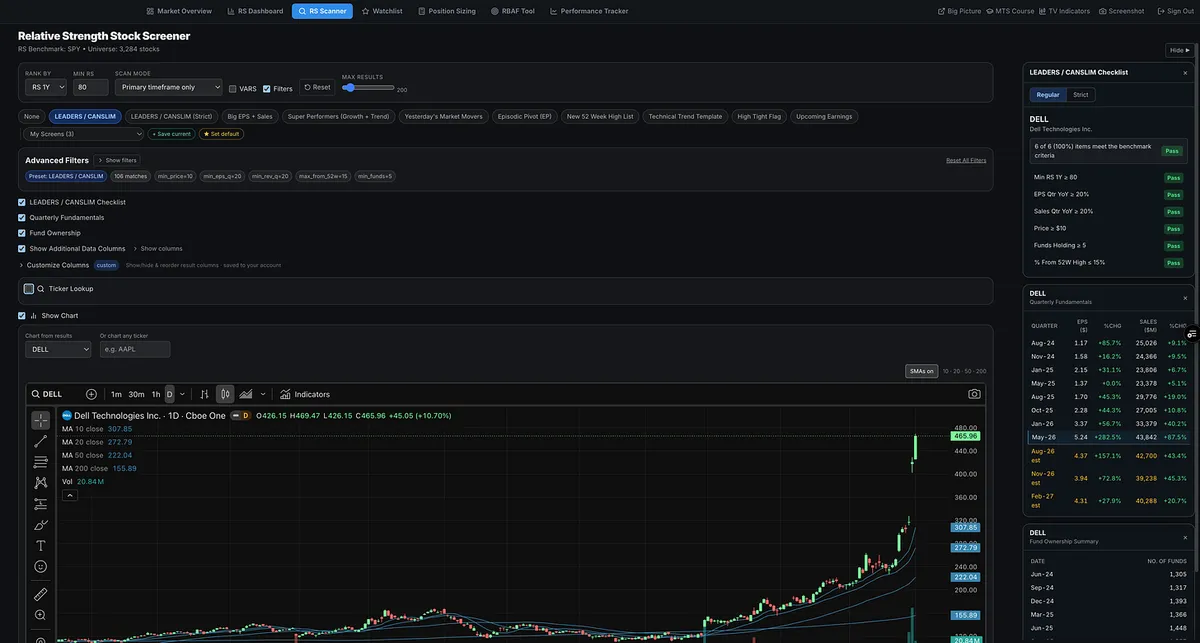
Open the Relative Strength Stock Screener and click the Leader / CANSLIM preset stock screen.

You will immediately see many of the market’s strongest names near the top of the list.

As you scroll through the list, some names will be extended. Those go on your watchlist so you can wait for the next proper pullback or setup.

Some will be near pivot points.

Some will already be actionable.

That is the entire point of the screener.

It is not there to overwhelm you with tickers. It is there to help you quickly identify where the real leadership is.

This is the same exact process I have used to find and share many of the biggest winners since January.

Names like:

SNDK

MU

AAOI

AXTI

DELL

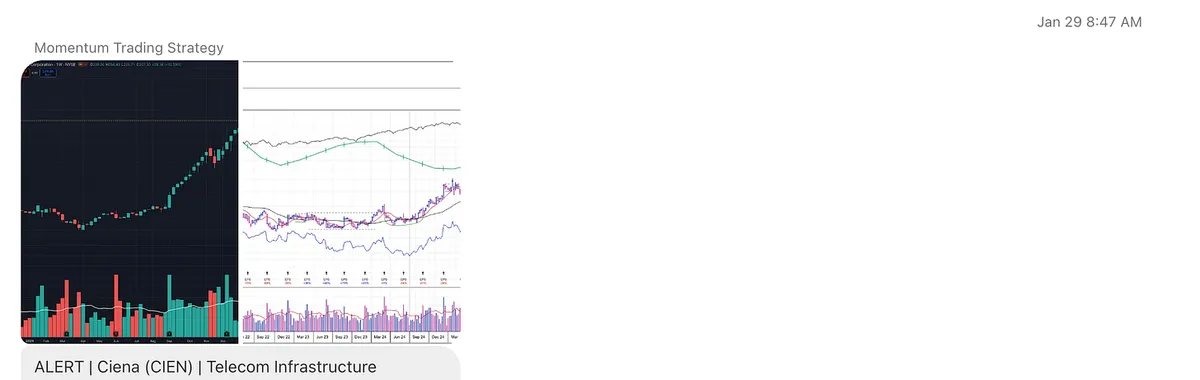
CIEN

LITE

WDC

STX

SIMO

and many more!

Your job is to build the habit of checking the list, following the leaders, managing risk, and being ready when the setup appears.

Everything you need to learn the process is inside the Momentum Trading Strategy Course. I also provide a list of books that teach many of the same timeless principles.

Learn the process.

Use the tools.

Trust yourself.

You can do this.

View on Substack ↗

Most Traders Miss This Part of CAN SLIM

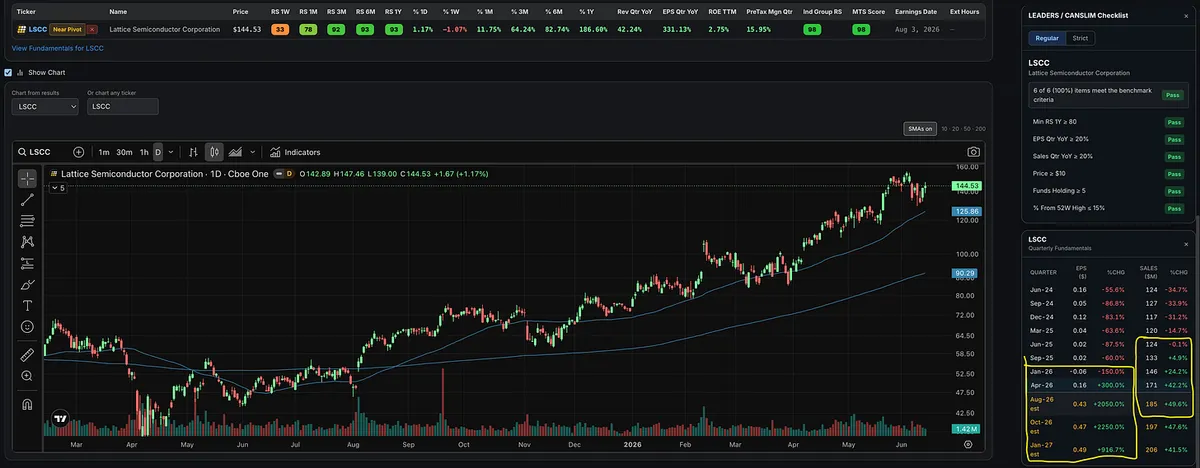
This is what acceleration looks like.

One thing I teach inside the Momentum Trading Strategy Course is that it is not just about finding stocks with big earnings and big sales.

It is also about spotting the turnaround and the acceleration.

That is exactly what you can see here with LSCC.

Sales went from negative year-over-year quarterly growth…

To positive…

To accelerating.

And as sales improved, earnings started to improve too.

Now the forward estimates are showing a major ramp.

LSCC is not just showing strong relative strength.

It is also showing the type of fundamental acceleration that growth stock traders should be paying attention to.

This is not something I made up.

William O’Neil talked about this.

Mark Minervini and David Ryan have talked about this.

The best growth traders are not only looking for big numbers.

They are looking for whether the numbers are getting better or getting worse.

A stock with decelerating growth can look great on the surface, but the market may already be moving past it.

A stock going from negative growth, to positive growth, to accelerating growth can be the start of a major institutional re-rating.

That is what I like about LSCC here.

  • Strong price action.

  • Strong relative strength.

  • Improving sales.

  • Improving earnings.

  • Big forward estimates.

That is the kind of combination I want on my radar.

View on Substack ↗

Everyone Wants the Next SNDK. That’s Why They Missed This One.

Most traders do not need more tickers. They need to learn how to recognize a real leader, manage risk, and stay with it until the evidence changes.

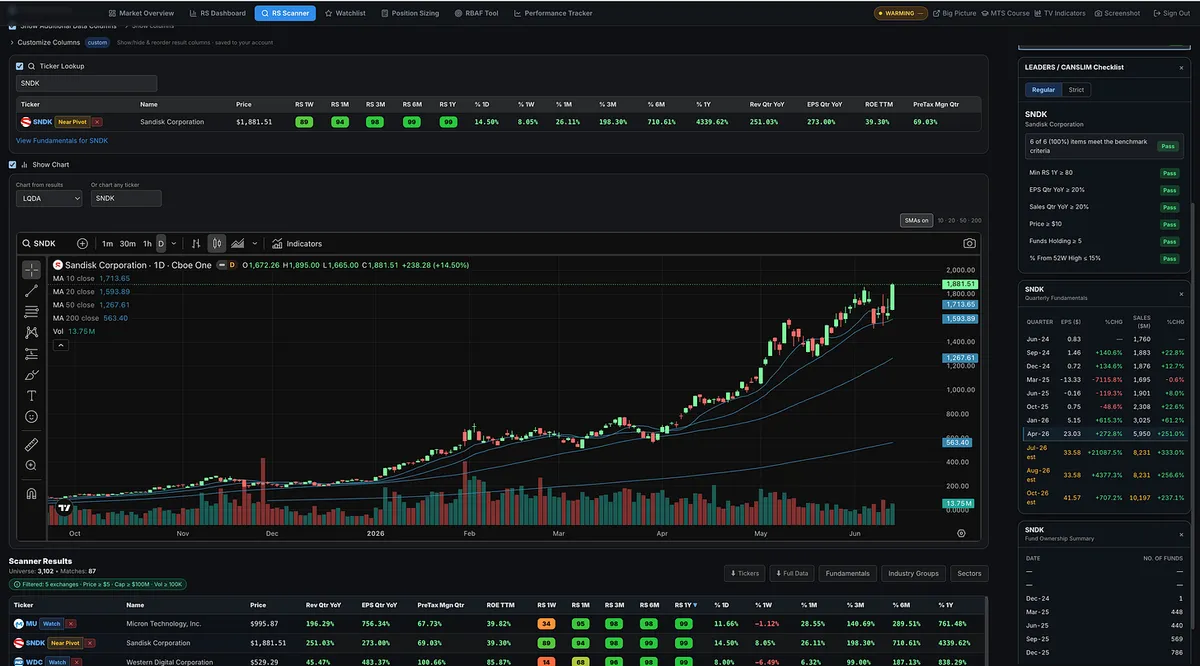
I shared SNDK back on January 22nd, and I’ve continued posting about it both publicly and inside the paid subscriber chat.

Yet I still get asked the same thing:

“What’s the next one?”

That is usually the sign of a beginning trader.

When you find a true market leader, the goal is not to immediately abandon it and go hunt for something else. The goal is to ride the move until the evidence changes.

That does not always mean you buy once and hold one full position forever.

  • You can trade around it.

  • You can sell some and hold some.

  • You can get stopped out and re-enter on a new setup.

  • You can even sell all of it and buy it back later when the stock gives you another proper entry.

But in a bull market, it is usually the same small group of names that drive most of the real performance.

Most people lose patience every time a leader pulls back, rests, or gets quiet.

Instead of waiting for the next proper entry in the strongest names, they start chasing random tickers that have not proven anything.

Meanwhile, the real leaders keep leading.

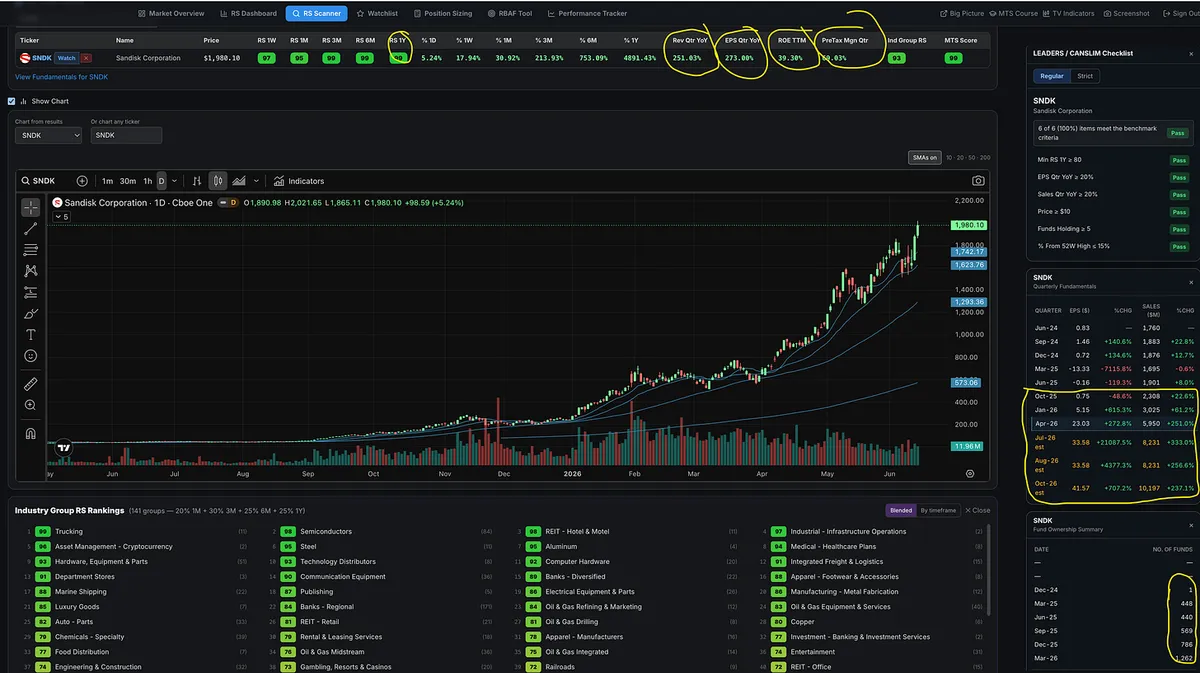
Look at SNDK.

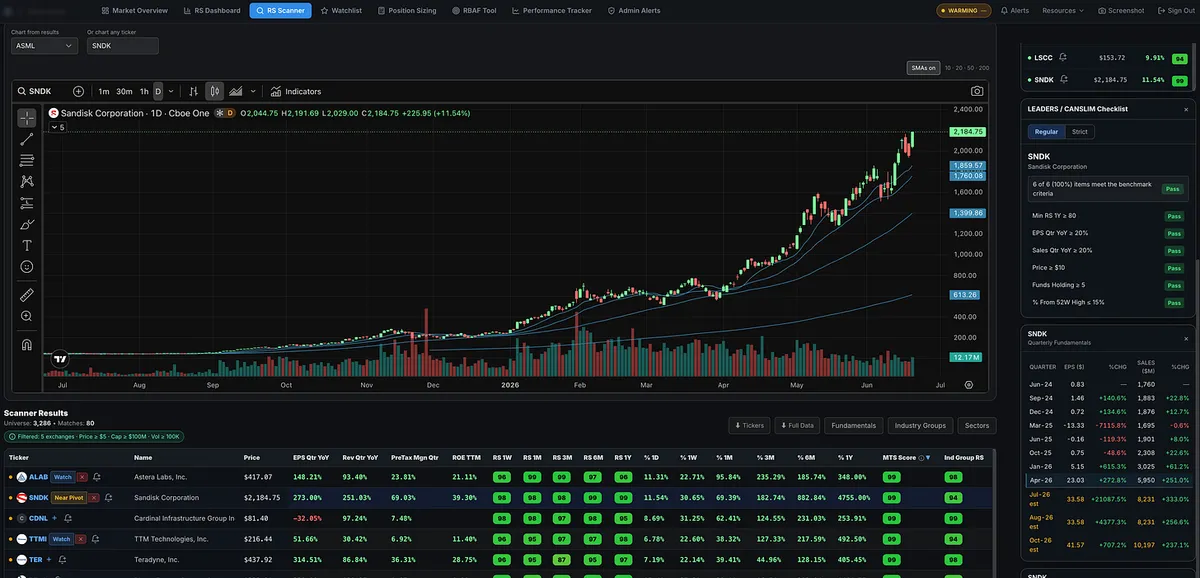
Price action has been screaming leadership. Relative strength across multiple timeframes is among the best in the market. The industry group is strong. Earnings are accelerating. Estimates are accelerating. Sales are accelerating too, which tells you this is not just a cost-cutting story.

There is real fuel behind the growth.

Funds are accumulating.

Return on equity is strong.

Pre-tax margins are strong.

The stock is tied directly into one of the biggest themes in the market: AI infrastructure and data demand.

So at some point you have to ask:

What else are you looking for?

This is CAN SLIM growth stock in real time.

And for the people who say they do not care about fundamentals, that is fine too.

It is not a coincidence that SNDK has also been showing up as a strong trend name for systematic trend followers.

Ed Seykota has had it listed on his Strong List.

One of the greatest systematic trend followers of all time is seeing the same thing CANSLIM growth stock traders are seeing.

Different methods.

Same conclusion.

Leadership.

When all of these things are lining up, the job is not to keep begging for new tickers.

The job is to recognize leadership, manage risk, and stay with the name until the evidence changes.

That is where the big money is usually made.

View on Substack ↗

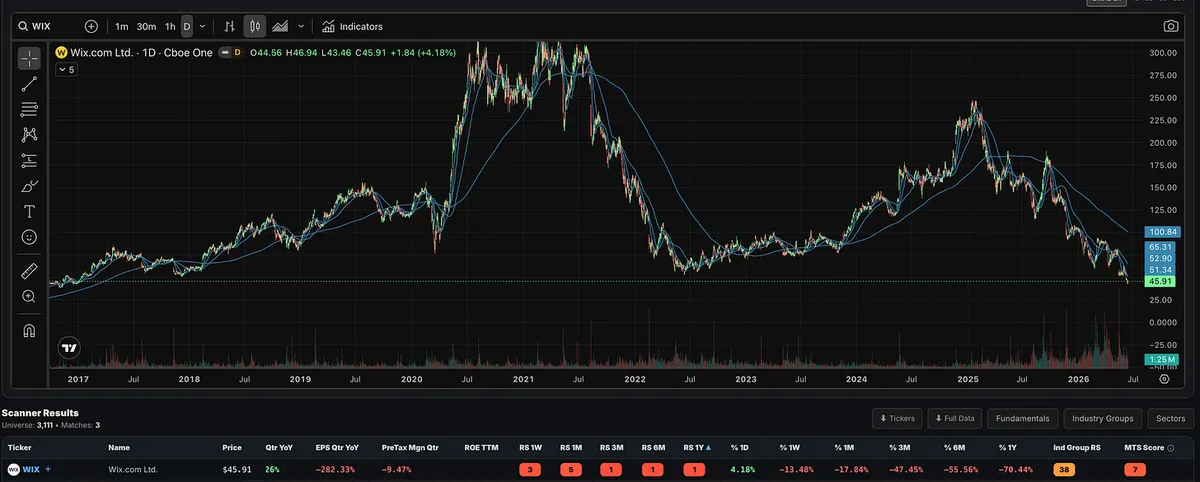
Anyone going long WIX?

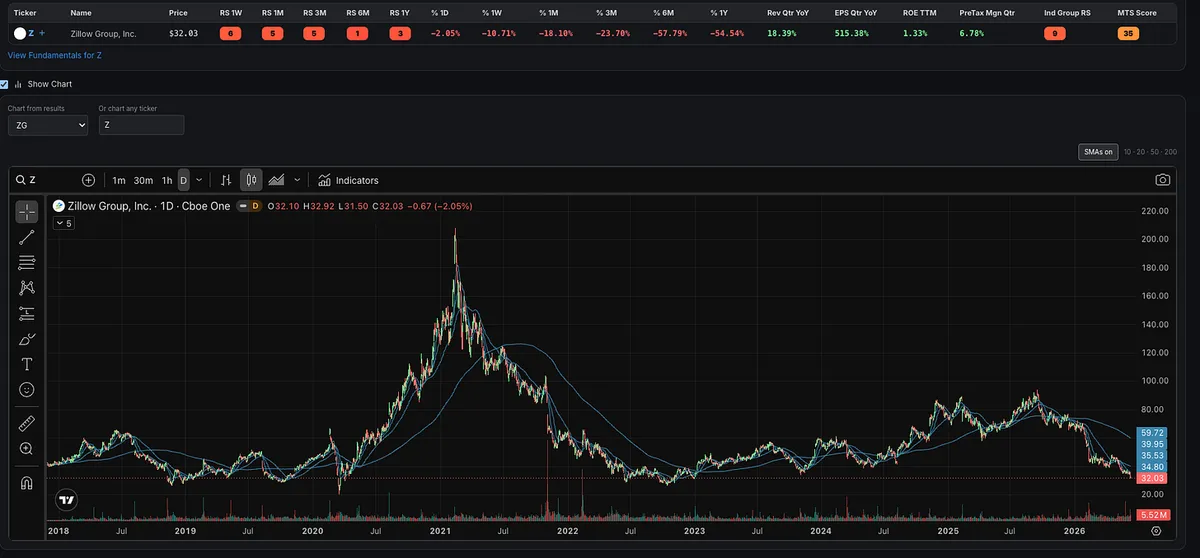
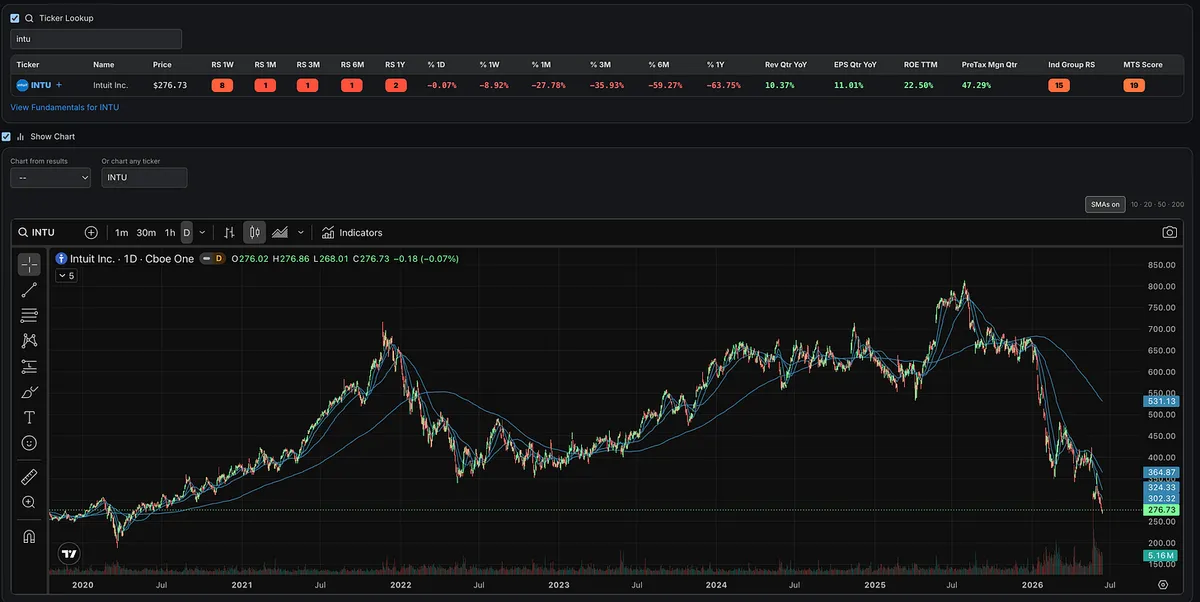
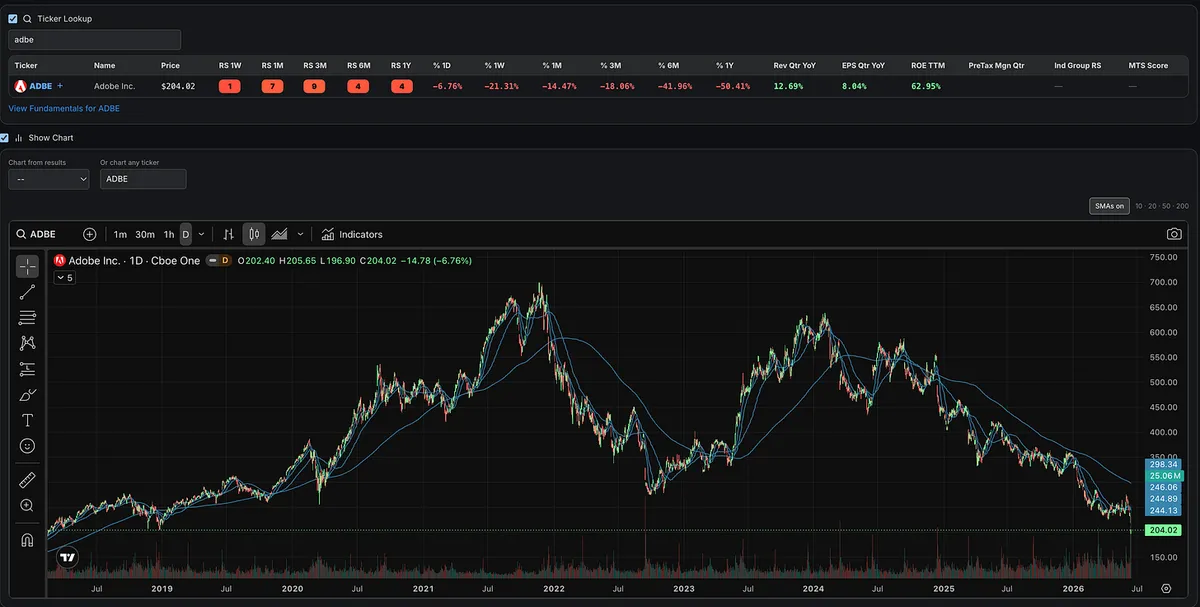
It’s wild to pull up some of the old 2020–2021 favorites and see where they are now.

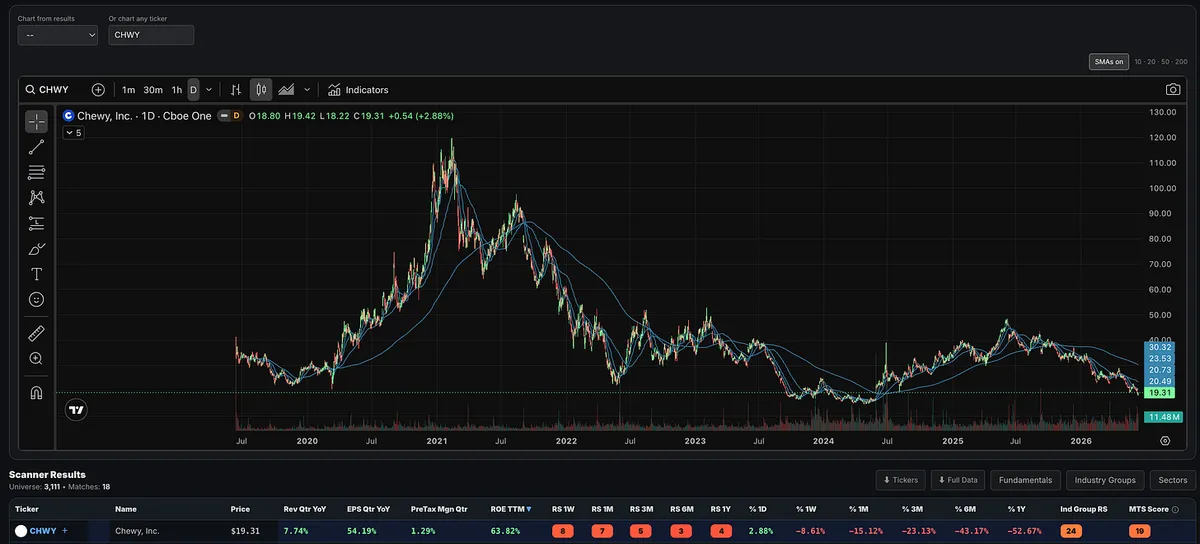
CHWY

ADBE

INTU

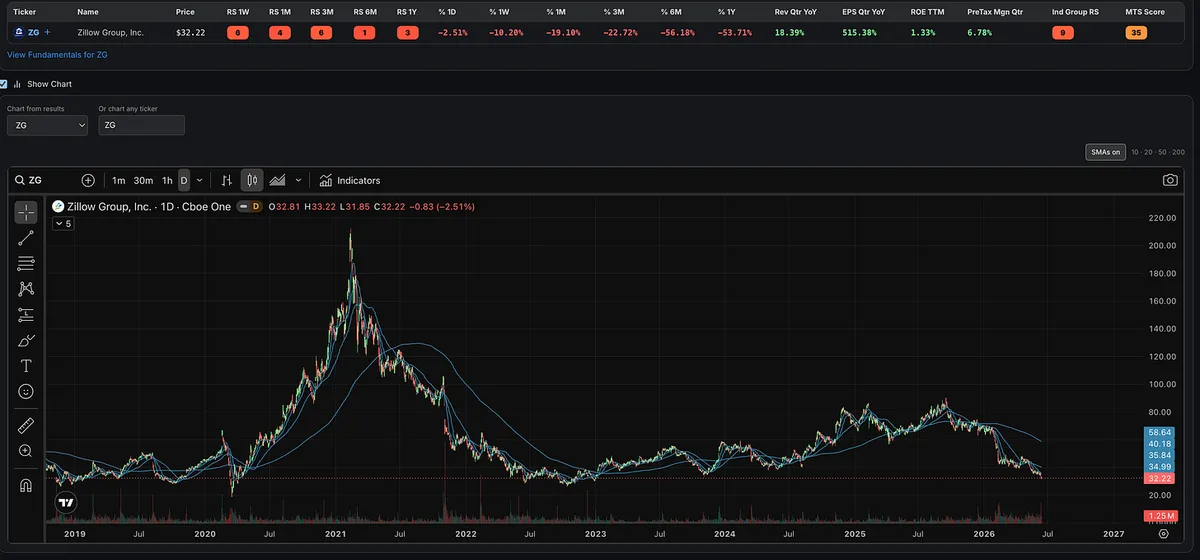
Z

WIX

Feels like yesterday these were the “must-own” growth names everyone was chasing.

Good reminder: old leaders are not always new leaders. Most of the time, they aren’t.

A stock can still be a great company. It can have a familiar story. It can have a past run that everyone remembers.

But if the price action, relative strength, and trend are broken, nostalgia is not a setup.

The market always rotates. Our job is not to fall in love with yesterday’s winners. It’s to find what is leading now.

View on Substack ↗

SNDK Is Showing the Kind of Relative Strength Marty Schwartz Looked For

SNDK is doing something serious traders pay attention to.

It is making new highs while the broader market is not.

This is the type of relative strength Marty Schwartz looked for. Stocks that can push into new high ground when the market itself is not making new highs are often giving you an important clue.

This is just one of many golden nuggets Marty Schwartz shared in his book Pit Bull, and we wrote about several of them in this article:

https://substack.com/@tradingmomentum/p-201342828

ArticleHow Marty “Pit Bull” Schwartz Turned $40K Into $20M Without Big Drawdowns
View on Substack ↗

Everyone Saw the AI Chips. Few Saw the AI Plumbing.

William O’Neil called this the “cousin stock” theory.

When a major theme is working, most traders focus on the obvious leader.

But sometimes the better opportunity is hiding one step away.

  • The supplier.

  • The equipment maker.

  • The parts provider.

  • The infrastructure company.

O’Neil used Boeing as an example.

Boeing was the obvious winner during the airline boom, but every new jet also needed parts from suppliers. One of those supplier stocks, Monogram Industries, went on to make a massive move.

Same theme. Different angle.

That still happens today.

In the AI boom, Nvidia was the obvious AI leader.

Everyone saw the GPUs.

But AI data centers also need high-speed optical connections to move data between GPUs, servers, switches, and storage systems.

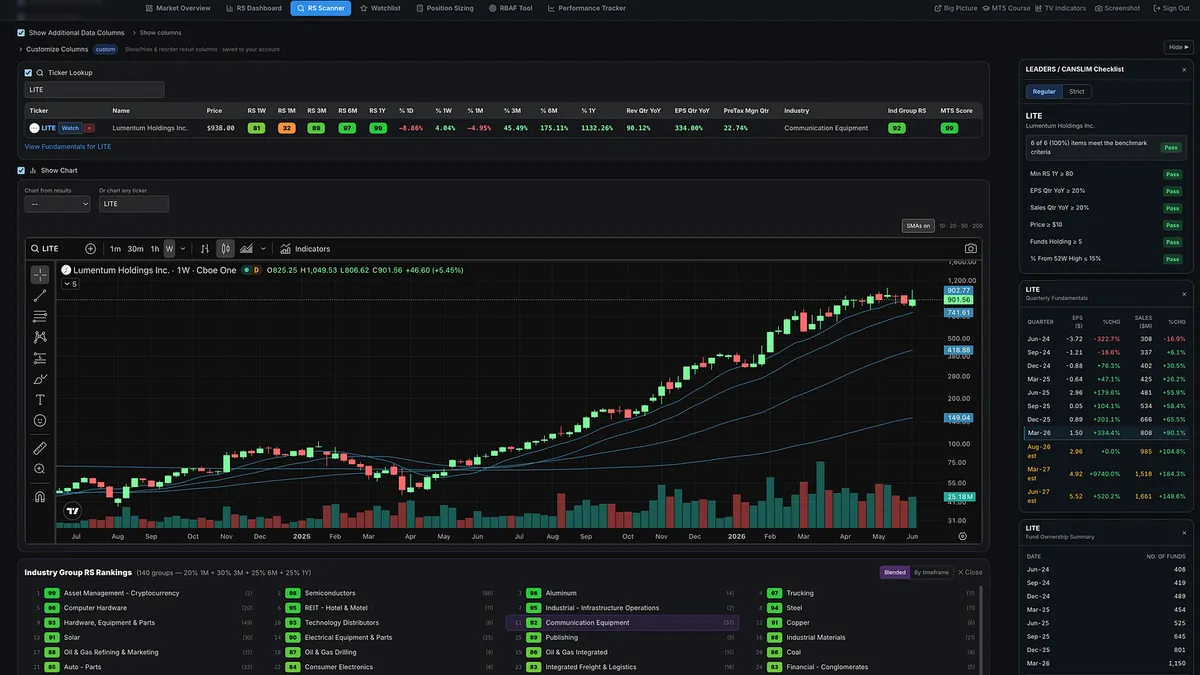
That is where Lumentum (LITE) became a modern cousin/follow-on stock.

LITE does not make Nvidia’s GPU.

It does not need to.

It supplies advanced lasers, optical modules, transceivers, and photonic components that help AI data centers scale.

Then Nvidia made the connection even clearer by announcing a strategic partnership and investment in Lumentum.

NVDA was the obvious leader in 2023–2024.

LITE was a related supplier benefiting from the same AI infrastructure demand, which helped it become one of the leading stocks in 2025–2026.

Most traders ask:

“What stock should I buy?”

Better traders ask:

“What theme is driving the market, which group is leading, and who are the cousin stocks benefiting from the same demand?”

That is where leadership leaves clues.

The crowd usually sees the main story first.

The best traders look for the ecosystem forming around it.

That is why industry group and relative strength matters.

This is why I built the Momentum Trading Strategy RS Scanner.

Not just to find strong stocks, but to help identify the strongest groups, and related names moving with institutional demand.

View on Substack ↗

The money is rarely hiding in dead industries.

William O’Neil studied more than 1,000 of America’s greatest stock market winners, and one lesson keeps showing up:

The biggest winners usually come from the strongest industry groups, the strongest market themes, and the newest areas of American innovation.

Railroads. Autos. Airplanes. Radio. Television. Computers. Software. The Internet. Social Media. AI.

Different decade. Same principle.

The market usually does not reward investors for buying what is cheap, old, obvious, or comfortable.

It rewards those who learn to recognize where institutional money is flowing, which groups are leading, and which companies are building something new.

That is why industry group strength matters.

That is why relative strength matters.

That is why “New” is one of the most important parts of CAN SLIM.

Most traders are asking:

“What stock should I buy?”

The better question is:

“What theme is driving this market, which industry group is supporting that theme, and which stocks are leading inside that group?”

That is the game.

Not chasing opinions.

Not buying random breakouts.

Not trying to predict the future.

Finding leadership while it is still being accumulated.

The next great winner probably will not come from the old, well-known areas of the past.

It will likely come from the area of the market changing the future.

The Momentum Trading Strategy RS Scanner was created to help you identify those leaders.

View on Substack ↗

Why Do You Keep Missing the Biggest Winning Stocks?

Most traders spend their time looking for stock tips.

The best traders spend their time looking for stock characteristics.

Strong earnings. Strong sales. Strong relative strength. Strong industry groups. Strong price action.

The funny thing is many of the biggest winners were not hiding.

MU. LITE. SNDK. CIEN.

They were displaying many of the same characteristics long before their biggest moves.

The challenge isn’t finding the information.

The challenge is having a process that helps you recognize it.

I just published a new article walking through the exact screening process I use to find potential market leaders.

If you’ve ever wondered how traders consistently find big winners while everyone else seems to discover them months later, this article is for you.

https://tradingmomentum.substack.com/p/how-i-find-the-biggest-winning-stocks

ArticleHow I Find the Biggest Winning Stocks in the Market
View on Substack ↗

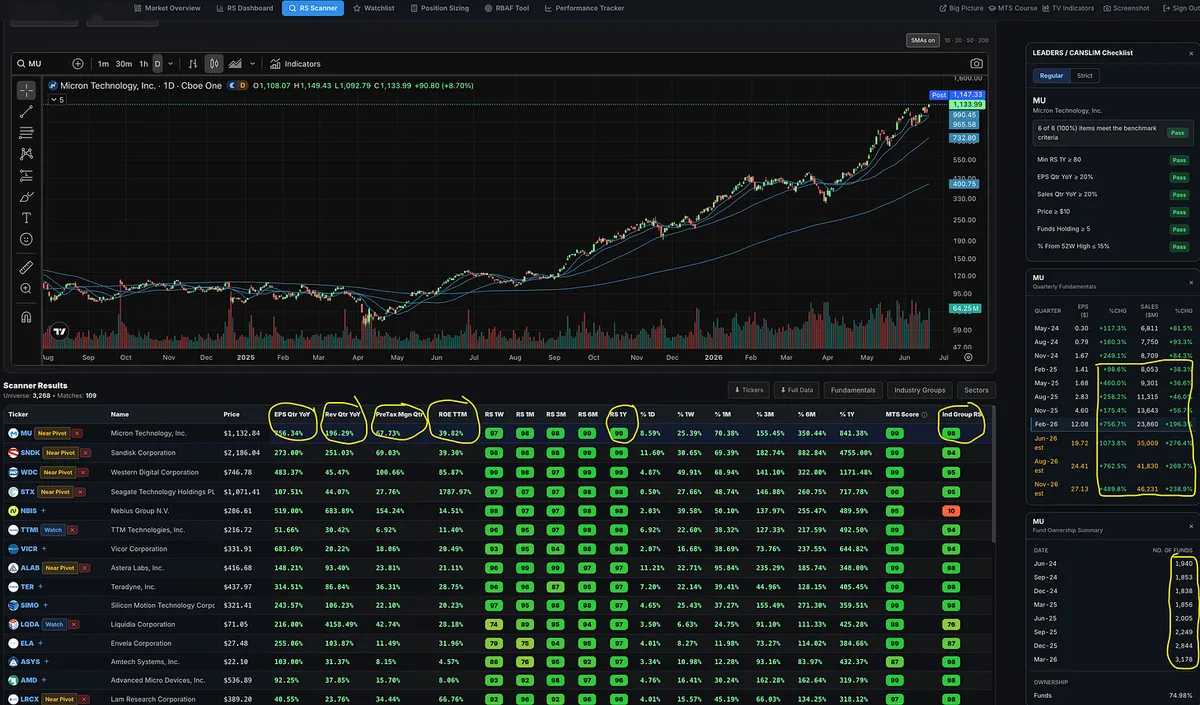
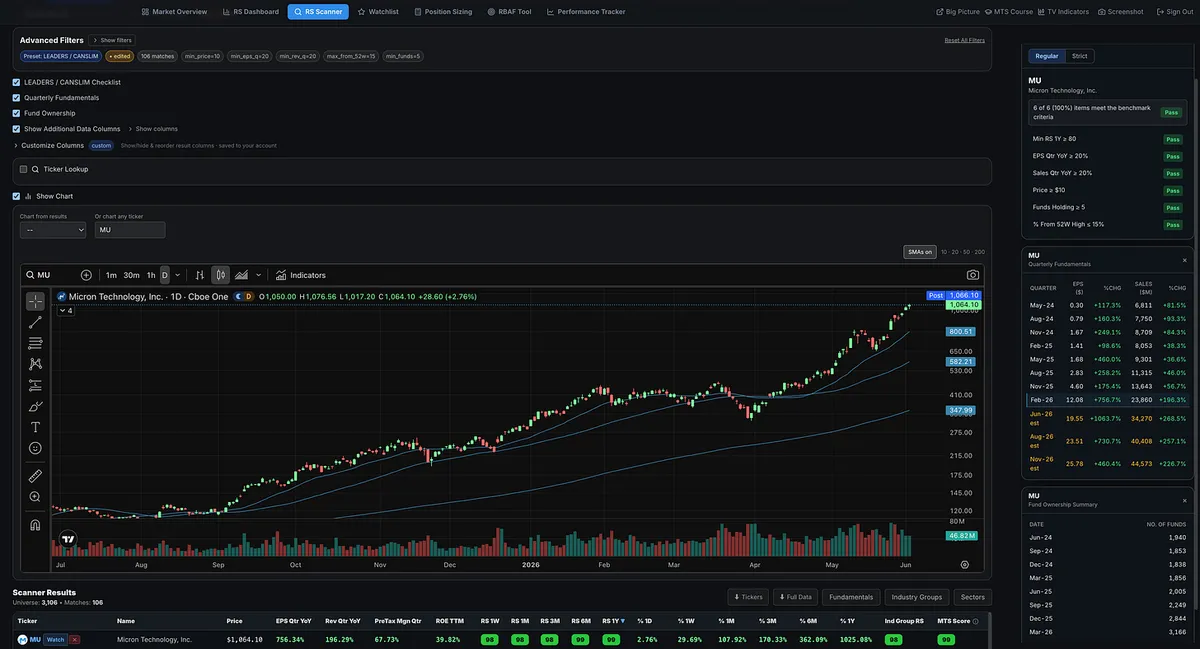
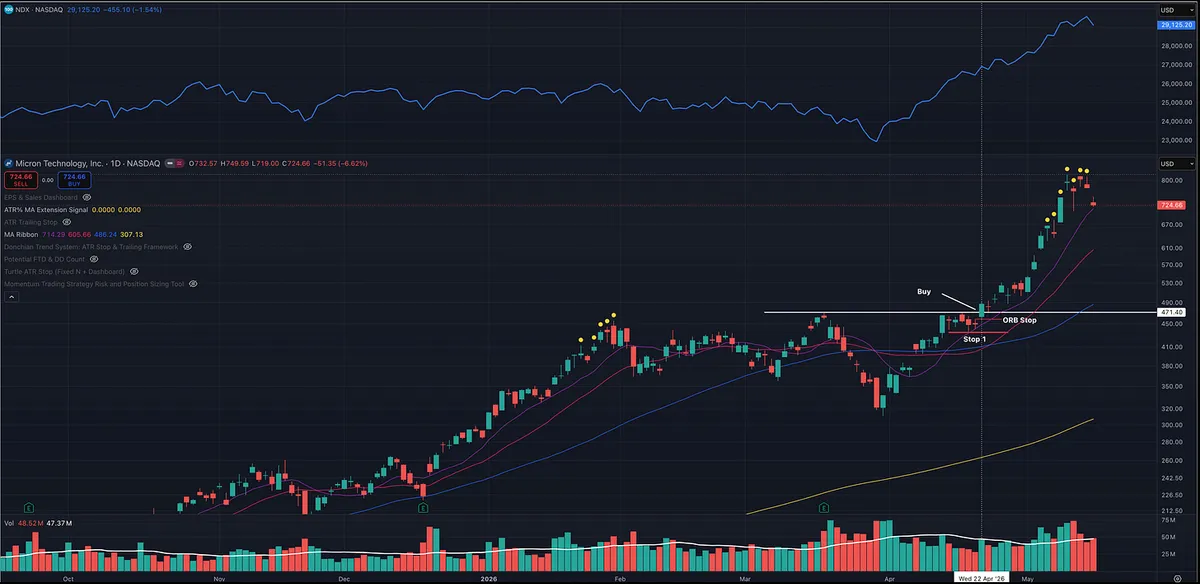
Put MU in the Model Book

Big earnings. Big sales. Big ROE. Big margins.

MU checks nearly every box that has defined many of the market's biggest winners.

• EPS Growth: +756%

• Sales Growth: +196%

• ROE: 39.8%

• Pretax Margin: 67.7%

• Relative Strength: 98–99 across multiple timeframes

• Fund Ownership: Increasing quarter after quarter

This is what institutional accumulation looks like.

Strong fundamentals. Strong sponsorship. Strong price action.

View on Substack ↗

The Multi-Bagger Irony

A lot of stock newsletters sell people on the hope of finding the next multi-bagger.

A 100%, 200%, or 300% winner.

Many talk about holding for years to get the big returns.

What people don't realize is this:

By the time you figure out they were full of it, they already made plenty of money selling you the hope.

The funny thing is, I don't even teach or claim to give people multi-baggers.

But many investors would likely get similar or better results by learning how to identify true growth stock leadership, proper setups, institutional demand, and strong price action.

Here are a few names I mentioned in January and early February:

• AAOI +302%

• AXTI +294%

• SNDK +249%

• DELL +214%

• MU +160%

• LITE +155%

• CIEN +147%

• STRL +127%

• STX +126%

• WDC +124%

• INTC +101%

• AMD +101%

These were discussed in the paid subscriber chat and watchlist posts.

But to be clear, this is not what I do here.

I'm not telling you to blindly buy a stock and hold it until it becomes a multi-bagger.

The goal is to teach you how to find leadership, manage risk, identify proper entries, and build a repeatable process.

View on Substack ↗

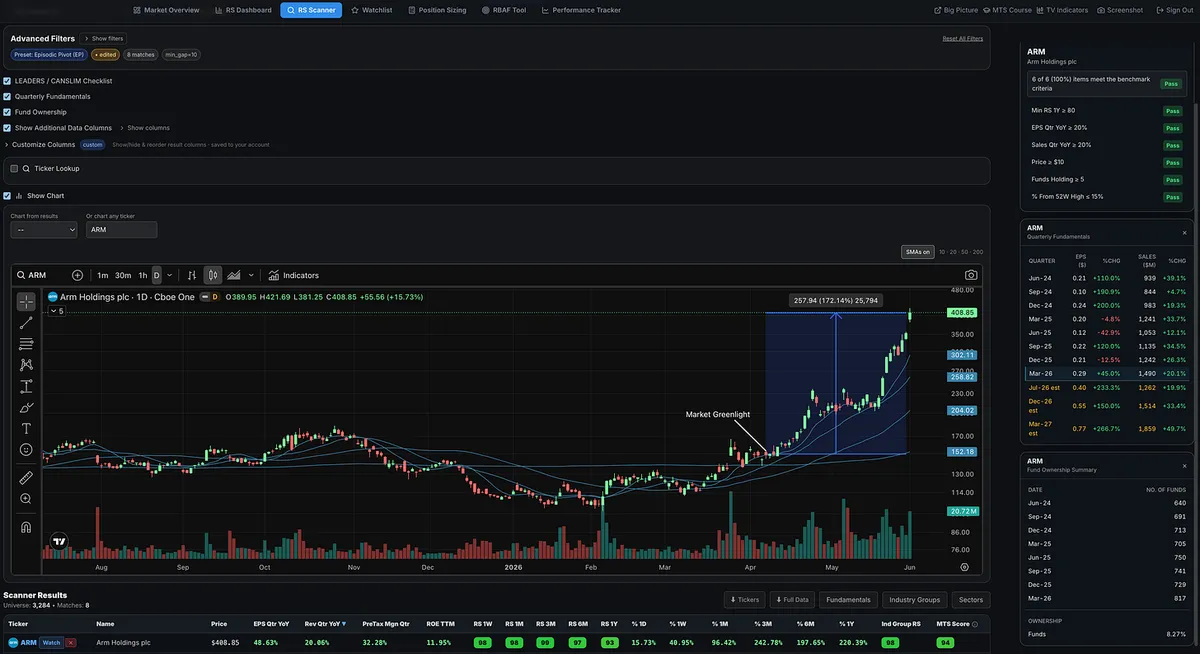
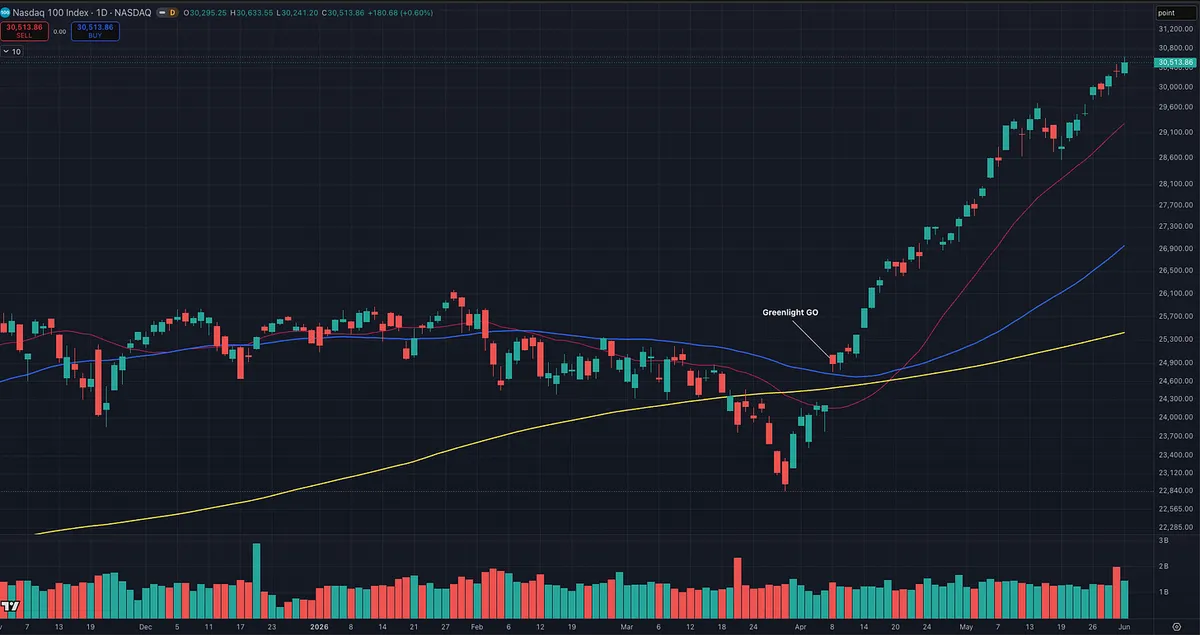
The Market Gave the Green Light

On April 8, the market gapped up above the 50-day and 200-day moving averages on a follow-through day.

That was the green light to start participating again.

Many traders ignored the signal.

Then they complained that there was “nothing to buy.”

Then, after the strongest names started moving, many said the move had already happened and the stocks had already left without them.

But that was not true.

MU was one example I gave that was still setting up on April 22.

ARM is another example of a later mover that gave traders plenty of time to participate.

After the market confirmed strength, ARM began building momentum, tightened up, held key moving averages, and eventually made a powerful move higher.

This is why following a proven process matters.

The market gave the signal.

Leading stocks showed up before, during and after the market moved.

There were plenty of opportunities for traders who were prepared and knew what they were doing.

This is why we built the Momentum Trading Strategy Course and MTS Software.

The course gives you the foundation.

The software helps you find the leaders.

Stop wasting time guessing.

View on Substack ↗

Are You Missing Stocks by Only Looking for Strength?

I got a good question from a subscriber, and I think many newer traders have probably wondered the same thing.

"If I filter for an MTS Score 80+ (similar to the IBD Composite Rating), am I missing stocks that are just starting to improve from lower levels?"

Yes, that assumption makes sense.

But this is also where growth stock investing and momentum trading can feel counterintuitive.

If you filter for an MTS Score above 80, you may miss some stocks that are just beginning to improve from lower levels.

However, the purpose of that filter is not to find stocks at the bottom.

The goal is to find stocks that have already started proving themselves as leaders.

William O'Neil's research, along with the work of many great growth stock and momentum traders, shows that the biggest winning stocks often display strength before their biggest moves.

They typically already have:

• Strong relative strength

• Big earnings and sales growth

• Strong margins or ROE

• Improving institutional sponsorship

• Leadership within a strong industry group

• Price action near new highs

All before the majority of the move occurs.

Conventional wisdom makes people want to find stocks early at the bottom or near the bottom.

But growth stock investors are usually looking for confirmation that a stock is becoming a true leader.

Many of the stocks that have gone up 100%, 200%, or more over the past few months already had strong ratings above 80 before the majority of the move happened.

CIEN is a good example.

When I first mentioned CIEN back in January, it already had strong ratings and a Relative Strength Rating of 98.

Many people would assume that means they “missed it.”

But from that point, the stock still went up more than 125%.

Strength often comes before more strength.

So yes, a lower MTS Score filter can help you cast a wider net for earlier improvement.

But an MTS Score above 80 is designed to focus on strength, leadership, and confirmation.

We are not trying to buy the weakest stocks before they turn.

We are trying to find the strongest stocks as they prove they are leaders.

The MTS Score is a proprietary leadership rating that evaluates factors such as Relative Strength, EPS growth, Sales growth, ROE, Margins, Industry Group Relative Strength, and other characteristics commonly found in leading stocks.

View on Substack ↗

Technology Continues to Dominate

Looking across the 11 major U.S. sectors, one thing remains remarkably clear: technology continues to lead by a wide margin.

Since the April follow-through, no other sector has come close to matching the performance of XLK. The relative strength advantage has been obvious and consistent every week we've reviewed the data. Leadership continues to be concentrated in technology and the growth-oriented industry groups.

As traders, our job is not to argue with leadership. Our job is to identify where capital is flowing and align ourselves accordingly. The evidence has been remarkably clear. If you have been fighting this leadership or searching for strength in weaker areas of the market, perhaps this should be your wake-up call.

View on Substack ↗

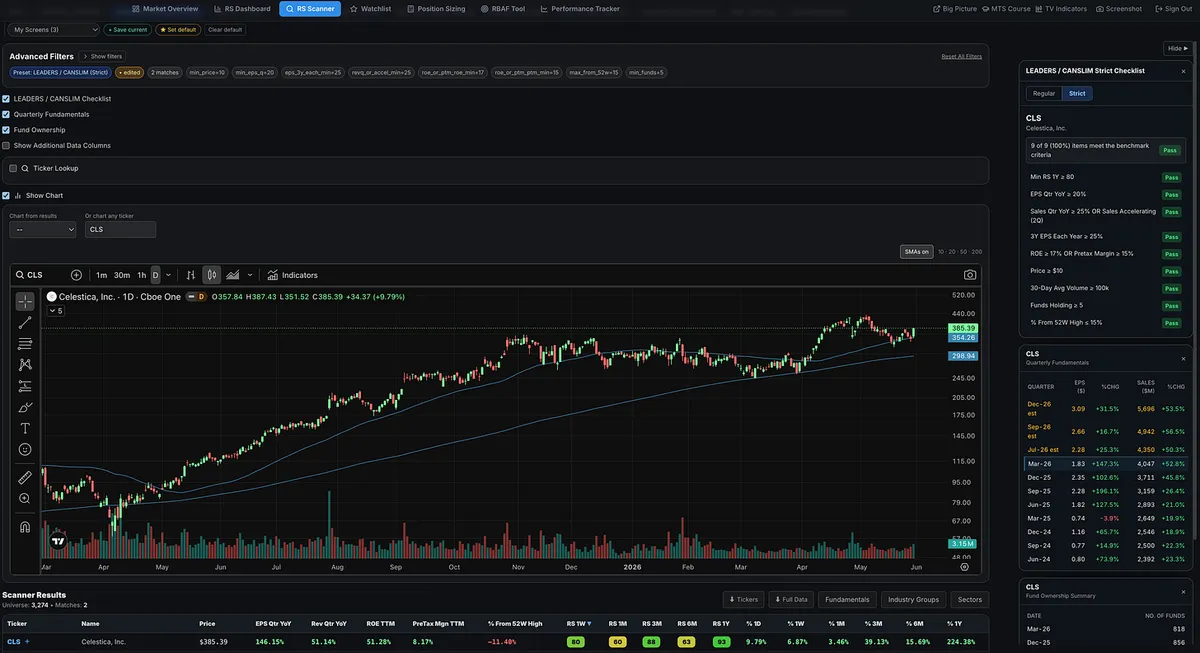
Sometimes Great Fundamentals Are Not Enough

CLS is a perfect example.

The numbers are excellent.

  • Triple-digit EPS growth.

  • Strong sales growth.

  • High ROE.

  • Big estimates.

But since last November, the price action has been wide, choppy, and inconsistent.

Even after the strong move off the April lows, CLS has not been one of the best relative strength leaders compared to other names in the market.

This is why fundamentals matter, but price action and relative strength still decide where capital should go.

The best stocks usually have both:

  • Great numbers

  • Clean price action

  • Strong relative strength

But…. I do like how it found support on the 50MA and has a higher high, higher low pattern.

View on Substack ↗

The Most Overrated Indicator

“I rarely pay any attention to overbought/oversold indicators.” -William O’Neil

A lot of traders see a stock go up and immediately think it is “overbought.”

The greatest stocks in the market often stay overbought for a long time.

That is what strong stocks do.

They keep showing demand.

They keep making new highs.

They keep outperforming the market while everyone else waits for the reversal.

The real question is not:

“Is it overbought?”

The better question is:

“Is this stock under accumulation and showing true leadership?”

That is why I care more about relative strength, and price action than an overbought reading.

The best stocks often look too high before they go much higher.