The Best Swing Trades Look Like This Before They Explode
Study this chart.
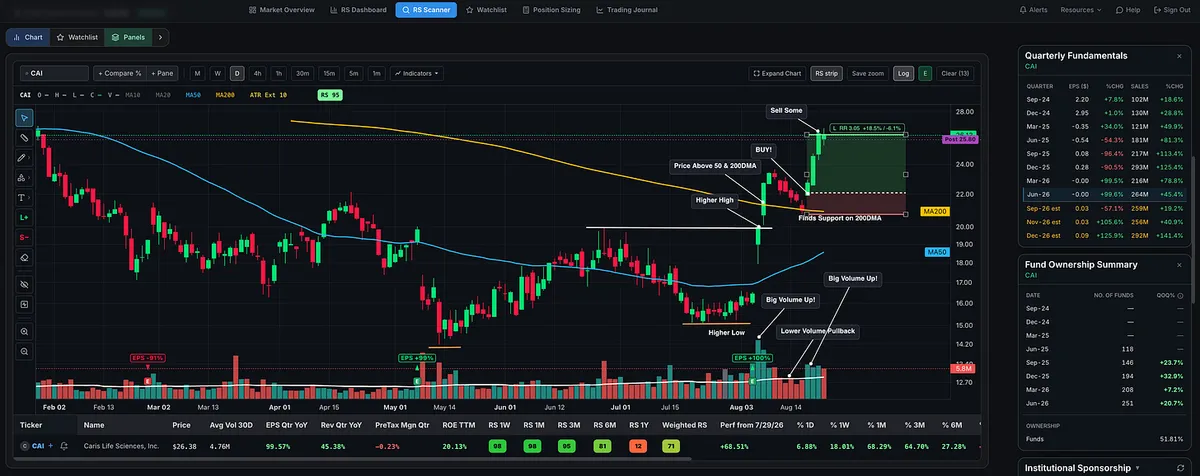
CAI is a great example of what can happen when industry strength, price action, volume, fundamentals, and risk management all align to create a low-risk, high-reward swing-trading setup.
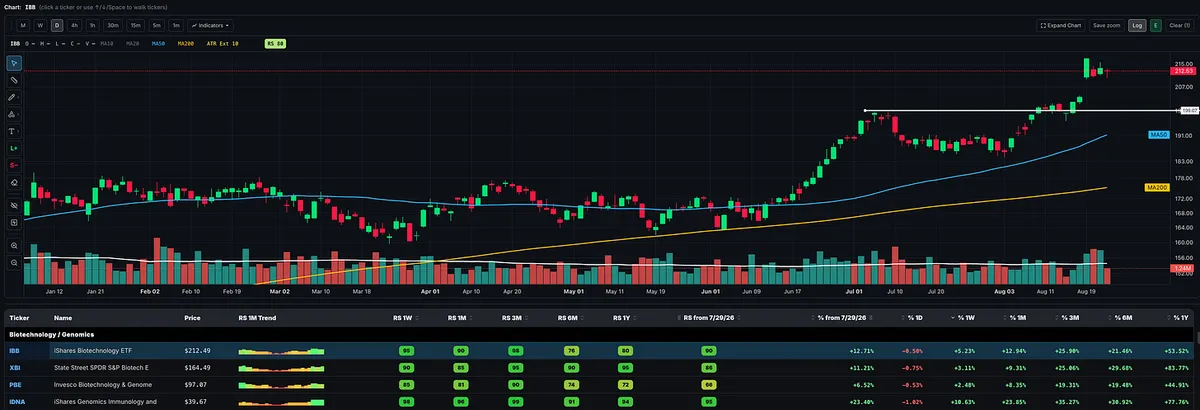
Biotech had a strong run in June. IBB then spent July building a base, formed a handle near its highs in August, and broke out to new highs.
While the industry group was confirming its strength, CAI was setting up.
Character change: The stock established a higher low followed by a higher high. That higher high confirmed the higher low and signaled the character change I look for.
Volume and growth fundamentals: Around earnings, volume expanded dramatically, quarterly sales grew 45%, and price moved back above both the 50-day and 200-day moving averages.
Low-volume pullback: CAI pulled back on declining volume almost perfectly to the 200-day moving average and found support.
Entry: The following day, it gapped higher on increasing volume, providing an entry near the open on August 19.
Clearly defined risk: You could have placed a very tight stop below the low of the entry day. My preferred stop was below the higher low, the 200-day moving average, and the low of the pullback.
Sell into strength: Once the stock reached a multiple of the initial risk, you could sell some into strength to help finance the trade, protect your principal, and give the remaining shares room to capture a potentially larger move.
That is what low risk really means.
It does not mean the trade cannot fail. It means you know exactly where you are wrong, while the characteristics of the setup offer significantly more potential reward than what you are risking.
Even the wider technical stop required less than 6% risk. Within only a few days, CAI had gained approximately 18%, or three times the initial risk. That created an ideal opportunity to sell some into strength while allowing the remaining position more room.
The fundamentals also supported the setup:
Sales growth of approximately 45%
ROE above 20%
The number of funds owning shares more than doubling over the past year
Improving forward estimates
One-month RS of 98
Three-month RS of 95
CAI does not fully meet my longer-term position-trading criteria, particularly because its one-year relative strength remains weak. But for a swing trade, it fits extremely well.
This is why traders like Kristjan Kullamägi focus on the market’s strongest performers over the previous one, three, or six months.
Strong industry group. Character change. Massive volume. A lower-volume pullback. Support at a key moving average. A clear entry and clearly defined risk.
Study these characteristics.