
Trading articles/Why the Market’s Biggest Winning Stocks Rarely Move Alone
Aug 29, 2026 · Momentum Trading Strategy
Why the Market’s Biggest Winning Stocks Rarely Move Alone
Lessons from Nicolas Darvas, William O’Neil, and Mark Minervini on using industry-group strength and relative strength to find new market leaders without getting whipsawed.
Originally published on Substack.
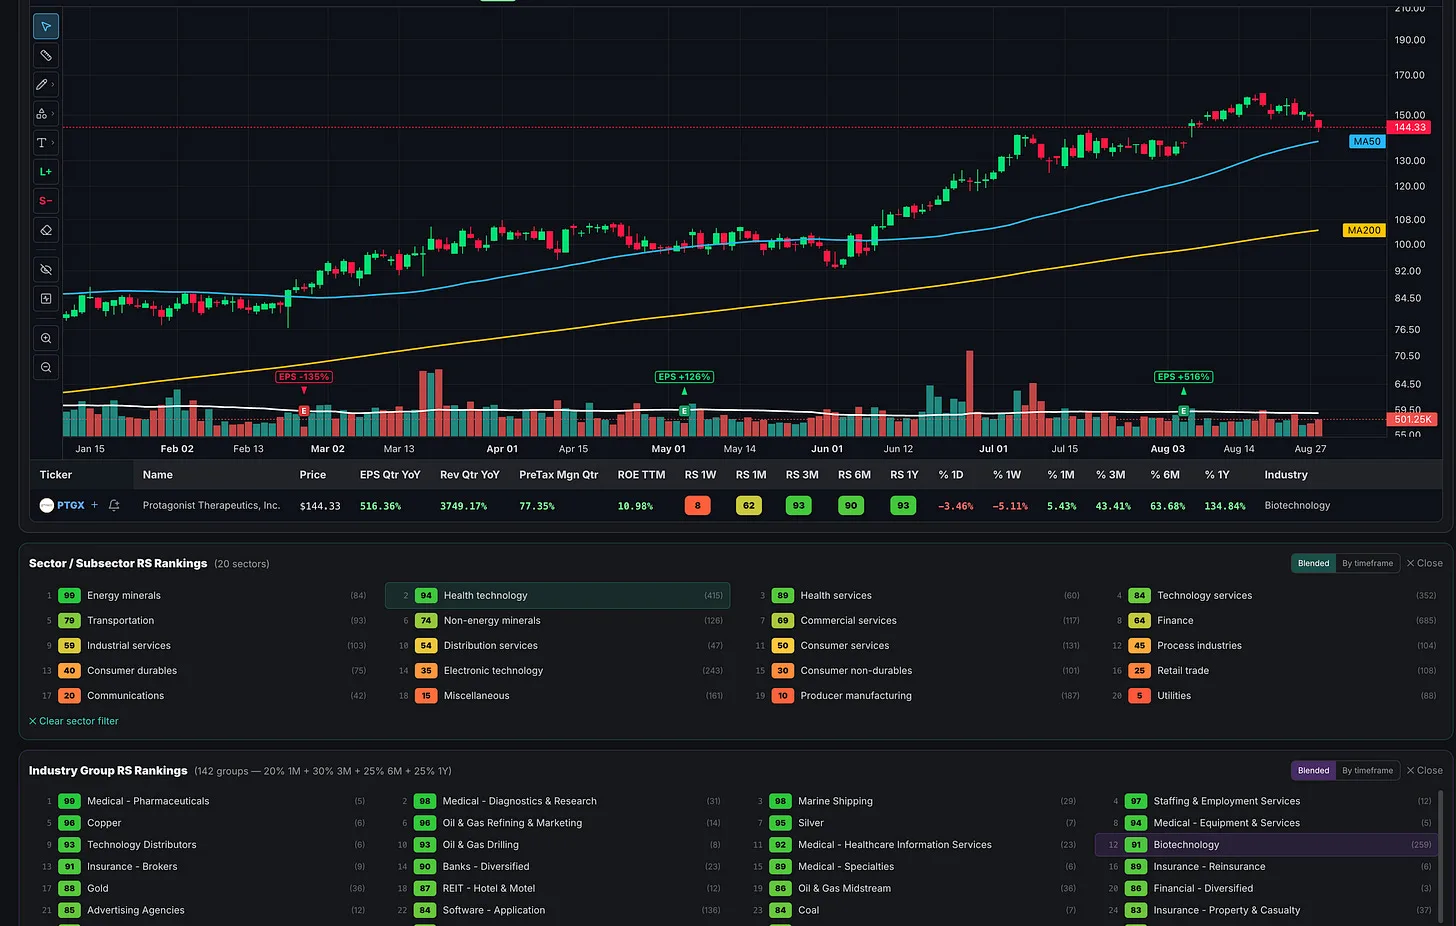
“Roughly half of a stock’s move is driven by the strength of its respective group.”
- William J. O’Neil, How to Make Money in Stocks
One of the most difficult parts of growth stock investing and momentum trading is recognizing when institutional money is rotating from one area of the market into another. Traders naturally want to identify the next major shift before it becomes obvious, whether that shift is into software, healthcare, semiconductors, financials, or another emerging area of leadership.
The problem is that no scanner, dashboard, or indicator can reliably announce a major rotation before the market begins producing evidence of it. If you wait until everyone agrees that a group is leading, many of the best stocks may already be extended. If you react to every short-term change in relative strength, however, you can spend the entire year chasing one group after another and getting whipsawed.
The objective is not to predict every rotation in advance. It is to recognize the evidence early enough to participate, while giving the market enough time to prove that the shift is real. That requires a balance between top-down industry-group analysis, bottom-up stock selection, and an honest understanding of your own trading timeframe.
My own process moves through five connected layers: the clusters appearing in my individual stock screens, the leadership in the major indexes, the relative performance of the 11 market sectors, the more than 140 classified industry groups inside MTS Velocity, and the broader themes driving institutional demand. None of those layers is sufficient by itself. Together, they help distinguish an emerging trend from another short-lived rotation.
Why Industry Groups Matter
William O’Neil placed industry-group analysis near the center of the CANSLIM methodology. In How to Make Money in Stocks, he cited research showing that approximately 37% of a stock’s price movement was connected to the performance of its industry group, with another 12% tied to its broader sector. O’Neil’s conclusion was that roughly half of a stock’s movement could be influenced by the strength or weakness of the area in which it operates.
His historical work also found that nearly two out of every three highly successful stocks from 1953 through 1993 participated in broader group advances. This does not mean every stock in a strong group will become a winner. It means the odds improve when a fundamentally strong company, powerful price trend, and leading industry group are all working together.
The distinction between a sector and an industry group is important. Technology may be performing well as a broad sector while software, semiconductors, computer hardware, cybersecurity, and IT services behave very differently beneath the surface. O’Neil divided the market into far more specific industry groups because broad sector strength can conceal major differences between the true leaders and the laggards.
This is why industry-group rotation deserves attention. It helps us determine not only where money is flowing, but also which specific areas within a broad sector are attracting the strongest institutional demand.
What Actually Makes a Leading Industry Group?
At its simplest, a leading industry group is one that ranks near the top of the market in relative price performance. In O’Neil’s framework, that designation is based first on what the stocks within the group are actually doing, not whether the industry has the most exciting story or belongs to a traditionally growth-oriented sector.
That does not mean every stock in a highly ranked group is a market leader or a valid buy. The group ranking identifies where strength is concentrated. We must then look inside the group to determine whether the strength is supported by more than one important stock and whether the strongest companies display the CAN SLIM characteristics O’Neil associated with major market winners, including superior earnings and sales growth, something new driving the business or industry, institutional sponsorship, strong relative price performance, and constructive price and volume action.
A defensive or cyclical industry can therefore qualify as a leading group if its relative price performance ranks near the top of the market. It may or may not produce an individual stock that fits our growth-stock strategy. That distinction is critical: relative price performance determines whether the industry group is leading, while the quality of the individual company and its technical setup determine whether there is actually a stock worth buying.
Top-Down Confirmation Meets Bottom-Up Leadership
O’Neil emphasized ranking industry groups by relative price performance and concentrating research in the strongest areas. He also looked for confirmation from more than one important stock in the same group. When several companies from the same industry begin breaking out, reaching new highs, or reporting strong earnings, the evidence of a genuine group move becomes much stronger.
Mark Minervini adds an important qualification to this approach. In Trade Like a Stock Market Wizard, he explains that he often lets individual stocks lead him into an industry group. The best stocks can begin advancing before it becomes obvious that their broader group or sector is strong, which means an investor who waits for perfect top-down confirmation may arrive after the true leaders have already made substantial progress.
These ideas are not contradictory. They describe different stages of the same process. An exceptional individual stock may provide the first clue, improving participation from related stocks can confirm the group move, and persistent relative strength can show that the trend is becoming durable.
Minervini also recommends tracking the top two or three stocks in an industry group, particularly those with the strongest combination of earnings, sales, margins, and relative price strength. Those leaders can reveal when a group is coming alive, but they can also provide an early warning when leadership begins to deteriorate.
A new bull market is often led by a relatively limited number of industry groups or subgroups, sometimes as few as three or four and sometimes as many as eight or ten. That selectivity is important. A healthy market does not require every group to advance, but it should produce recognizable areas of leadership with enough quality stocks to create real opportunity.
The practical lesson is to use both perspectives. Let strong individual stocks direct your attention toward an industry, then use group-level evidence to determine whether you are looking at one exceptional company or the beginning of a broader institutional move.
My Individual Stock Screens Often Reveal the Shift First
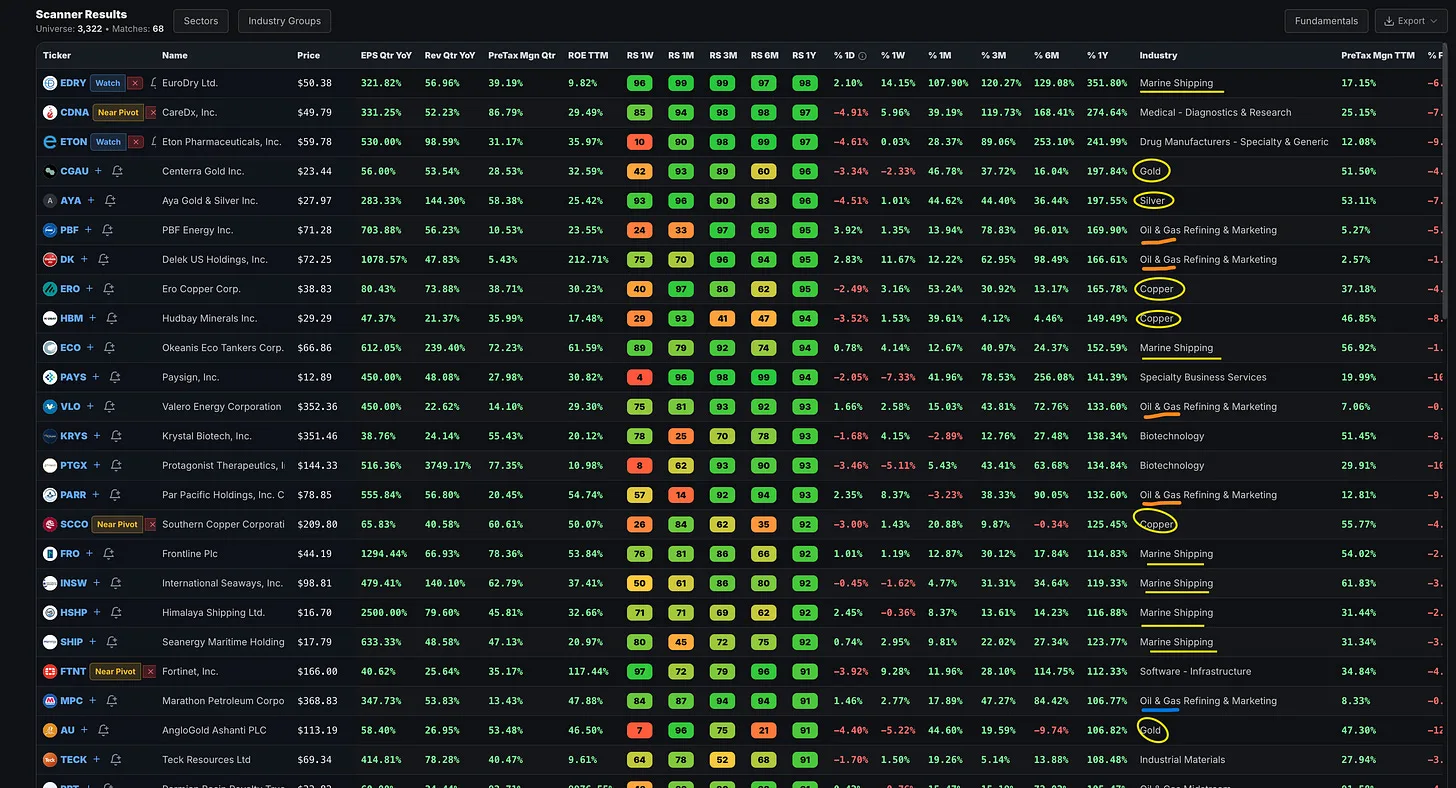
The first place I often notice an industry-group change is not in a sector index or a group ranking. It is in my individual stock screens. I am continuously screening for companies with strong earnings, strong sales, high relative strength, and price action that meets my technical criteria across multiple timeframes.
As I work through those results, clusters begin to appear. Instead of seeing one isolated software stock, I may notice several software companies meeting the same demanding criteria. The same thing can happen with biotechnology, software, metals and mining, semiconductors, retail, or any other area attracting institutional demand.
That clustering matters because it is the market revealing where the strongest individual stocks are coming from. It is also consistent with Minervini’s bottom-up approach. The best stocks can begin leading before the industry index makes the rotation obvious, so repeated appearances from the same group can provide an early clue that deserves further investigation.
One stock is not enough to establish a group move. A single company may have a unique product, an earnings surprise, or a company-specific catalyst. When several stocks from the same industry display strong earnings, sales, relative strength, and constructive setups, the probability of a broader institutional move begins to improve.
One Strong Week Gets My Attention, but Consistency Matters
A burst of one-week relative strength may be enough to put an industry group on my radar, but it is not enough by itself to make me commit capital to the area. Experience teaches that a single strong week can disappear as quickly as it arrived, particularly when the broader market is moving sideways or drifting lower.
The evidence becomes more meaningful when the same industry continues producing strong stocks week after week. I want to see persistence in the screens, expanding participation, constructive pullbacks, successful breakouts, and shorter-term RS strength beginning to appear in the one-month and three-month readings. Durable institutional accumulation usually leaves repeated evidence rather than one isolated burst.
This progression matters because large institutions generally cannot build meaningful positions in a single afternoon without affecting price. Their accumulation tends to appear through repeated strength, constructive pauses, increasing numbers of stocks reaching new highs, and related companies beginning to participate. One strong week can alert us to the possibility, but consistency helps determine whether the move deserves capital.
This is where patience protects the trader. Buying whichever group happens to be strongest this week, only to abandon it when a different group takes over next week, creates a cycle of chasing and small losses. That is how traders experience death by a thousand cuts even when they believe they are doing the right thing by following relative strength.
Short-term strength should therefore be treated as an alert to investigate, not automatic proof that a new long-term leader has been established. The goal is to be responsive without becoming reactive.
Index Leadership Reveals the Market’s Character
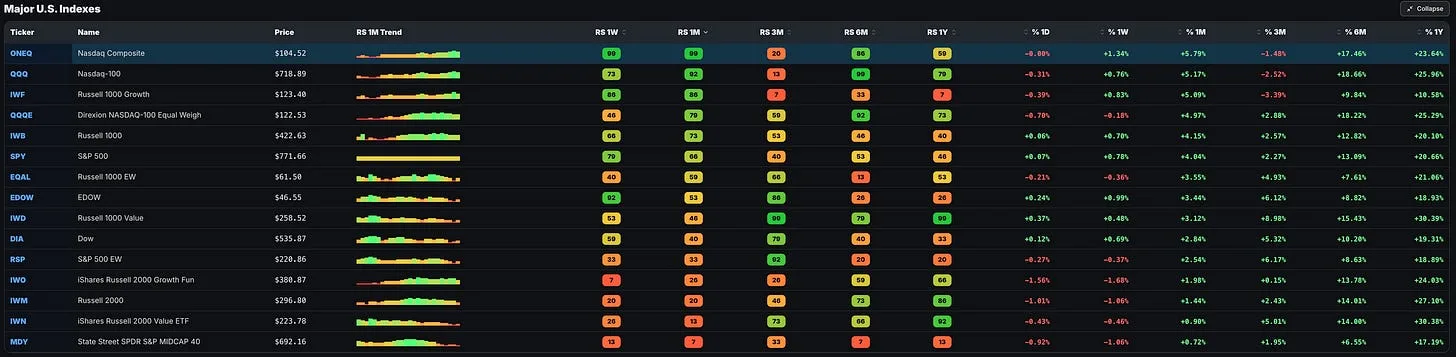
The second layer of the process is index leadership. The major indexes reveal which parts of the market are receiving support and help identify the type of stocks the market is currently rewarding.
If the Dow is the clear leading index, that is describing a very different leadership profile than a market being led by the Nasdaq 100, Nasdaq Composite, Russell 1000 Growth Index, or QQQE. Leadership from growth-oriented and equal-weight indexes generally suggests broader participation among growth companies, while leadership from the Dow or more value-oriented indexes can point toward a different mix of sectors, industries, and stock characteristics.
This relationship is not mechanical, and no single index determines what must happen next. It does, however, provide important context before I move deeper into sector and industry-group analysis. This is one reason the Big Picture Market Pulse regularly highlights which indexes are leading, lagging, strengthening, or deteriorating.
More experienced readers can often infer the market’s character from those relationships very quickly. Newer traders may need to compare the index leadership directly with the sectors, industry groups, and individual stocks appearing near the top of the RS Dashboard and scanner.
The indexes provide the broad context, the sectors narrow the opportunity set, the industry groups identify where the strength is concentrated, and the individual stocks provide the actual trading opportunities. Combining those levels creates a more complete view than relying on any single ranking.
The 11 Sectors Narrow the Search

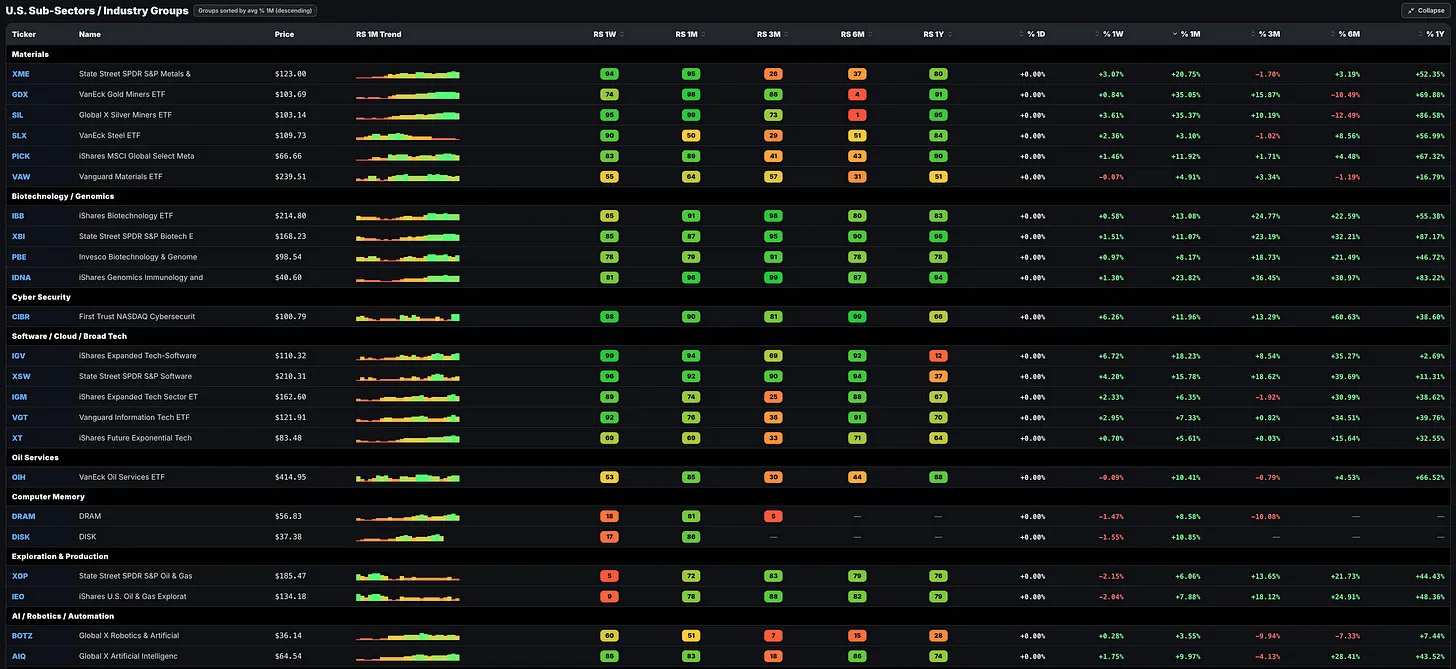
The next layer is the sector level. The Global Industry Classification Standard currently divides the market into 11 broad sectors, giving investors a practical top-level view of where money is flowing before drilling down into more specific industries.
If technology is leading, the next question is which parts of technology are driving the move. It could be software, semiconductors, computer hardware, cybersecurity, or another specialized area. If energy is leading, the strength may be concentrated in exploration and production, oilfield services, refiners, equipment providers, or another segment. If defensive sectors are leading, that may say something very different about risk appetite than broad leadership from cyclical and growth sectors.
Sector analysis does not identify the trade by itself. It narrows the field and helps explain why clusters of individual stocks are appearing in the screens. The broad sector points us toward the neighborhood, while the industry-group data helps identify the specific street where leadership is developing.
Drill Down Into More Than 140 Industry Groups
“You should concentrate on the top two or three stocks in a group: the leaders in terms of earnings, sales, margins, and relative price strength.”
- Mark Minervini, Trade Like a Stock Market Wizard
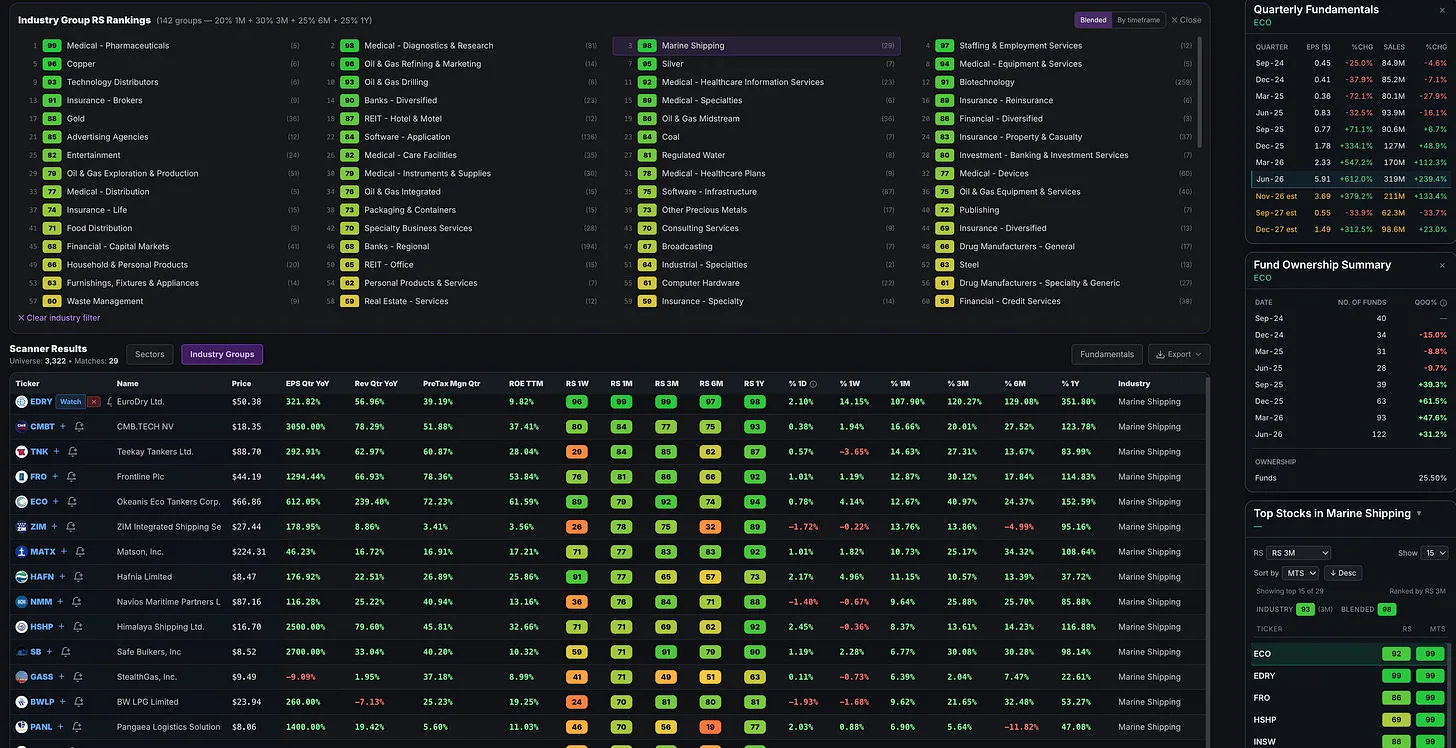
MTS Velocity classifies the stock universe into more than 140 industry groups so we can move beyond broad labels and identify the specific areas producing strength. The Sector and Industry Group tabs above the RS Scanner results reveal the individual stocks creating the move.
The RS Dashboard will give you an idea where strength is and Sector / Industry Group tabs inside the RS Scanner, shows you the stocks in those strong groups. Its purpose is to make changes in leadership easier to recognize and investigate. The trader must still decide whether the strength is persistent, broad enough to matter, aligned with the intended holding period, and supported by actionable individual stocks.
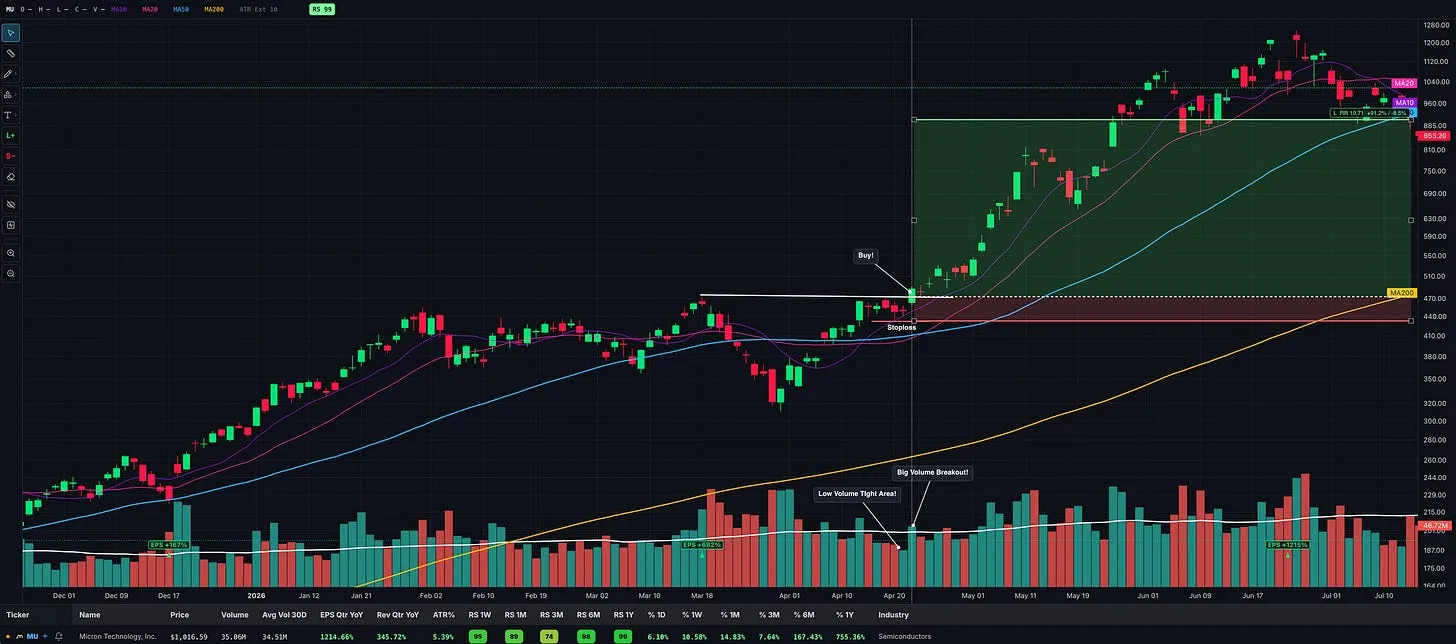
One stock making a large move can distort the appearance of a small group. A healthier rotation usually includes broader participation, with several stocks showing improving relative strength, constructive price action, strong earnings or sales, and increasing numbers of new highs. Minervini specifically points to a growing number of stocks in an industry reaching 52-week highs as evidence that a group advance may be underway. Great example of this was Computer Hardware / Memory industry group in 2025-2025 where SNDK was the clear leader but we had many names with BIG earnings and sales and strong price performance leading the market like WDC, STX, DELL, HPE, etc.
The quality of participation matters as much as the quantity. Focus on the top two or three stocks in the group rather than buying a weak stock simply because it appears cheaper than the leader. O’Neil repeatedly warned against sympathy plays, because laggards rarely produce the same magnitude or durability of performance as the true leader.
Group strength is still not sufficient by itself. The individual stock must offer a sound setup, an appropriate entry point, and manageable risk. A leading stock in a leading group can still be a poor trade if it is extended, breaking down, or too far from a logical stop.
There will also be exceptions. A superior company can begin leading before its group confirms the move, and an exceptional stock can sometimes continue performing after the broader group loses momentum. Industry strength should be treated as powerful supporting evidence, not as a rigid veto that overrides everything happening in the individual stock.
Themes Help Explain Why Leadership May Persist
The final layer is the set of themes driving the market. A strong theme provides a fundamental reason that capital may continue flowing into a group, whether the driver is a new technology, a commodity cycle, regulatory change, capital spending, consumer demand, or another meaningful shift in industry conditions.
Themes often extend beyond one narrowly defined industry group. O’Neil described a follow-on effect in which a major development in one industry creates demand for related industries, suppliers, and service providers. Recognizing the underlying driver can therefore help connect strength across multiple groups and identify where institutional interest is beginning to spread.
A clear example emerged as the market recovered from the 2022 bear market. New leadership began appearing in 2023, and artificial intelligence quickly became the dominant fundamental theme. The initial wave of leadership was relatively narrow, centered primarily on semiconductors and the demand for advanced computing power.
But building AI infrastructure requires far more than chips.
As the capital-spending cycle expanded, leadership broadened across the data-center ecosystem, including:
- Servers and data-center hardware, including $DELL.
- Communications equipment and optical networking, including $LITE and $CIEN.
- Memory and storage, including $SNDK, $WDC, and $MU.
- Power generation, electrical equipment, cooling systems, and other infrastructure required to support increasingly power-intensive data centers.
This is the follow-on effect at work. The original theme began with semiconductors, but the continuing AI buildout created demand across multiple related industries. The theme was not simply “AI stocks.” It became a broad infrastructure investment cycle with several waves of leadership.
However, a follow-on effect does not make every related stock buyable. O’Neil warned against settling for sympathy plays, while Minervini emphasized that the strongest one or two stocks often move before broader group strength becomes obvious. A theme may point you toward related groups, but each stock must still prove that it is a genuine leader through earnings and sales growth, relative strength, price and volume, and a sound technical setup.
A second persistent, though more cyclical, theme complex during the 2024–2026 portion of the bull market has been hard assets and resource scarcity, particularly gold, silver, copper, and the companies that produce them.
Sticky inflation contributed to this theme, but it did not explain the entire move. Gold was supported by central-bank buying, investment demand, geopolitical uncertainty, fiscal concerns, interest-rate expectations, and currency movements. Total gold demand, including OTC activity, exceeded 5,000 tonnes in 2025 for the first time, while investment demand rose sharply.
Copper is more closely tied to electrification, grid expansion, infrastructure investment, data-center construction, and constrained long-term supply. S&P Global projects that copper demand could rise approximately 50% between 2025 and 2040, while insufficient new supply could create a significant structural shortfall.
Silver sits at the intersection of both themes. It can trade as a precious metal during periods of monetary or geopolitical uncertainty, but it also has important industrial applications in electronics, power grids, solar energy, vehicles, and data-center infrastructure. Industrial silver demand reached a record 680.5 million ounces in 2024, marking the fourth consecutive annual record.
This means the AI and metals themes are not entirely separate. AI’s demand for data centers, electricity, grid capacity, and physical infrastructure creates overlap in copper, silver, power equipment, electrical infrastructure, and related supply chains.
Other groups have also produced powerful, sometimes shorter-duration leadership phases. What distinguished these two theme complexes was their persistence, their ability to spread across related industries, and the repeated emergence of companies displaying strong earnings, sales growth, and relative strength.
Price, however, remains the final judge.
A compelling theme without leading stocks, improving relative strength, strong fundamentals, and sound technical setups is still only a story. Use themes for idea generation, group analysis, and recognizing second-order demand, but keep them subordinate to the evidence produced by the market.
Let price reveal the theme. Never let the theme talk you into ignoring price.
Your Timeframe Determines What a Rotation Means
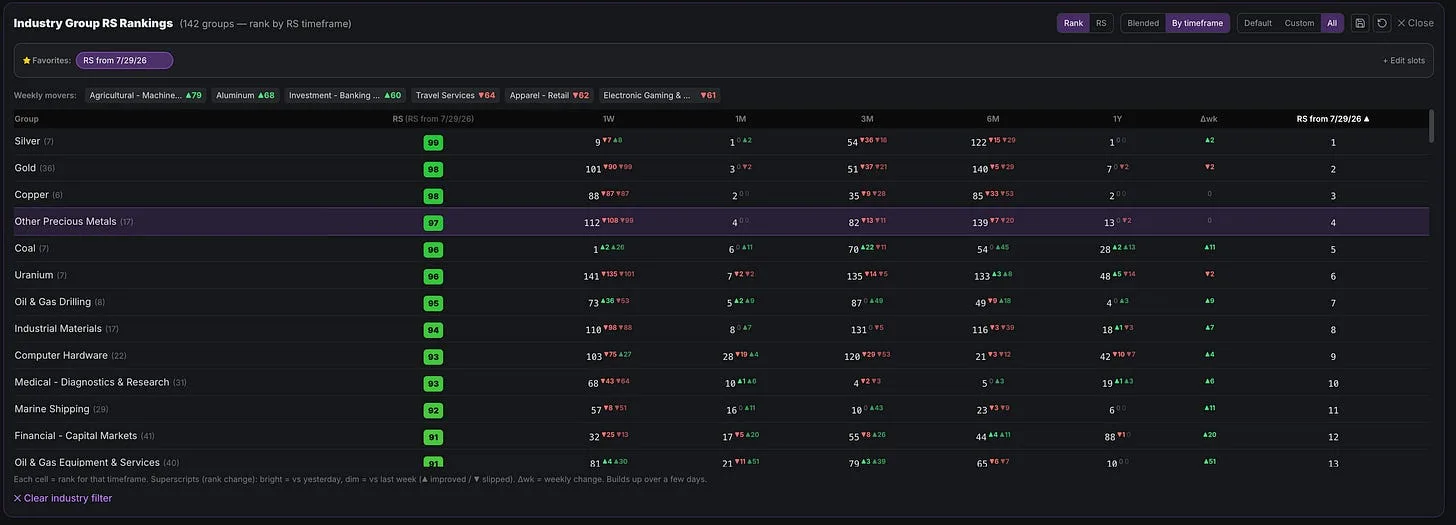
The same industry-group data can lead to different decisions depending on how long you typically hold a position. A trader holding for three to five days needs to recognize short-term momentum changes much faster than someone holding for several weeks, while a position trader planning to hold for months needs more durable evidence and a longer-term perspective.
A very short-term swing trader may monitor one-week relative strength for the earliest change while placing greater emphasis on the one-month and three-month readings. A moderate swing trader holding for a few weeks or as long as six weeks may focus more on the three-month and six-month trends. A longer-term swing trader or position trader may give more weight to six-month and one-year relative strength because a brief period of underperformance does not necessarily invalidate a major trend.
O’Neil historically ranked industry groups by their six-month price performance, providing a useful intermediate-term measure of leadership. IBD’s proprietary industry ranking incorporates multiple timeframes, much like MTS Velocity’s blended ranking.
MTS Velocity extends that analysis by allowing traders to evaluate group strength across several specific or customizable timeframes. This enables them to align the evidence with their trading horizon and expected holding period. This is an application of the same relative-strength principle, not a claim that one timeframe is universally correct for every trader.
This analysis should be performed at both the industry-group and individual-stock levels. A group or stock may be emerging on a short-term basis while remaining weak over the full year, or it may remain a powerful long-term leader while undergoing a normal multiweek correction. It may also display strength across multiple, or even all, timeframes. None of these readings is automatically wrong. They simply answer different questions for traders operating over different time horizons.
This is also why market commentary cannot always be overly prescriptive. Information that helps a three-day swing trader could cause a position trader to abandon a healthy long-term trend. Before acting on any rotation, determine which relative-strength horizon matches the duration of the trade you are actually trying to make.
Healthy Rotation Versus Destructive Churn
The same principle of persistence applies when evaluating rotation across the broader market. Not all rotation is bearish. In a healthy bull market, one leading group can pause while capital begins flowing into another area.
Healthy rotation preserves the market’s overall leadership structure. Former leaders consolidate constructively, hold important support levels, and build new bases while emerging groups begin producing their own leaders. The opportunity set broadens rather than simply shifting from one temporary pocket of strength to another.
Destructive churn is not merely frequent rotation. It occurs when capital moves between groups without leaving behind stable leadership. Previous leaders break support, emerging groups fail to develop, and the number of actionable stocks contracts even though the market may still appear active.
Minervini also warns that late in a bull market, money may rotate away from the true leaders and into laggard follow-on stocks or defensive groups. These secondary moves rarely match the magnitude or duration of the original leadership. A market in which leadership is narrowing or deteriorating deserves more caution than one with several strong groups advancing together.
The character of the rotation should determine your exposure. Healthy rotation supports maintaining exposure as new setups emerge and existing positions continue working. Destructive churn calls for reduced exposure, greater selectivity, and patience until the market begins producing durable leadership again.
A Practical Industry-Rotation Workflow
“It seemed only logical to me that I should try to find through fundamental analysis:
a) The strongest industry group;
b) The strongest company within that industry group.”
- Nicolas Darvas, How I Made $2,000,000 in the Stock Market
The process does not need to become complicated. A repeatable workflow can help you stay adaptable without reacting emotionally to every change in the rankings.
- Watch for clusters in the individual stock screens. Repeated appearances from companies in the same industry can reveal a developing shift before the index, sector, sub-sector or industry group makes it obvious.
- Read the major indexes. Determine whether growth, value, large-cap, small-cap, or equal-weight indexes are providing the strongest evidence of leadership.
- Narrow the search through the 11 sectors. Identify whether technology, energy, financials, healthcare, defensive sectors, or another broad area is attracting capital.
- Review the RS Dashboard and more than 140 industry groups. Compare strength across the one-week, one-month, three-month, six-month, and one-year periods.
- Look for week-over-week persistence. Treat a one-week surge as a reason to investigate, then require the strength to persist, broaden, and spread into longer timeframes.
- Connect the move to the current market themes. Determine whether a fundamental change helps explain why demand may continue and whether related groups could benefit.
- Examine the stocks creating the move. Use the Sector and Industry Group tabs in the scanner to confirm that several quality companies are participating.
- Focus on the true leaders. Prioritize the strongest one, two, or three companies based on price action, relative strength, earnings, sales, margins, and institutional characteristics.
- Demand a valid setup. Do not buy a group ranking. Buy an individual stock only when it offers a sound entry and clearly defined risk.
- Let follow-through guide exposure. If the group persists and your trades work, you can increase exposure progressively. If leadership repeatedly fails or rotates every few days, remain defensive.
This workflow combines O’Neil’s emphasis on leading groups and confirmation with Minervini’s preference for letting the best individual stocks point toward emerging leadership. It also prevents a strong short-term ranking from becoming the sole reason for entering a trade.
The Goal Is to Capture the Middle, Not Predict the Exact Turn
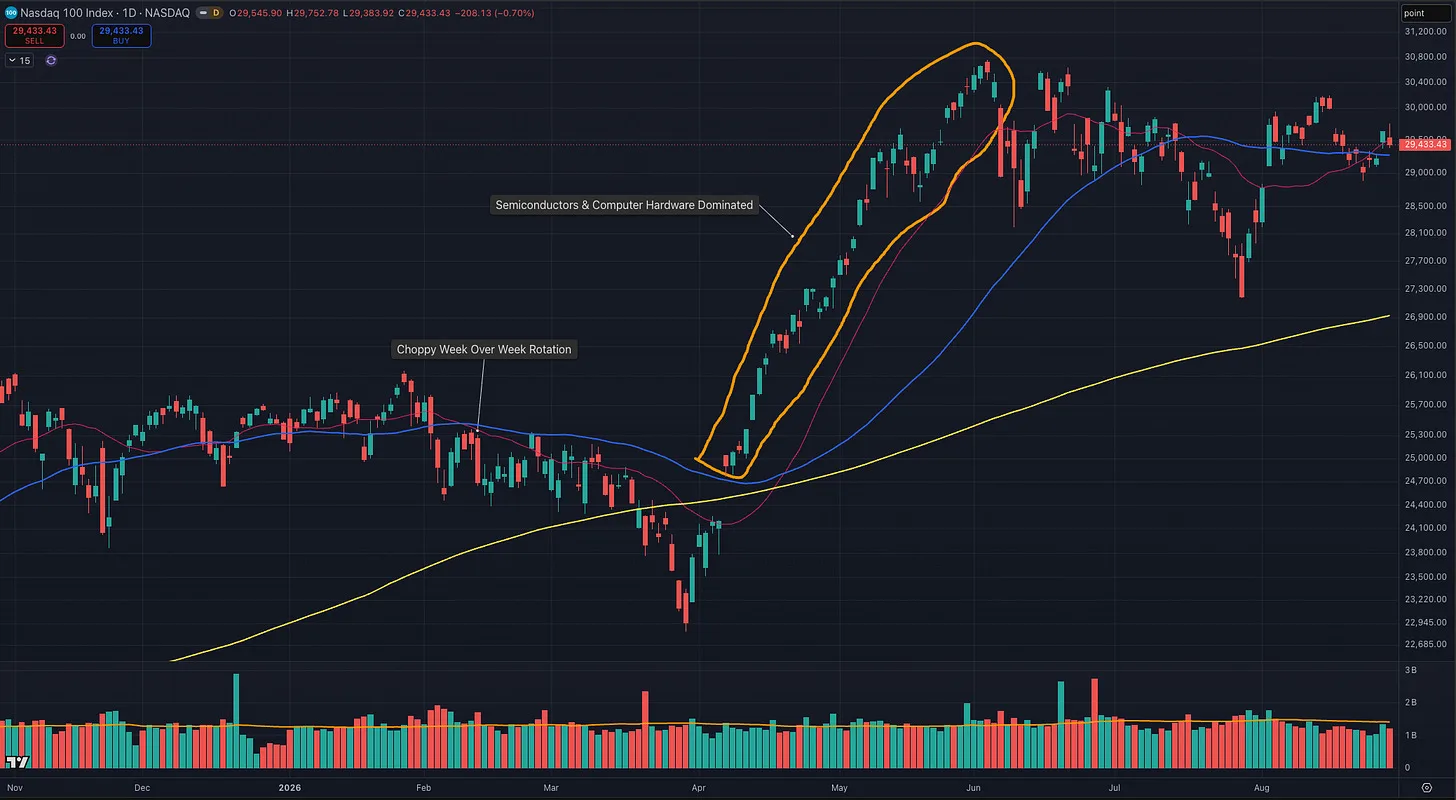
Even highly experienced traders struggle to identify industry rotation in real time. That is not necessarily a failure. Markets are uncertain, leadership develops unevenly, and the best stocks often begin moving before the evidence becomes obvious at the group level.
The goal is not to buy the exact bottom of an industry move or sell at the precise top. Just as we require an individual stock to prove itself before committing meaningful capital, we should require an emerging industry group to provide evidence that its leadership can persist. The goal is to capture the most profitable portion in the middle, after enough evidence has appeared to justify the trade but before the trend becomes exhausted.
That means we will often be a little late by design. In a durable group move, waiting for confirmation should not make us too late to participate. It should help us avoid the false starts that cause repeated small losses. On the other side of the move, we are unlikely to sell the exact top, but we can respond when leading stocks deteriorate, group participation narrows, and relative strength begins to weaken.
That requires adaptability, patience, and a willingness to accept that you will never identify every shift at the earliest possible moment. Adaptability does not mean chasing. It means listening to what price, relative strength, breadth, and the leading stocks are collectively telling you, then acting when that evidence aligns with your timeframe and risk parameters.
When the market produces durable industry leadership, there is usually enough time to participate. When leadership cannot survive from one week to the next, the correct response is often not to search harder for the next rotation. It is to recognize that the market may not currently deserve your most aggressive exposure.
Final Note: Not Every Rotation Is Yours to Trade
After spending months focused on the market’s strongest groups, sometimes you will naturally be slower to recognize what comes next. New groups often begin emerging while the existing leaders are still outperforming, so rotating earlier could mean abandoning the stronger trend before it has finished.
By the time the previous leadership breaks down and the new groups become obvious, their moves may already be underway. You can wait for another proper setup, participate later, or miss the move entirely. None of those outcomes is automatically a mistake.
Some rotations occur because growth leadership is deteriorating and capital is moving into defensive, slower-growth areas. If your edge is trading growth stocks, that strength provides useful information, but it does not automatically require you to buy those groups. Sometimes the correct response is to reduce exposure and wait for strong growth leadership to return.
Watch: How I Track Industry-Group Rotation
More in Legendary Traders
All Legendary Traders articles →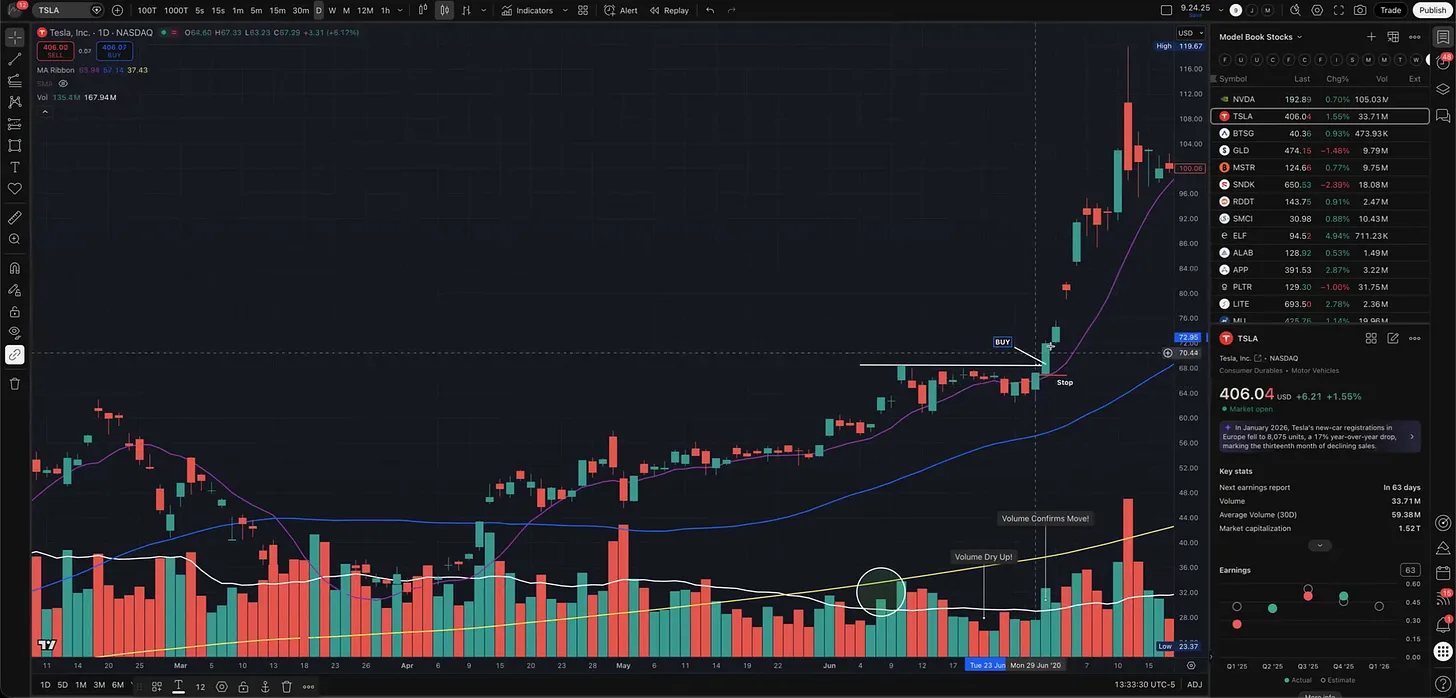
Sep 17, 2026 · Legendary Traders
4 Legendary Traders. 4 Breakout Entry Tactics.
A chart-by-chart breakdown of Minervini’s VCP, O’Neil’s cup with handle, Darvas’s box breakout, and Kullamägi’s opening range breakout.
- how to make money in stocks
- IBD
- Momentum Trading
- VCP
- technical analysis
- CANSLIM
- Trading Setups
- position trading
Sep 6, 2026 · Legendary Traders
Market Wizard David Ryan: How He Made 1,379% in Three Years
Inside the growth-stock approach of William O’Neil’s protégé and three-time U.S. Investing Champion, from precise entries to holding major winners.
- IBD
- fundamental analysis
- Learn Trading
- technical analysis
- position trading
- David Ryan
- Market Wizard
- CAN SLIM
Aug 25, 2026 · Legendary Traders
Why Most Traders Fail Even With a Winning System: The Edge Almost Everyone Ignores
Richard Dennis, Paul Tudor Jones, Ed Seykota, Larry Hite, and Van Tharp all point to the same uncomfortable truth: the trader is part of the system.
- learn to trade
- Larry Hite
- Investing
- ed seykota
- Trading
- psychology of trading
- Dr. Van K. Tharp
- Richard Dennis