You Can Memorize Every Chart Pattern and Still Miss This Setup
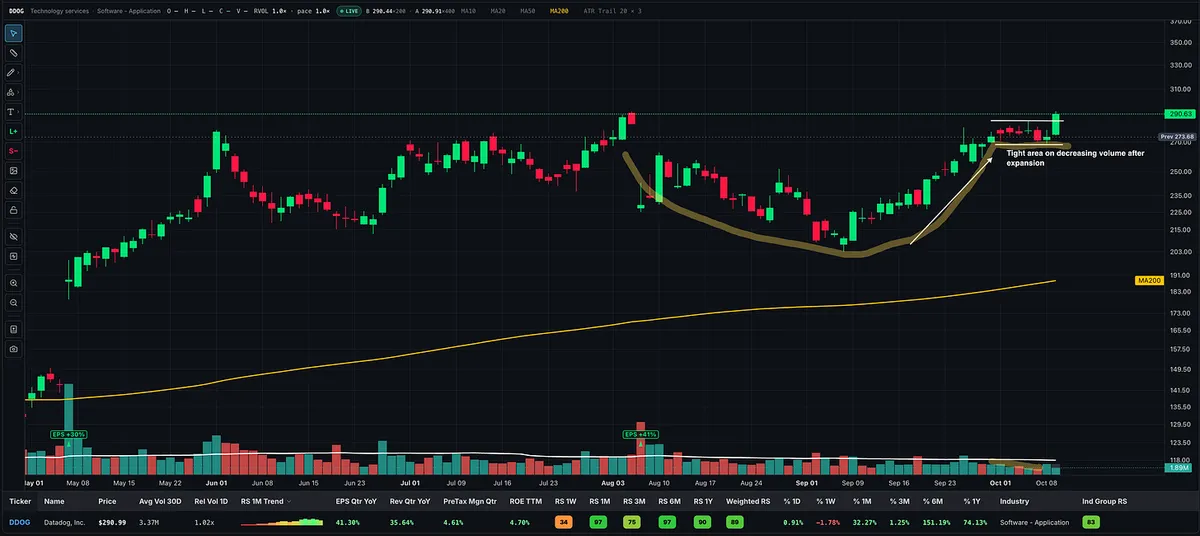
Look at DDOG today.
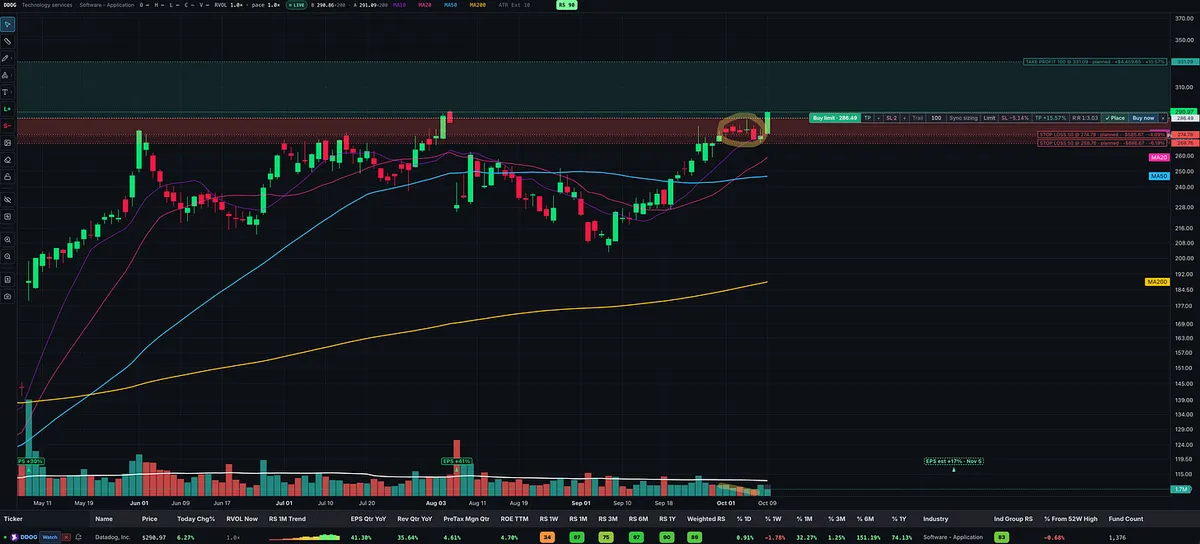
From October 1 through October 8, price formed a tight little handle, moving sideways and slightly lower while finding support near the rising 10-day moving average. Volume dried up during the consolidation.
Today, price is breaking through the high of that handle with a strong momentum move toward its prior highs.
This is the kind of setup I love because I have a clear line in the sand where I'm wrong.
I can use today's low for a tighter stop, the low of the handle for a little more breathing room, or split my position between the two.
Now here's the lesson.
We spend so much time studying cup-with-handles, VCPs, flags, pennants, and other chart patterns, but what do they all have in common?
1. Strong upside price movement, ideally on expanding volume.
2. Tight consolidation or a controlled pullback, with volume drying up.
3. Renewed price strength through resistance, ideally with volume expanding again.
4. A logical place to define risk if the setup fails.
You don't always need a picture-perfect textbook pattern. You need to understand what price and volume are telling you.
And you don't need to know how high a stock will go. You need to know where you're wrong and whether the potential reward justifies the risk.
That's how I look for opportunities where a relatively small, controlled loss could be offset by a winner worth several multiples of my initial risk.