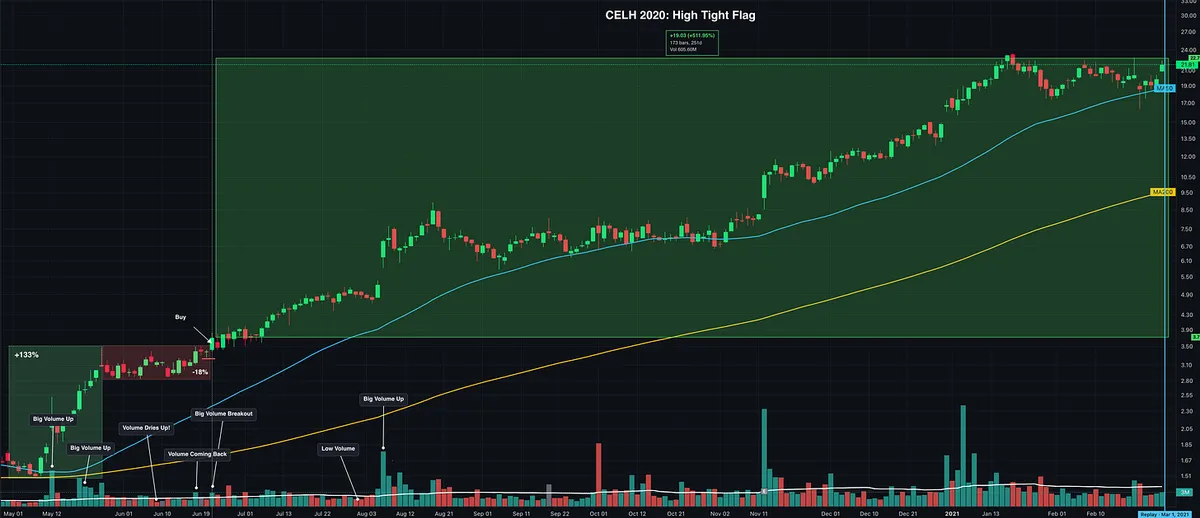
The Stock Was Up 133%. Nobody Chose Buy. Here's What Happened Next.
First, thank you to everyone who participated in the chart challenge! Not a single person selected Buy. Most chose to wait or avoid the trade, and I understand why.
The stock had already rallied 133% in approximately four weeks. Surely it was too extended to buy, right?
Not necessarily.
The stock was CELH, and what you were looking at was a High Tight Flag, a rare but powerful chart pattern documented by William O'Neil.
In How to Make Money in Stocks, O'Neil describes the characteristics:
Explosive advance: Generally 100% to 120% in just 4 to 8 weeks.
Consolidation: A sideways correction of roughly 10% to 25%, typically lasting 3 to 5 weeks.
Volume: Ideally, selling pressure diminishes during the consolidation, followed by renewed buying demand as price breaks out.
Notice what happened on the chart.
After that enormous advance, the stock stopped climbing and began consolidating. Price held relatively tight, volume quieted, and a new potential buy point developed.
The arrow marked the breakout above that consolidation.
The overall market was in a Stage 2 uptrend, and CELH belonged to a strong industry group. The broader conditions were supportive.
O'Neil documented examples of these formations dating back to 1915, including some of history's greatest stock market winners. He even bought Syntex from a High, Tight Flag in 1963 before its subsequent enormous advance.
But he also warned that these patterns are extremely risky and difficult to interpret correctly. A valid-looking setup can still fail.
The opportunity isn't simply buying a stock because it doubled. It's recognizing when that explosive advance produces a new, actionable setup with defined risk and potentially asymmetric reward.
If you didn't recognize it, no big deal. That's the whole point of studying historical winners and putting in the reps.
Go back through O'Neil's charts and study these formations. You'll start recognizing similarities in how exceptional stocks behave.
Now look at the second chart and see what happened next.
Here's the biggest takeaway:
Too many traders dismiss potentially exceptional setups simply because a stock has already made a massive advance. But a stock can double, consolidate, and offer an entirely new buying opportunity.
I've written a deeper article explaining this concept, but one of the best ways to train your eye is to study historical winners using Chart Bar Replay. Look at the charts BEFORE the breakout, make your own assessment, then advance the chart to see what happened next.
STOP thinking big moves = extended
START thinking extended = distance from the buy point