Momentum Trading Strategy

Notes

Chart Setups & Entries

When and where to buy a stock you have already found: chart patterns, buy points and entry tactics.

Showing 21–40 of 185 notes

View on Substack ↗

A Busy Account Doesn’t Mean You’re Making Progress.

Charts open. Orders going in. Positions constantly changing.

You feel productive. But your equity curve is going nowhere.

One place to look: Are you taking qualifying trades, or lowering your standards to find something to buy?

That can show up as:

  • Buying a setup before it has finished forming.

  • Overlooking weak earnings, sales, or relative strength.

  • Chasing a stock after the proper entry has passed.

  • Making exceptions to your growth stock criteria because you’re tired of waiting.

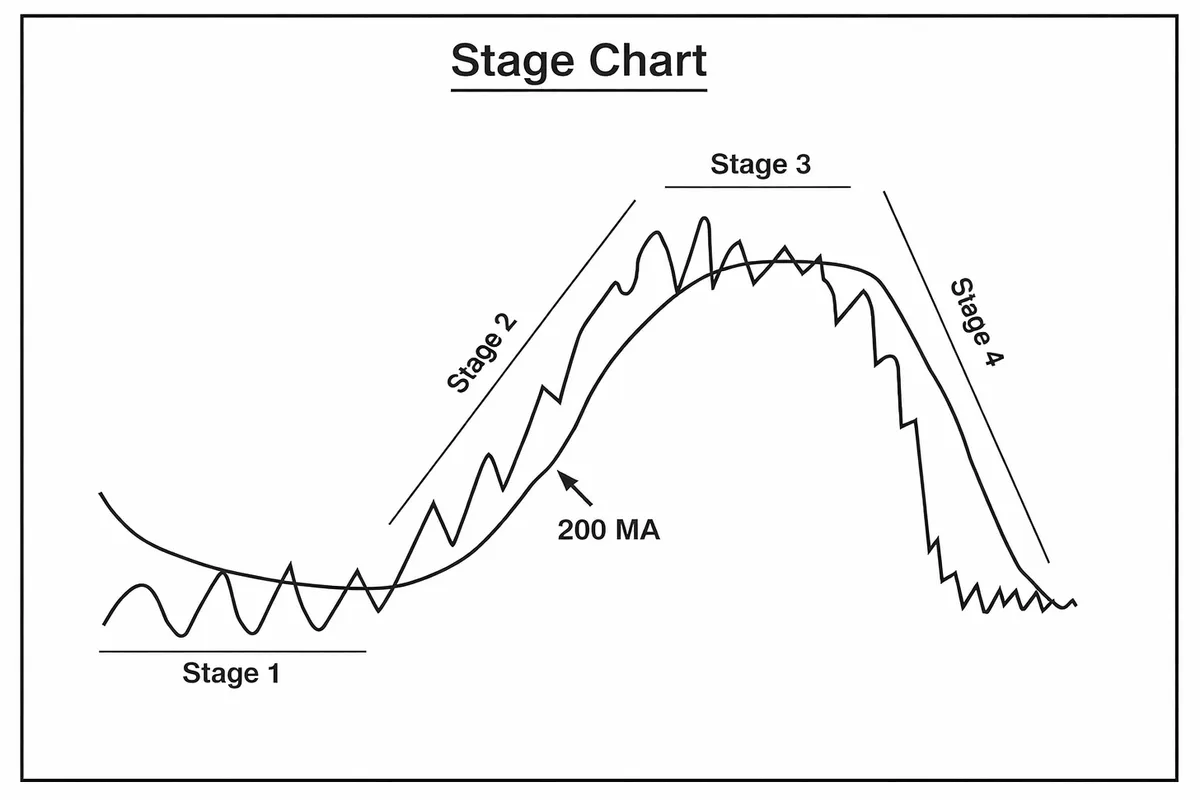
For my approach, a confirmed Stage 2 uptrend is a starting requirement. Stage 1 can tie up capital for months. Stage 3 brings topping and distribution risk. Stage 4 puts you on the wrong side of a declining trend.

I want to participate in the advancing phase.

But Stage 2 alone isn’t a buy signal.

I still need a qualifying setup, a properly timed entry, and clearly defined risk. Even a strong stock in an uptrend can become a poor trade if I buy it carelessly.

When those pieces aren’t there, I can keep researching, building watchlists, and waiting. That’s productive work, too.

The market doesn’t owe me a setup because I’m ready to trade. My standards and what the market is willing to give will determine my activity.
View on Substack ↗

The Pullback You Fear May Be the Setup You Want.

Ever watched a stock run, wished you had bought it, and told yourself you’d wait for a pullback?

Then the pullback arrives, and suddenly you’re afraid to touch it.

That’s where price and volume deserve a closer look.

In A Complete Guide to Volume Price Analysis, Anna Coulling emphasizes reading them together. Volume helps us assess the activity behind the move.

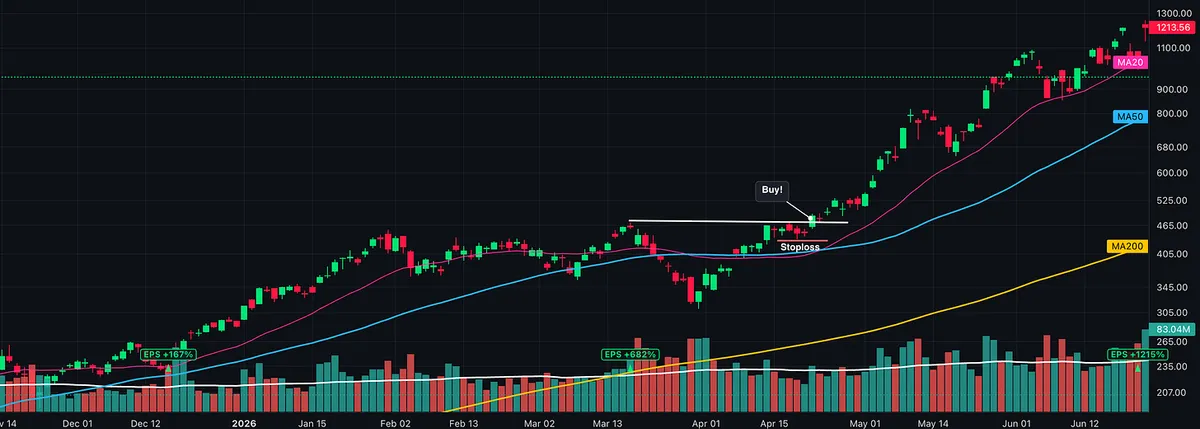
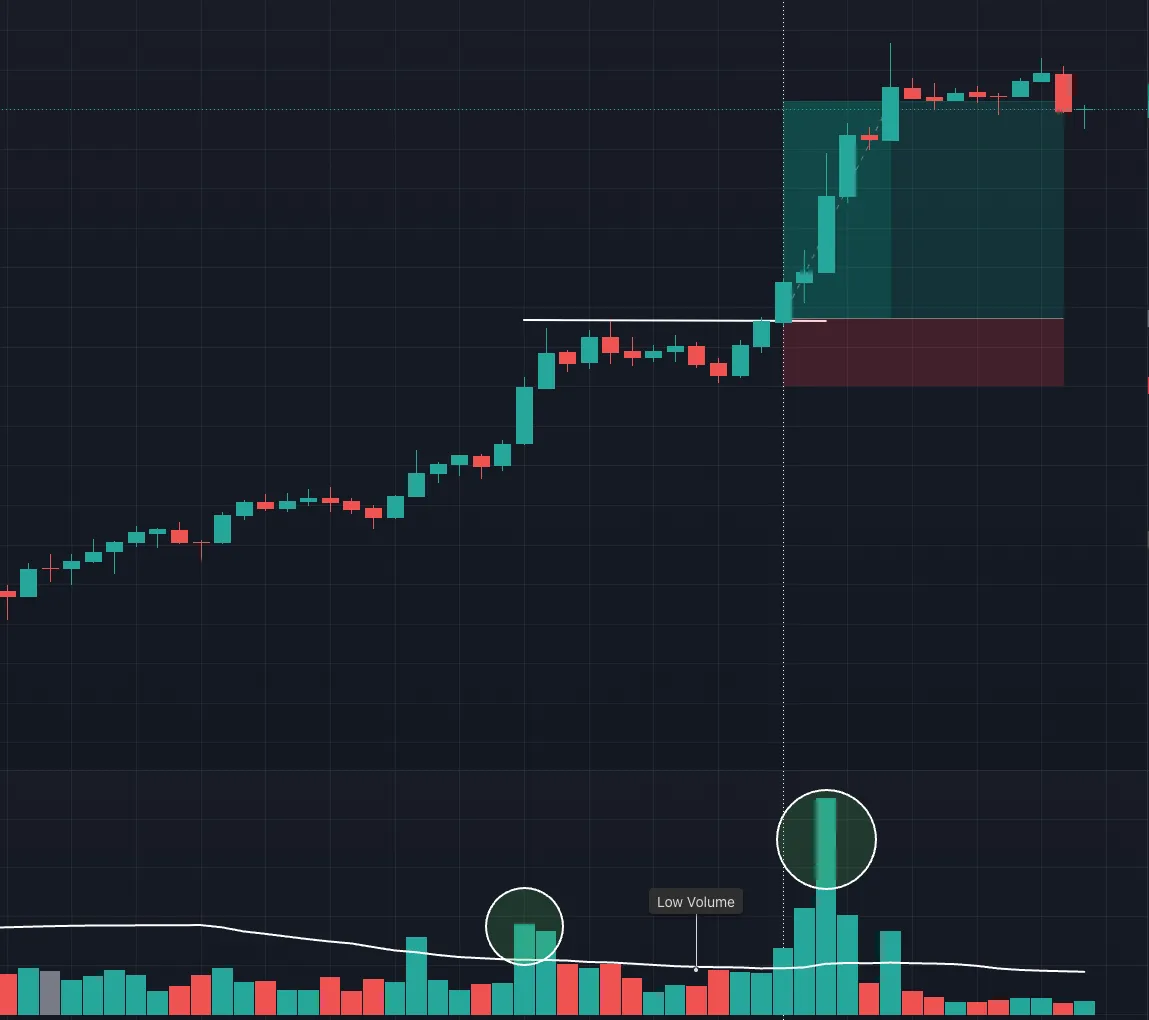
Look at the sequence in this chart:

1. Price advances as volume expands. Larger up candles accompany increased activity. Price is making meaningful upward progress.

2. Price pauses and volume dries up. The stock gives back relatively little ground, consolidates near its highs, and trading activity fades. That combination can suggest selling pressure is easing.

3. Price clears resistance and volume expands again. The breakout develops into a strong advance, with substantially higher volume supporting the move.

The quiet middle step deserves your attention.

A controlled pullback on diminishing volume tells a different story from a sharp decline that breaks support on heavy volume. Both can have red candles, but the context matters.

This is also why a big volume reading alone isn’t enough. I want to see where the volume appears and how price responds to it.

In this example, the quieter consolidation was followed by renewed strength.

Before you fear the next pullback or sideways pause, check its volume. It may be part of the setup you were waiting for.

View on Substack ↗

Four Stages. Only One Where We Buy.

If you call yourself a growth stock investor or a momentum trader, this should be a core rule:

When we trade the long side, we buy stocks entering or advancing through Stage 2.

We do not buy in Stage 1, Stage 3, or Stage 4.

Stan Weinstein laid out the framework in his 1988 book, Secrets for Profiting in Bull and Bear Markets. Decades later, the lesson remains relevant:

• Stage 1: Basing. The decline has lost momentum, but a sustained uptrend has yet to emerge. Buying too early can leave your money sitting idle for months or even years.

• Stage 2: Advancing. The stock breaks out of its base and establishes an uptrend. This is where we look for buying opportunities.

• Stage 3: Topping. The advance loses momentum. The story may still sound great, and earnings may still look strong, while the chart starts showing deterioration.

• Stage 4: Declining. Support breaks and the stock trends lower. What looks cheap can become much cheaper.

We may use different entry tactics, moving averages, and holding periods. The shared discipline is buying strength and respecting the trend. Fighting that discipline can do serious damage to your account.

Stage 2 is a requirement, not an automatic buy signal. You still need a proper entry, a protective stop, and a position size that controls your risk. Chasing an extended stock can turn the right trend into the wrong trade.

Weinstein’s warning about Stage 4 went beyond avoiding new purchases: he also urged traders not to keep holding stocks once they entered that declining phase.

Resist the urge to get in early during Stage 1. Resist the exciting news during Stage 3. Never let a Stage 4 “bargain” pull you away from your process.

Let the stock prove its strength before you commit your money.

View on Substack ↗

“It’s Already Gone Up Too Much.” Look Again.

Sometimes, the move that makes you dismiss a stock is the move that should put it on your watchlist.

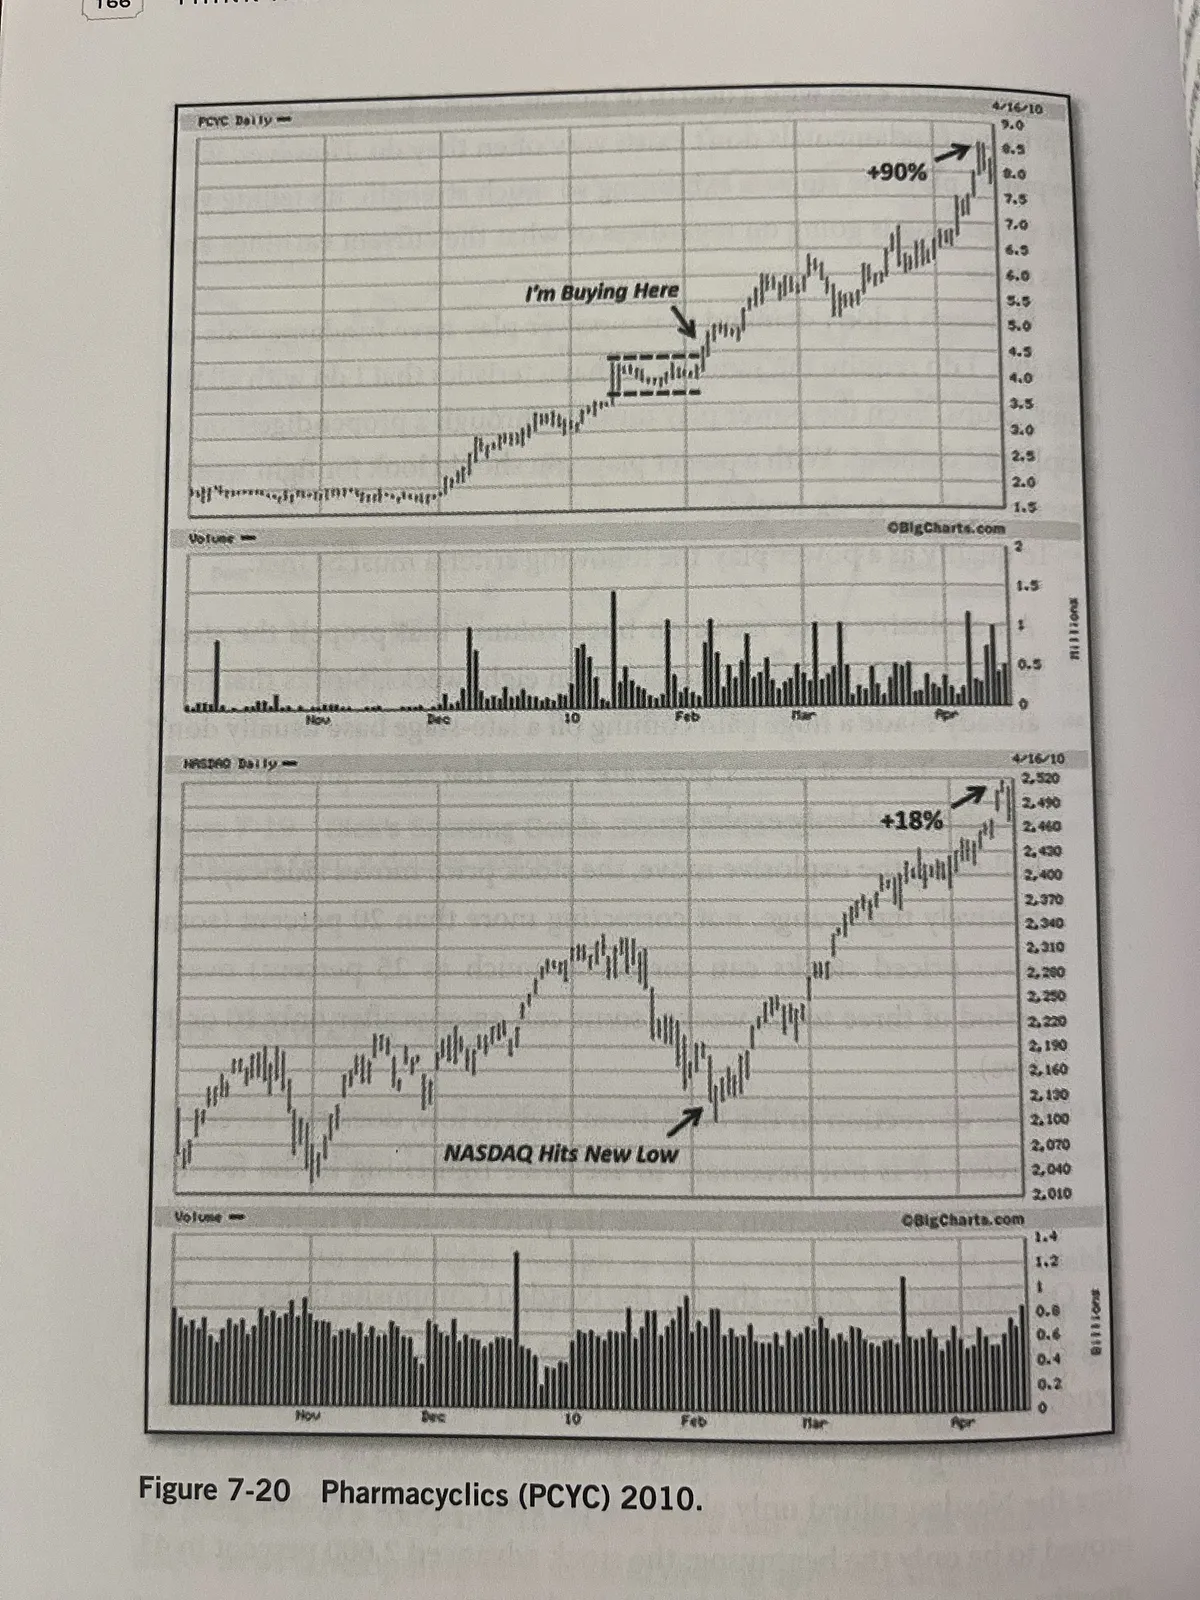
Look at Pharmacyclics (PCYC) in this 2010 chart from Mark Minervini’s book. The stock had already made a powerful advance before settling into a tight, sideways pause. While the Nasdaq was selling off toward a correction low, PCYC was holding up remarkably well.

That’s a form of relative strength. The market was struggling, but the stock was refusing to give back much ground.

When the market bottomed and started turning higher, PCYC was already breaking out to new highs. Notice where Minervini marks his purchase. He wasn’t buying the bottom or chasing the initial surge. He was buying as the stock emerged from that tight consolidation.

A lot of people look at the earlier advance and think, “I missed it. It’s already made its run.” But that strength can be the first evidence of a potential market leader, not proof that the opportunity is over.

There’s a difference between a stock that has already made a big move and a stock that is extended from a proper entry.

The prior advance gets my attention. The way the stock handles its next pause helps determine whether there’s a trade. Does it hold up while the market weakens? Does it tighten up rather than fall apart?

This is exactly what I still look for today. Many of the stocks I’ve shared had already made substantial advances before forming their next setup. During that quiet pause, when other people lose interest and move on, I’m often paying closer attention.

Not every setup works. But the same patterns and characteristics continue to appear.

Don’t automatically cross a stock off your list because it already ran. Watch what it does next.

View on Substack ↗

The Gap That Looks “Too High” May Be the Start.

A stock gaps higher, and your first thought is, “I missed it.”

Not so fast.

I want to know what happened before the gap, and what’s driving it.

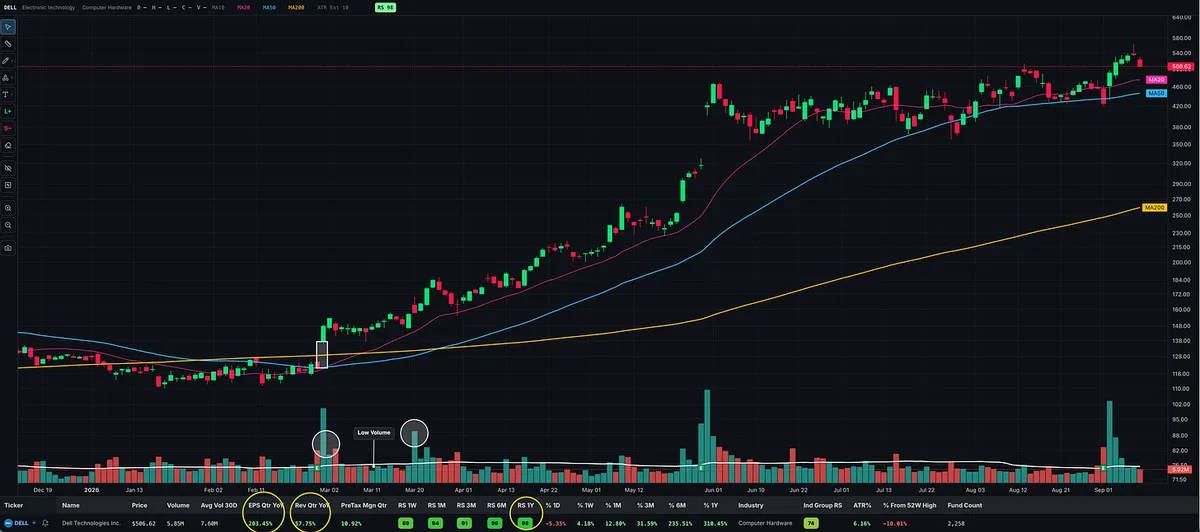
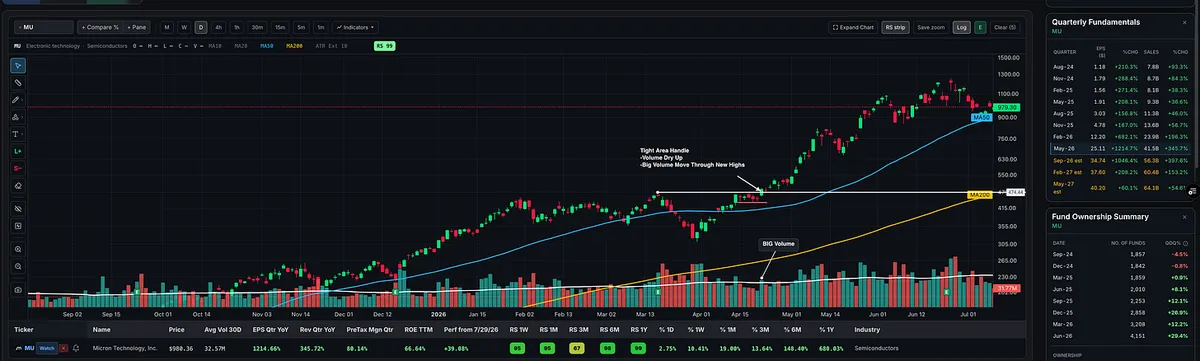
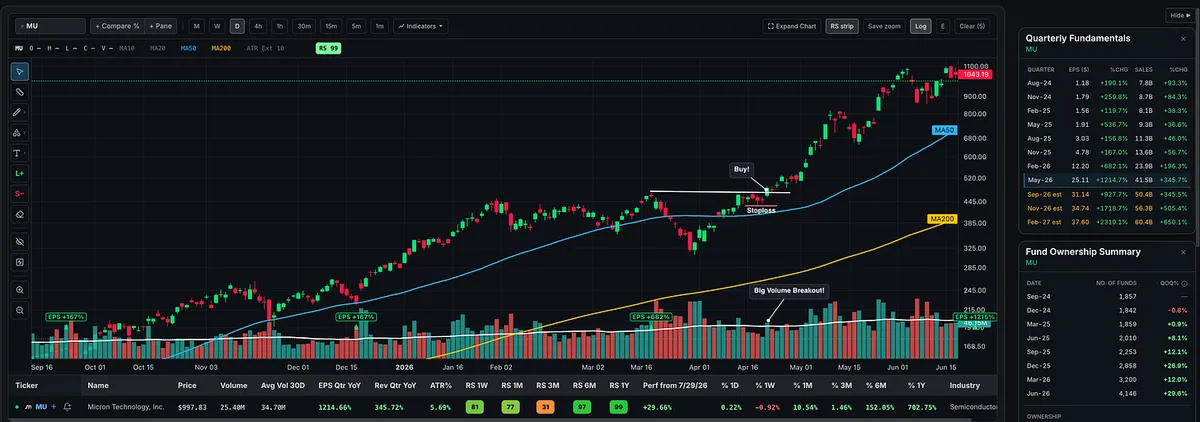
Is it emerging from a base on huge volume after a strong earnings and sales report? Is there a major industry shift, like the demand for memory supporting the AI buildout? Is the company delivering a meaningful turnaround?

Did something significant catch the market off guard, with the growth fundamentals to support a sustained advance?

I’m looking for something new that changes the outlook. That’s a central part of the N in CAN SLIM.

With that context, a powerful gap can be an extremely bullish signal. The market may be reacting to a change it hadn’t fully priced in.

That doesn’t mean I have to buy immediately.

Maybe the stock runs for a few days, then forms a tight consolidation. Or it pulls back gently on light volume, holds most of its gap, and starts moving higher again. Some traders enter as strength returns after the pullback; others wait for a breakout to new highs.

There are different ways to enter. The gap gets my attention, but I still want a proper setup to act on.

Now consider a stock that has already been a leader for months. Its advance accelerates, it becomes stretched far above its base, and then it gaps sharply higher on enormous volume.

That can be an exhaustion warning, potentially part of a climax top. Even outstanding earnings don’t erase that possibility.

Just as I consider the overall market environment, I have to consider the individual stock’s history, fundamentals, and position within its trend.

A huge gap can signal a fresh opportunity or warn that a move is nearing exhaustion. The context gives it meaning.

View on Substack ↗

Tightness Is the Setup. Leadership Is the Filter.

A beautiful chart pattern can still belong to the wrong stock.

A laggard can form a cup. A weak company can get tight. Recognizing the shape is only the beginning.

What matters is WHAT is getting tight.

William O’Neil combined chart analysis with strong earnings and sales growth, relative strength, institutional sponsorship, and the other characteristics he found in the market’s biggest winners.

The quality of the stock and the quality of the setup belonged together.

He described tight price action and drying-up volume at key points in a base as constructive. They can signal that selling pressure has diminished and less stock is coming to market.

Mark Minervini applies a similar principle. His SEPA process first qualifies the stock’s trend, then evaluates fundamentals and leadership characteristics. The VCP helps identify a precise entry as price swings contract and volume dries up.

That’s the combination I want: a strong candidate developing a setup where I can define my entry and risk.

A pretty pattern doesn’t turn a laggard into a leader.

And even a leader getting tight doesn’t automatically make it a buy. I still want price confirmation at the pivot, evidence of demand, and a market environment that supports the trade.

Strong fundamentals never excuse a failed setup or override my exit rules.

Leadership gets the stock onto my watchlist. Tightness gets me ready. The move through the pivot gives me the trigger.

View on Substack ↗

“Buy Low” Can Keep You Buying All the Way Down

Stan Weinstein wrote in Secrets for Profiting in Bull and Bear Markets:

“Buy low, sell high is a cliche, not a blueprint for action.”

A stock falls from $100 to $70. You call it a bargain.

At $50, it looks even cheaper.

But the chart keeps deteriorating, and the price you remember keeps convincing you to buy.

Weinstein’s approach was to buy strength as a stock broke out of a base into Stage 2, its advancing phase, supported by strong volume.

That often meant paying more than someone who bought near the bottom.

His newsletter’s motto was “The Tape Tells All.”

His point was that prices already reflect known information and expectations. A stock can begin advancing before the headlines or reported earnings make the opportunity feel comfortable.

That’s why I want to see what price and volume are telling me.

I still need a proper entry, a logical stop, and controlled risk. An impressive advance alone doesn’t mean chasing.

But I’m willing to pay a higher price when the stock offers a better setup.

The lowest price and the best buying opportunity aren’t the same thing.

View on Substack ↗

Stop Trading the Chart You Hope to See

You find a stock with strong earnings, strong relative strength, and a base that’s tightening up. You can already picture the breakout.

You’ve watched it for weeks. You don’t want to miss it. So you buy before your entry signal appears.

Peter Brandt addresses this in Diary of a Professional Commodity Trader:

“Do not anticipate what a chart might become. Make a chart prove itself.”

That lesson applies directly to growth stock and momentum trading.

O’Neil emphasized waiting for a stock to reach a proper buy point. Minervini warned against forcing trades because a setup looked “close enough.”

The temptation is subtle. You start with a clear plan, then gradually lower the requirements because you’re excited about the stock.

“Another day of tightening would be better, but this should work.”

“It hasn’t reached my trigger, but I’ll get a better price.”

Eventually, you’re trading what you expect to happen while skipping the conditions you originally required.

A valid early entry still has its own trigger, structure, and risk plan. Simply getting impatient with a developing base doesn’t create one.

A promising setup earns a place on my watchlist. It earns my money when it meets my entry rules.

View on Substack ↗

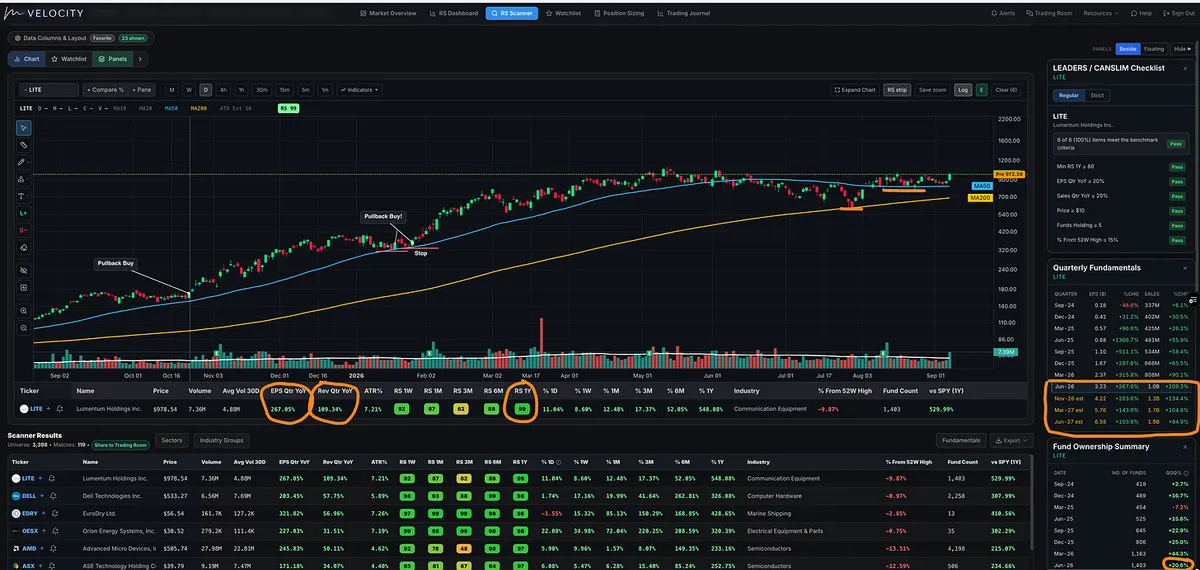
LITE is getting interesting again.

LITE rallied off its 200-day moving average when the market made its low on July 29.

Unlike a lot of the other prior big winners, it has since reclaimed its 50-day / 10-week moving average and continued to hold support. Now it sits less than 10% from all-time highs.

And the fundamentals are still extremely strong.

LITE has been putting up triple-digit earnings growth, triple-digit sales growth, and carries a 99 one-year Relative Strength Rating.

Institutional sponsorship has also been expanding aggressively, with the number of funds owning the stock growing roughly +20% quarter over quarter.

We saw bigger volume coming off the lows and around earnings. Then, as the stock moved sideways and found support around the 50-day, volume dried up considerably.

Yesterday, big volume came back in as LITE pushed toward the top of the consolidation.

Back in January, people told me LITE looked too volatile.

Then they missed the next roughly 100% leg higher.

They told me the same thing back in October 2025.

Welcome to growth stock and momentum trading. 😉

The biggest winners are rarely going to look comfortable.

View on Substack ↗

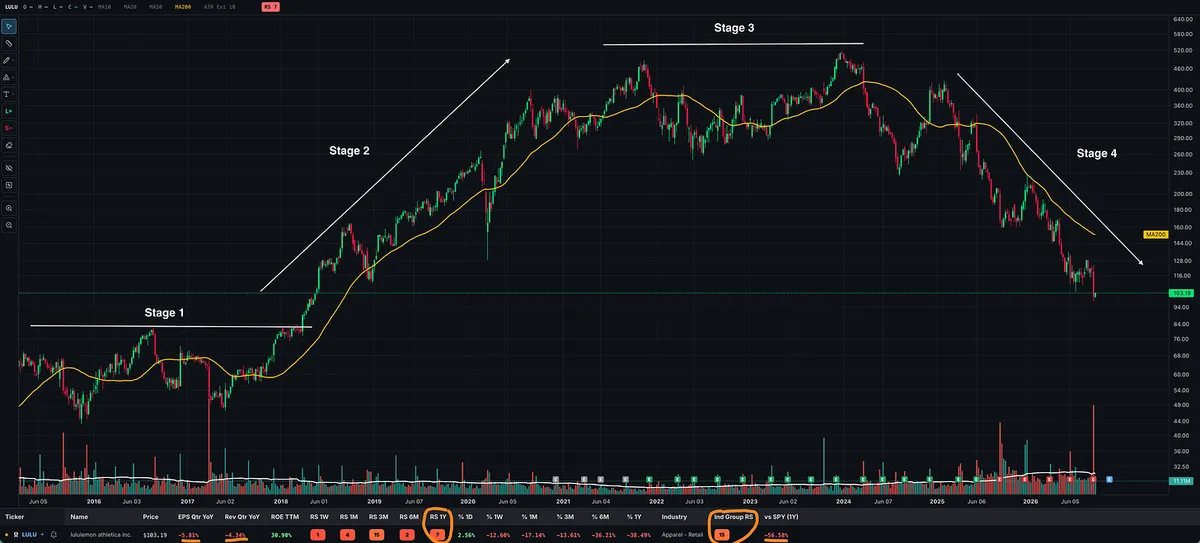
Never buy a stock because it appears cheap after getting smashed

Stan Weinstein wrote that in Secrets for Profiting in Bull and Bear Markets. LULU shows why the warning matters.

Weinstein’s framework follows four stages:

Stage 1: The base.

Stage 2: The advance.

Stage 3: The topping phase.

Stage 4: The decline.

On this chart, LULU is making lower highs and lower lows beneath a falling moving average.

Yet every lower price can tempt someone into calling it a better deal. They remember the old high, love the brand, and start averaging down while the chart keeps deteriorating.

The old price doesn’t tell you where the decline will end.

Averaging down increases your exposure. It doesn’t turn Stage 4 into Stage 2.

I want to see a proper base develop and evidence of a new advance. A stock has to earn its place back on my buy list.

Being cheaper than it used to be isn’t enough. If the chart is still breaking down, that “discount” can keep getting bigger.

View on Substack ↗

The Best Setups Often Look the Scariest

Some of the strongest stocks will look expensive by the time you notice them.

That doesn’t automatically make them bad trades.

I want stocks showing relative strength. A strong advance gets my attention, then I look for a proper setup where I can define my entry and risk.

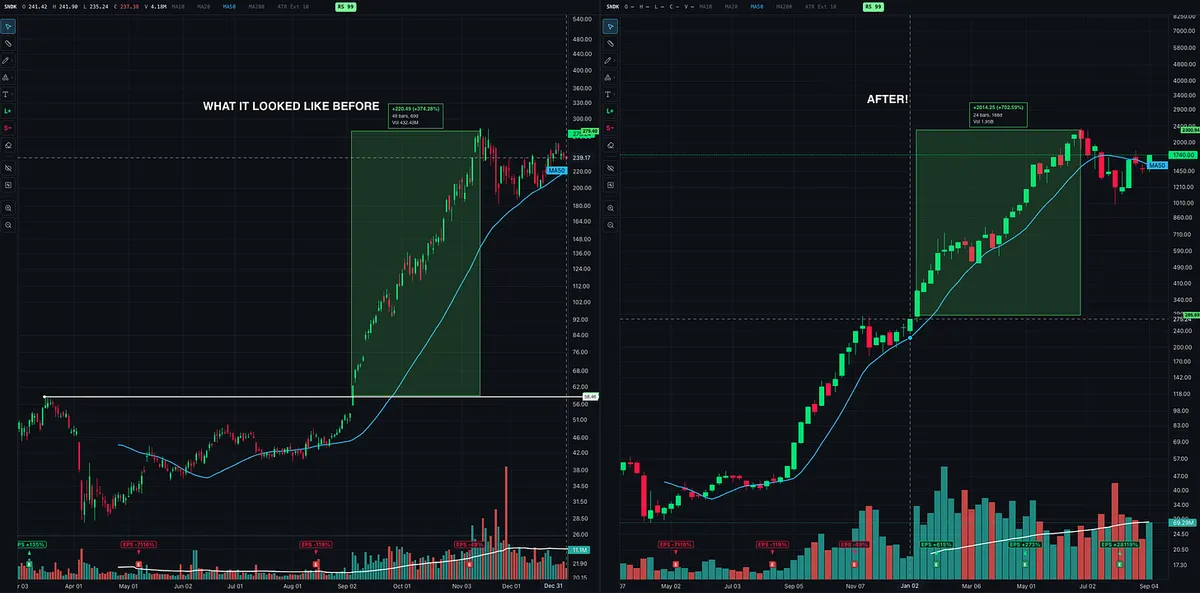
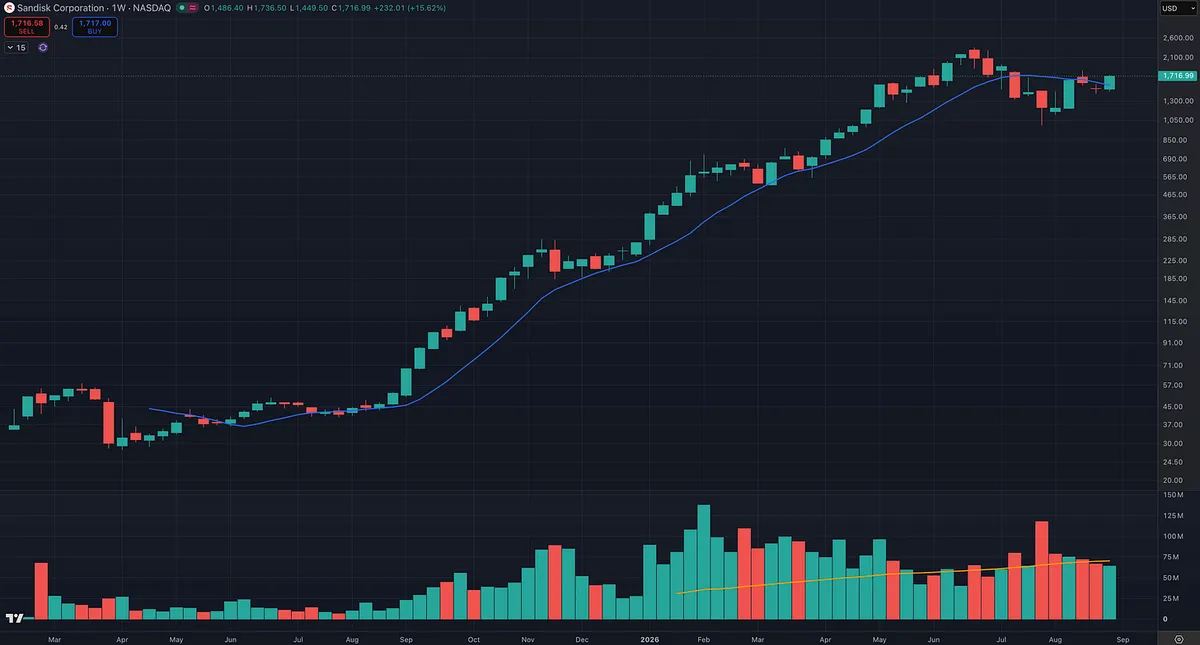
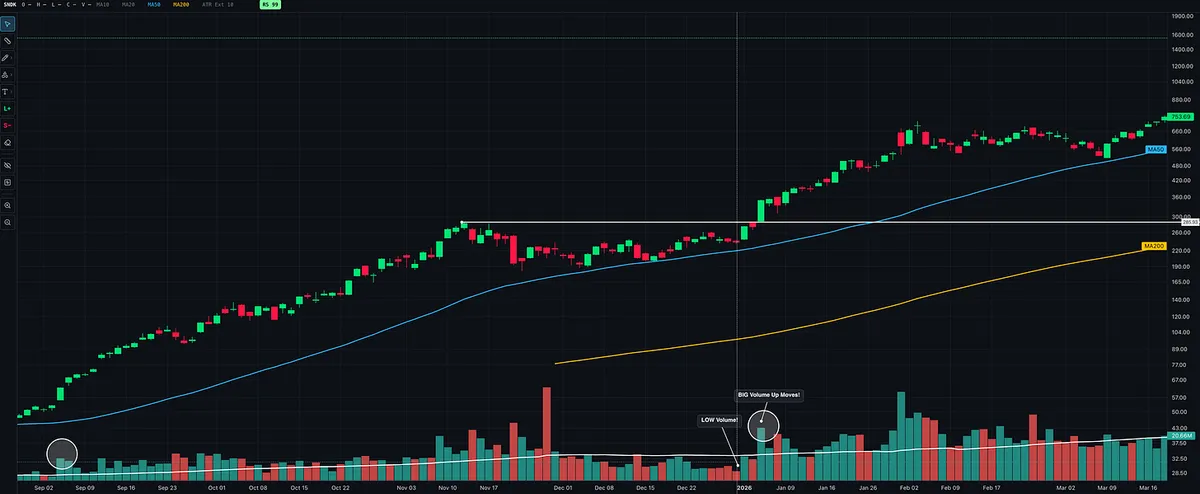
Look at SNDK. The first highlighted advance was roughly 374%. It then consolidated, and the next marked advance was roughly 703% to the later peak.

If I dismissed it because it had “already gone up too much,” I would have stopped looking before the next setup developed.

The trap is letting the price you could have paid months ago determine whether today’s opportunity deserves consideration.

A strong stock still needs a proper entry, a logical stop, and a position size that fits the risk. Its earlier advance doesn’t replace any of that.

Don’t confuse discomfort with danger. Judge the setup in front of you, not the price you wish you had paid.

View on Substack ↗

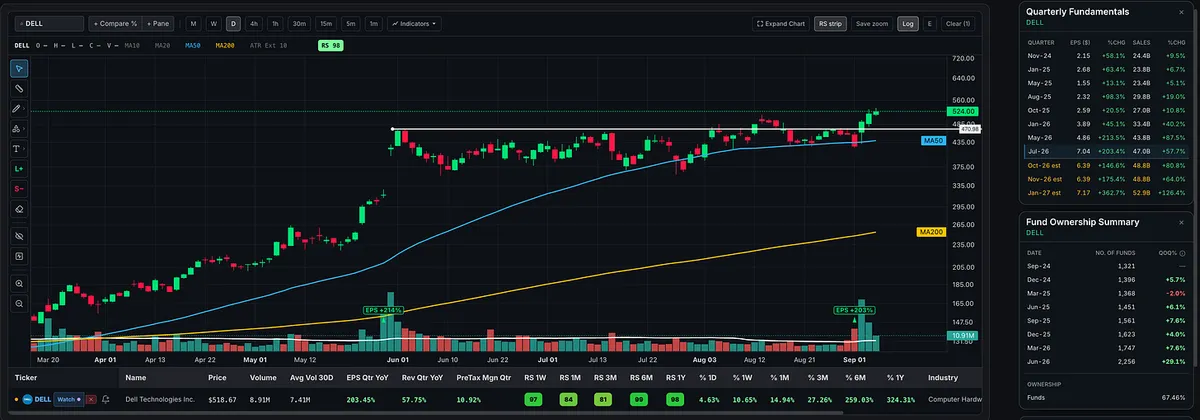
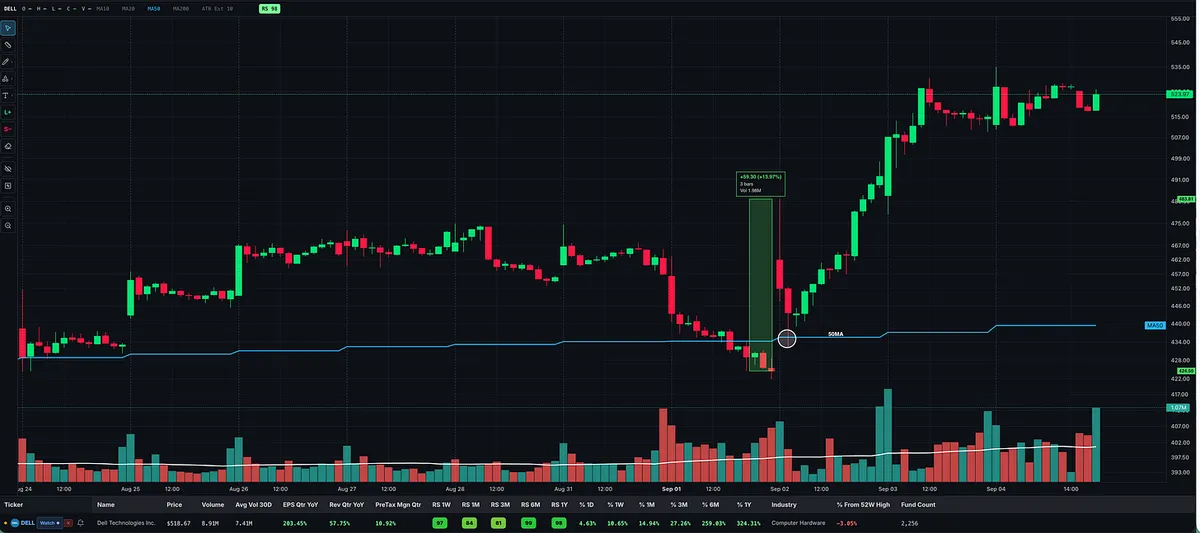
DELL Shook Everyone Out. Now It’s Breaking Out.

I think DELL gets the award for shaking the most people out this week.

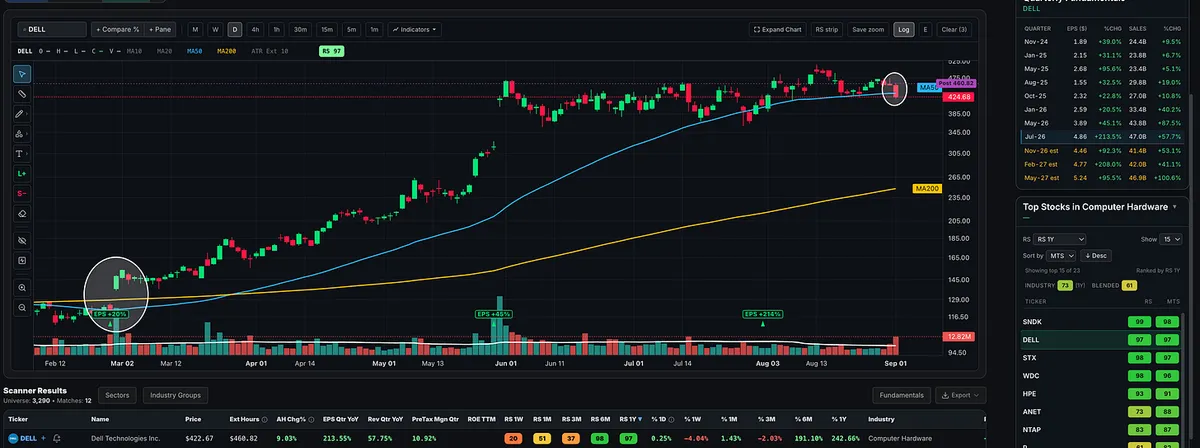
The 30-minute chart tells the story. DELL gapped up after earnings, completely reversed, gave up the entire gap, and briefly undercut its 50-day moving average. Anyone who chased the initial gap or placed an obvious stop near the 50-day probably got taken out.

Then DELL snapped back, reclaimed the 50-day, and rallied nearly $100 from Tuesday’s low.

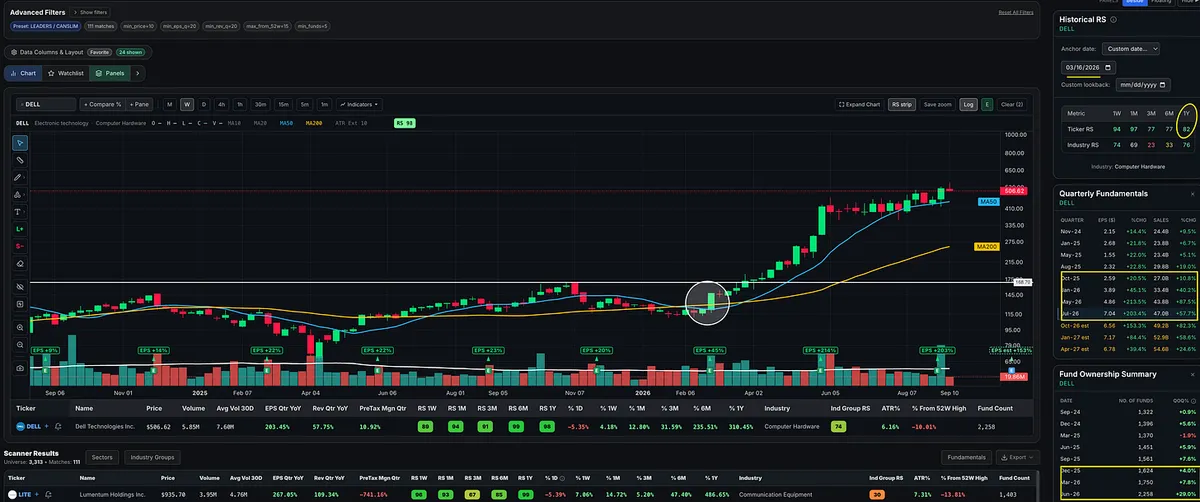
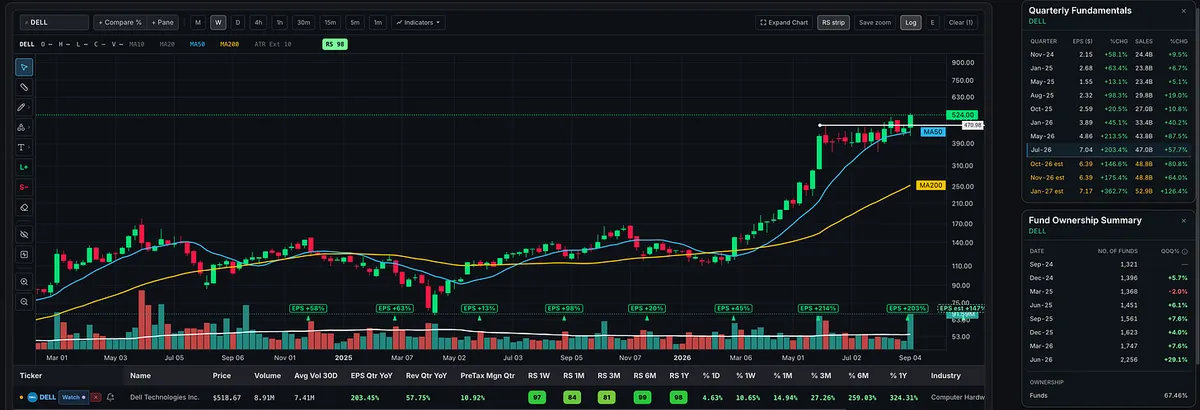
The daily chart shows how violent the shakeout was. On the weekly chart, it looks like nothing more than a brief pause within the larger uptrend.

The breakout is still developing, but this is a great example of a strong stock doing everything possible to shake people out before starting its next move.

Good job, DELL. 😂

View on Substack ↗

This Is What Demand Looks Like

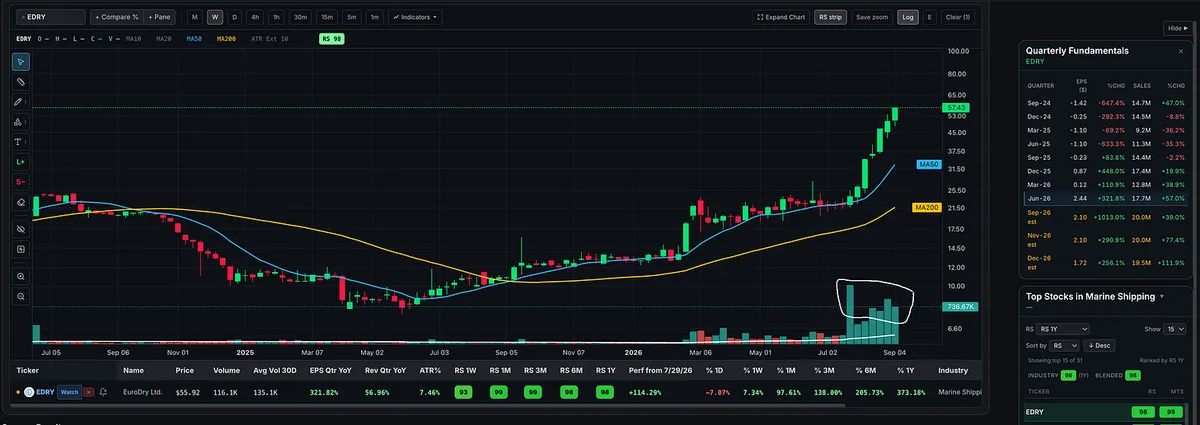
Look at that volume coming into EDRY.

William O’Neil taught that volume is the best measure of supply and demand and institutional sponsorship. Mark Minervini makes the same point: a proper Stage 2 advance should show significant volume on big up days and weeks, with lighter volume during normal pullbacks.

That is exactly what this weekly chart is showing. As EDRY broke out and accelerated, volume expanded dramatically. Price and volume rising together tell you that demand is overwhelming supply.

Train your eye to recognize this kind of volume expansion. Big price moves need fuel, and volume shows you when serious buyers are stepping in.

View on Substack ↗

You Can’t Trade What You Haven’t Learned to See

Many traders simply haven’t spent enough time studying charts to consistently recognize great setups. That skill takes practice, repetition, and studying how price and volume behave before, during, and after a move.

There is nothing wrong with mastering just one or two setups. If your thing is VCPs, flat-base breakouts, or cup-with-handles, you can build an entire trading career around those patterns. BUT a smaller playbook generally means fewer opportunities. You have to be willing to sit on your hands until your setup appears.

A broader playbook that includes bull flags, pennants, and upside reversals on pullbacks can give you more opportunities. But knowing the names of more patterns doesn’t mean you’ve developed the skill to trade them. The problem I see is traders who only understand one or two setups trying to trade as though they’ve mastered ten. Their activity exceeds their skill.

With enough chart time, you also begin to realize that a setup doesn’t always need a perfect name. You start recognizing the underlying price and volume behavior: a powerful advance on heavy volume, followed by a controlled pullback or tight consolidation as volume contracts, then renewed buying as price pushes into new highs.

That tight area might be a handle, the final contraction in a VCP, three weeks tight, or a short flag. The shapes differ, but many share the same characteristics: strong demand, evidence of selling pressure drying up, and buyers returning to support the next advance. You learn to recognize where an entry makes sense and where the setup would be invalidated.

There is both an art and a science to reading charts. Spend time studying successful setups and failed ones, learning their differences, and understanding the price action behind the pattern. Expand your trading activity only as your ability develops.

These price and volume patterns have appeared in winning stocks for more than a hundred years. They’re unlikely to disappear anytime soon. The time you spend studying them is an investment in a skill you can use throughout your trading career.

View on Substack ↗

Stocks Like SNDK Are Nothing New

Over the last year, I’ve heard people talk about massive winners like SNDK as though these moves are something unique to modern markets. Open William O’Neil’s How to Make Money in Stocks and study the historical charts. You’ll find stock after stock, across more than a century, that looks remarkably similar to the leaders we see today.

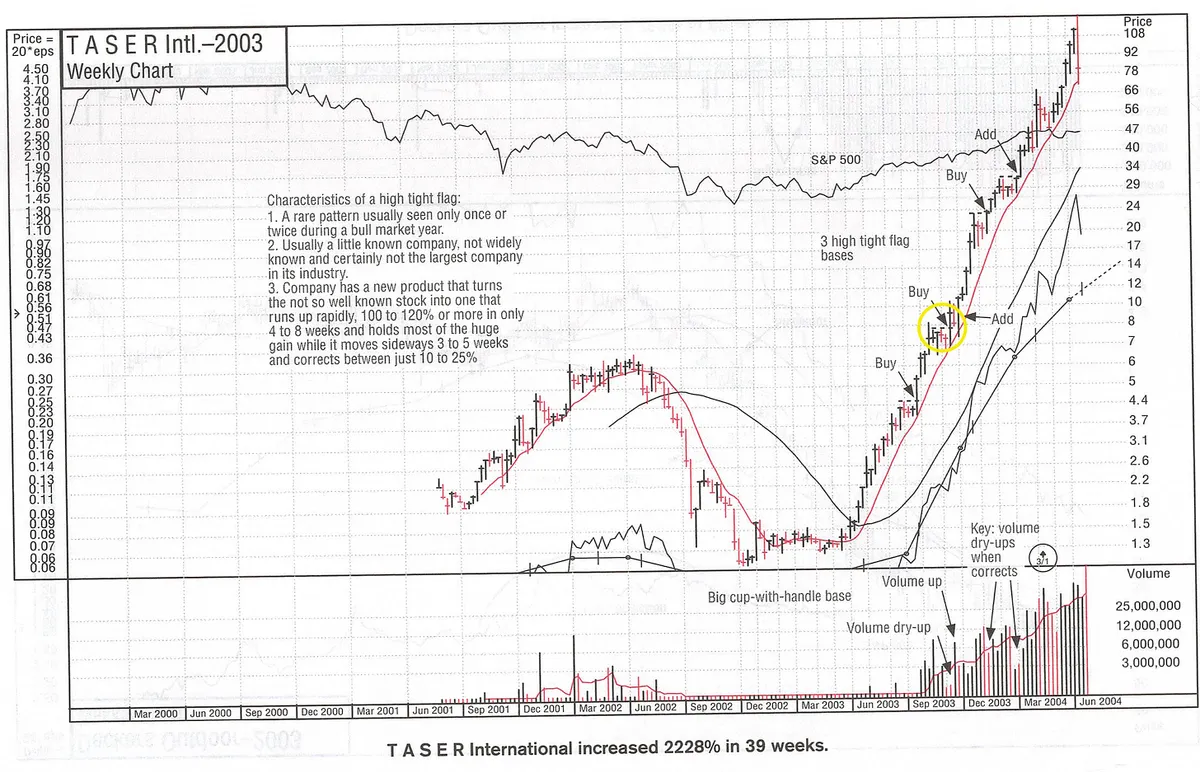
Look at TASER in 2003. O’Neil’s chart identifies three high tight flag bases during an advance that ultimately produced a 2,228% gain in 39 weeks. Notice the buy and add points as the stock keeps moving into new highs.

I’ve shared and discussed many stocks with similar patterns over the last couple of years, and the response is often the same: “It looks too extended.” But a stock having already made a huge move doesn’t automatically mean its next setup is unbuyable. I think some traders are missing what bull flags and pennants actually look like, and how tight consolidations or pullbacks can provide opportunities to enter and manage risk. They let fear or memories of past failed trades keep them from taking the next valid setup, potentially missing a huge opportunity.

If you call yourself a growth stock investor or momentum trader, study the biggest winning stocks in history. Buying strength and new highs is central to this discipline. We look for powerful stocks forming valid setups, and we use sell rules to cut losses when we’re wrong and protect gains as trends break down.

History gives us the confidence to buy strength. Discipline helps us manage the risk.

View on Substack ↗

IBIT

Buy at $45.90

Stop at $43

Late Stage 1 → potential Stage 2 transition.

It still doesn’t have all the ingredients I normally want for a fully confirmed Stage 2 uptrend, including the 50-day above the 200-day and the 200-day rising, but the change of character is getting my attention.

Not quite Stage 2 yet by Minervini or Weinstein’s stricter definitions.

Quoting Momentum Trading StrategyI Don’t Need to Call the Bottom. I Need to See the Character Change. Bitcoin and crypto are getting my attention again. Not because I’m trying to predict the bottom. Because the price action is starting to behave differently. Look at IBIT on the attached chart. We had the low, then a higher low, a higher high on str…
View on Substack ↗

I Don’t Need to Call the Bottom. I Need to See the Character Change.

Bitcoin and crypto are getting my attention again.

Not because I’m trying to predict the bottom.

Because the price action is starting to behave differently.

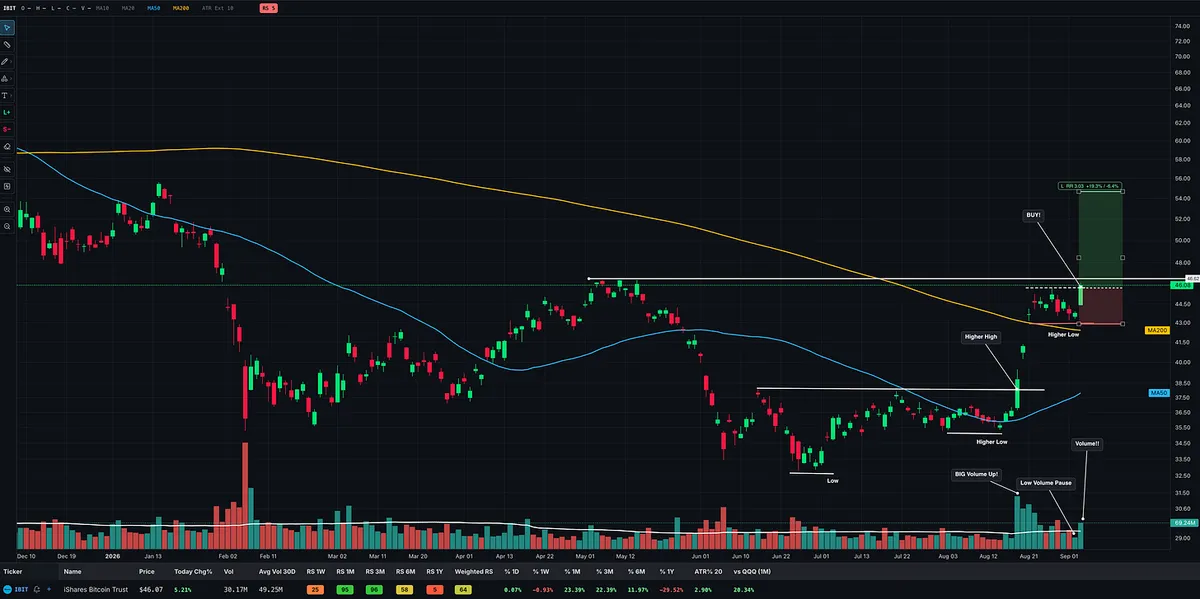
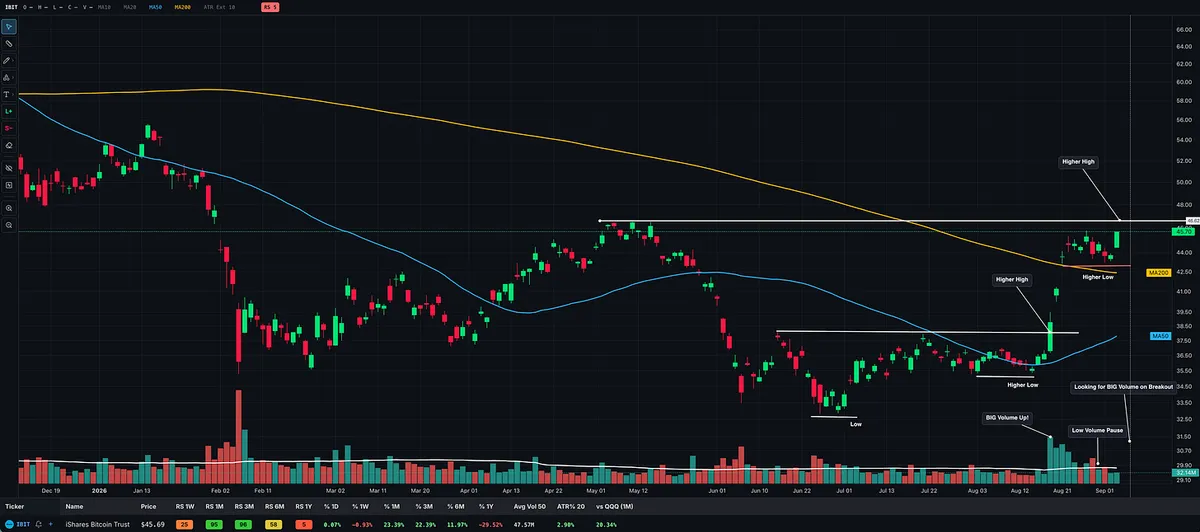
Look at IBIT on the attached chart. We had the low, then a higher low, a higher high on strong volume, another higher low, and now price is pushing back toward the prior May high. Short-term relative strength has improved significantly.

That is what I mean by a change of character.

You see this repeated across O’Neil, Minervini, Weinstein, Ryan, and Zanger.

Minervini describes a Stage 2 advance as a stock beginning to stair-step higher through higher highs and higher lows, with strong volume on advances and lighter volume on pullbacks.

Zanger describes an uptrend almost the same way in Momentum Masters: higher highs, higher lows, with tight consolidations between advances. Ryan also wants the moving averages and relative strength confirming the trend.

Weinstein puts heavy emphasis on relative strength improving before the breakout and warns that poor volume on a breakout is a danger signal.

But this is important:

Change of character is not full confirmation.

IBIT has reclaimed its 50-day and 200-day moving averages, but the longer-term trend still has work to do.

Minervini’s confirmed Stage 2 criteria require the 200-day to turn higher, with the shorter moving averages properly aligned above it.

Ryan describes an even stronger uptrend as the 20-day above the 50-day, the 50-day above the 200-day, with the averages rising.

We are not there yet.

There is also still plenty of overhead supply with IBIT well below its all-time highs.

So I’m not saying:

“Bitcoin is definitely starting a new bull market.”

I’m saying:

The evidence is improving.

Higher lows. Higher highs. Improving RS. Big volume on the initial upside move. Low-volume consolidation afterward. Price now pressing back toward resistance.

The next thing I want to see is simple:

A decisive breakout through the prior high on strong volume, followed by price holding that breakout and continuing to build the uptrend.

Then I want to see the moving averages continue to improve and eventually stack correctly as the trend matures.

I don’t need to guess what Bitcoin will do next.

I just need to recognize when the market starts telling me something has changed.

View on Substack ↗

Price Tells You What Happened. Volume Tells You Whether to Trust It.

One of the best lessons in Anna Coulling’s A Complete Guide to Volume Price Analysis is also one of the simplest:

Every price move should be judged against the volume behind it.

Coulling reduces Volume Price Analysis to two questions:

Is volume confirming the price action, or is there an anomaly?

That is especially useful around breakouts.

A stock breaking out of a base looks bullish, but the breakout itself is only half the information.

If price pushes through resistance with strong, expanding volume, the volume is confirming the move.

If price breaks out on weak volume, something is missing. Coulling specifically warns that a breakout from congestion on low volume should be treated with suspicion rather than automatically chased.

That gives us a simple way to read a breakout:

Price tells you the stock broke out. Volume tells you whether buyers actually showed up.

The same applies after the breakout.

Coulling writes that a valid move away from consolidation should generally be supported by above-average volume. If the stock then pulls back to test the breakout area, you would prefer to see volume contract. Heavy volume on the breakout, lighter volume on the pullback.

That is supply and demand on the chart.

Strong volume as price advances tells you demand is present.

Light volume on a pullback tells you selling pressure may be limited.

View on Substack ↗

The Right Stock at the Wrong Time Is Still the Wrong Trade

Chapter 2 of William O’Neil’s How to Make Money in Stocks says a lot in the title alone:

How to Read Charts Like a Pro and Improve Your Selection and Timing.

Selection and timing.

O’Neil did not separate the two. Strong earnings and sales can help identify a great company, but the chart helps determine whether it is actually time to buy.

This is where traders often go wrong. They fall in love with the stock or fundamentals first, then start looking for an excuse to enter.

O’Neil taught the opposite.

Qualify the stock fundamentally. Then wait for the chart.

He wrote that the objective is not to buy at the cheapest price, but at the right time, when the stock reaches a proper buy point and proves its strength. Buying too early can leave you stuck in a stock that never breaks out. Buying too late means chasing, and chasing increases risk. If you compensate by sizing down, you dilute your winners and reduce your ability to concentrate in your best setups.

“There’s a right time, and then there are all the other times.”

-William O’Neil

So the process is straightforward:

Qualify the company. Read the chart. Wait for the setup. Buy at the proper time.

If the setup is not there, you wait.

Missing a move because your setup never appeared is NOT a failure of the process.

Buying without the proper setup is.

View on Substack ↗

Why I Wouldn’t Buy DELL Right Before Earnings

Someone asked me why I wouldn’t buy DELL before earnings, especially when I’ve held other stocks through earnings.

The difference is context.

With LITE, I was already in the stock and had roughly a 25% cushion going into earnings. In situations like that, I may sell some before the report and hold the rest through earnings.

That is completely different from initiating a brand-new position right before earnings.

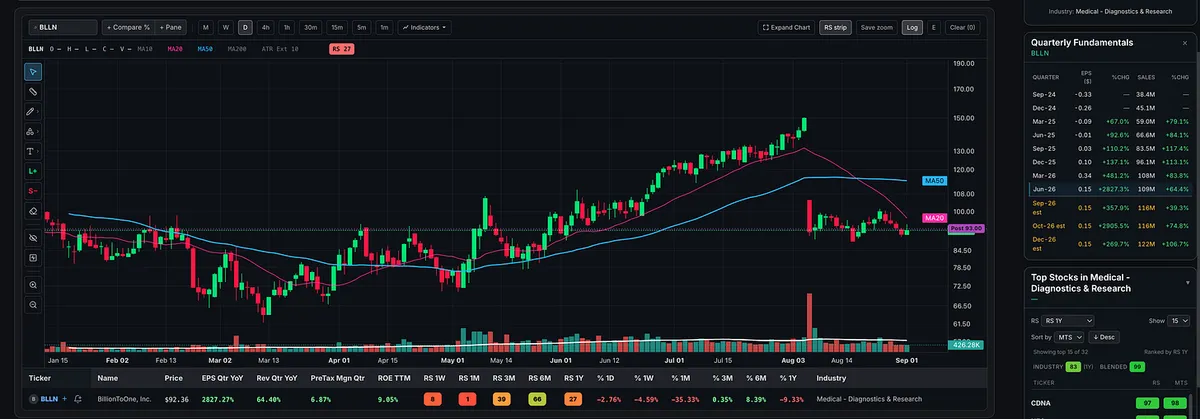
If you want to hold stocks long enough to capture really big moves, eventually you have to get comfortable sitting through some earnings reports. There is no way around that. Even with a large profit cushion, you can still get hit with an ugly reaction, like we saw with BLLN.

But I will NOT buy a stock immediately before earnings just to gamble on the report.

And with DELL specifically, the decision was even easier.

The stock looked like it wanted to go higher, but showed very little follow-through. Then it had a bad day today, falling more than 6% and closing below the 50-day moving average.

On top of that, the overall market hasn’t been acting well.

So now you have:

  • Poor follow-through after a failed breakout attempt

  • A greater than 6% down day

  • A close below the 50-day moving average

  • A less-than-ideal overall market

  • Earnings immediately ahead

Why would I initiate a brand-new position and take on earnings risk with all of that working against me?

For me, there is a big difference between holding earnings with a 20% to 30% profit cushion in an existing position and buying a stock immediately before earnings with no cushion at all.

Those are two completely different risk situations.

Now, with DELL up roughly 10% after hours, I’ll watch how the price continues to act and see whether it gives me a setup. It did something similar in early March after the big gap up in late February.

I don’t need to predict the earnings reaction or gamble on the report. I can wait for the report, see how the market reacts, and then look for a proper setup.