Momentum Trading Strategy

Notes

Short lessons on momentum trading, every day.

Every note from Substack, in one place: risk, setups, leading stocks, market conditions and the mindset behind them. Search them, browse by topic, or filter by stock.

Showing 1–7 of 7 notes

$MRVL ×
View on Substack ↗

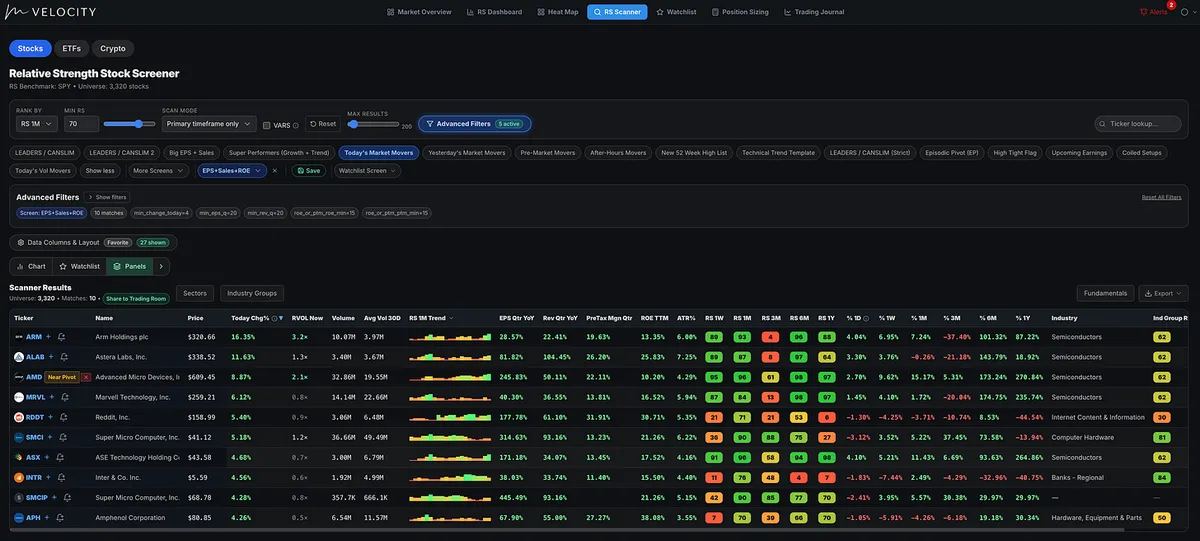
“Hey MTS Velocity, show me today’s market movers with the earnings, sales, and profitability to back up the move.”

Here’s the scan:

✅ Up at least 4% today

✅ 1-month RS rating of 70+

✅ Quarterly EPS growth of at least 20%

✅ Quarterly sales growth of at least 20%

✅ ROE or pre-tax margins of at least 15%

My starting universe: 3,320 NYSE and Nasdaq stocks, already filtered for minimum price, average trading volume, and market cap.

Just 10 matches.

$ARM · $ALAB · $AMD · $MRVL · $RDDT · $SMCI · $ASX · $INTR · $SMCIP · $APH

Leading the list when I ran the scan: ARM +16.35%, ALAB +11.63%, and AMD +8.87%.

View on Substack ↗

This Stock Had an 82 RS Rating Before It Ran 225%

One of the biggest misconceptions in momentum trading is that once a stock has a high Relative Strength rating, the move must already be over.

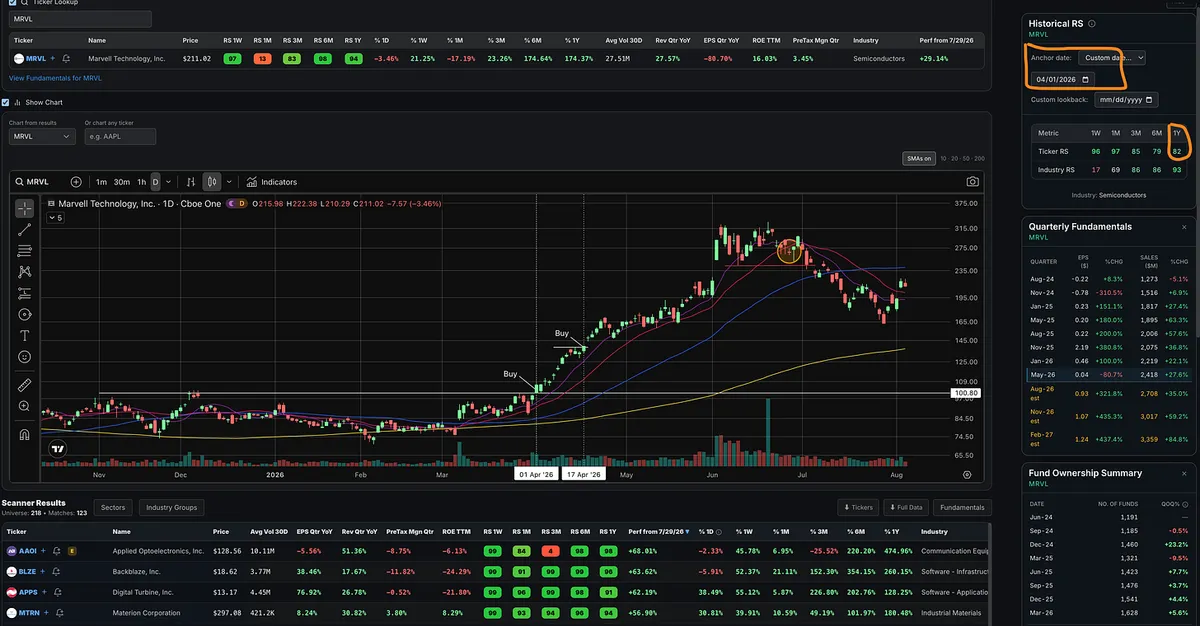
MRVL tells a very different story.

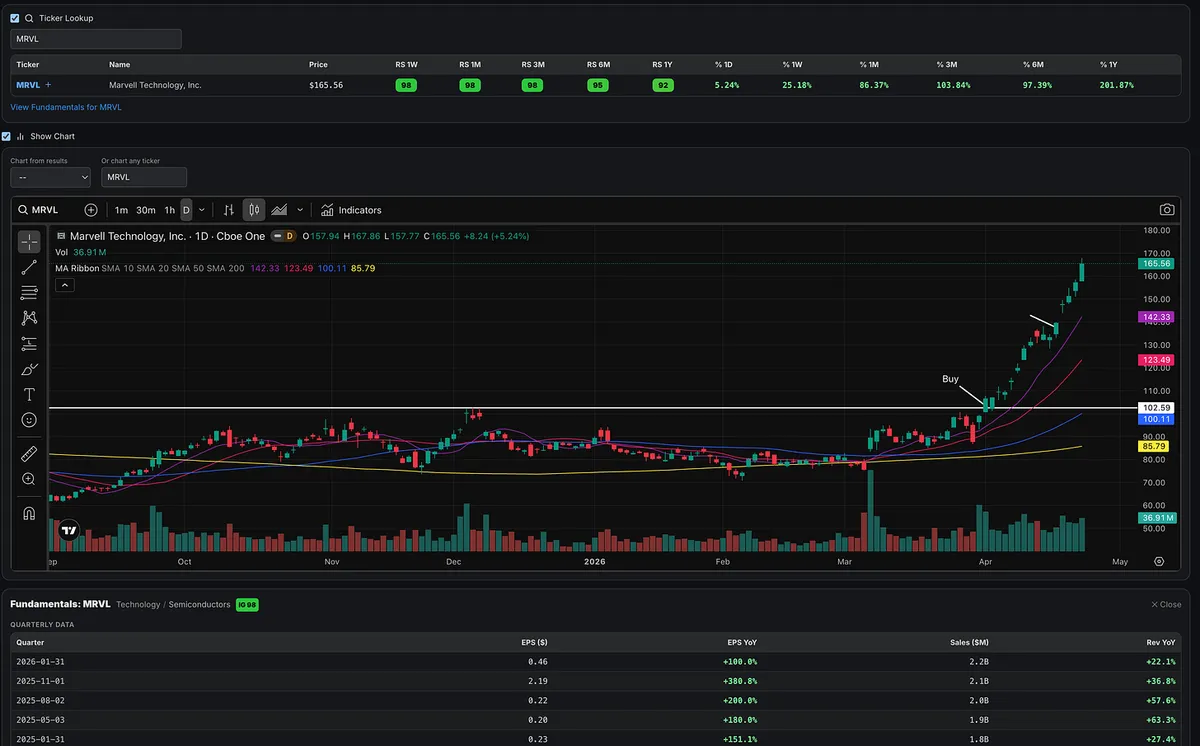
Back in April, the stock broke out of a six-month base. At the time of the breakout, its one-year RS rating was already 82.

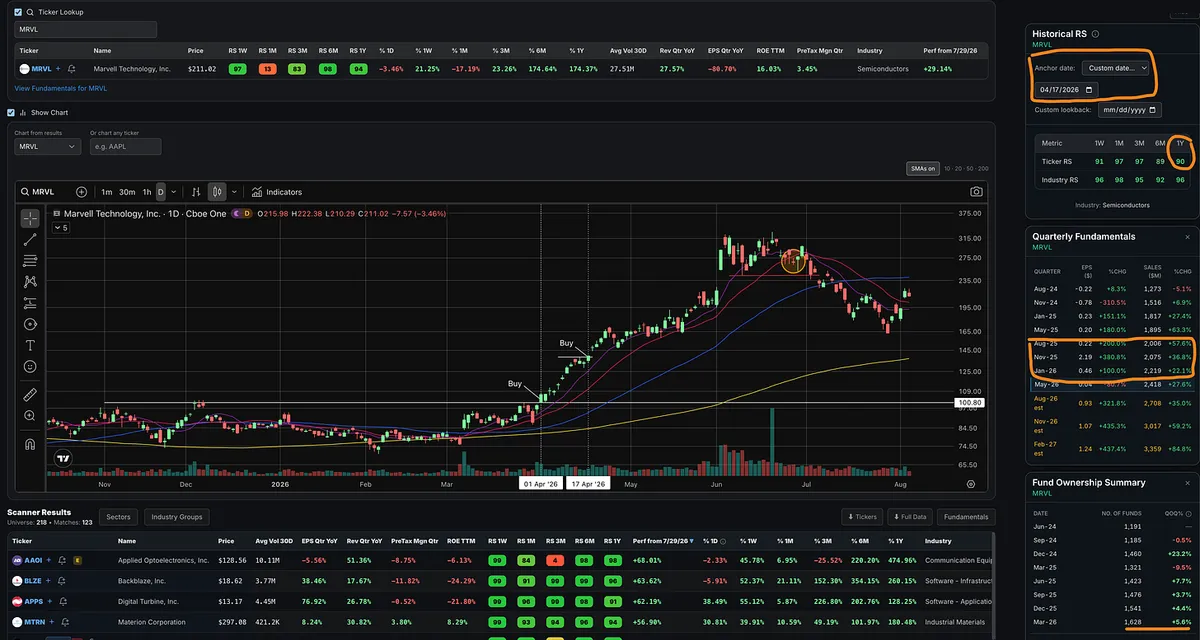
If you missed the April 1 breakout on heavy volume into new highs, the stock offered another opportunity on April 17. It formed a tight area with a clearly defined level for placing a stop.

By then, its one-year RS rating had climbed to 90.

From the first entry, MRVL advanced roughly 225%.

From the second entry, it gained nearly 140%.

High relative strength did not mean the move was over.

It was evidence that the stock was already separating itself from the rest of the market.

I have always tracked the RS ratings of stocks at the time I purchased them in my model books, but I wanted traders to be able to study this for themselves, so I created a Historical RS feature.

You can now select any previous date and see exactly what a stock’s Relative Strength rating was at that moment.

What you will discover is that many of the market’s biggest winners already had RS ratings of 80 or higher before their largest advances began.

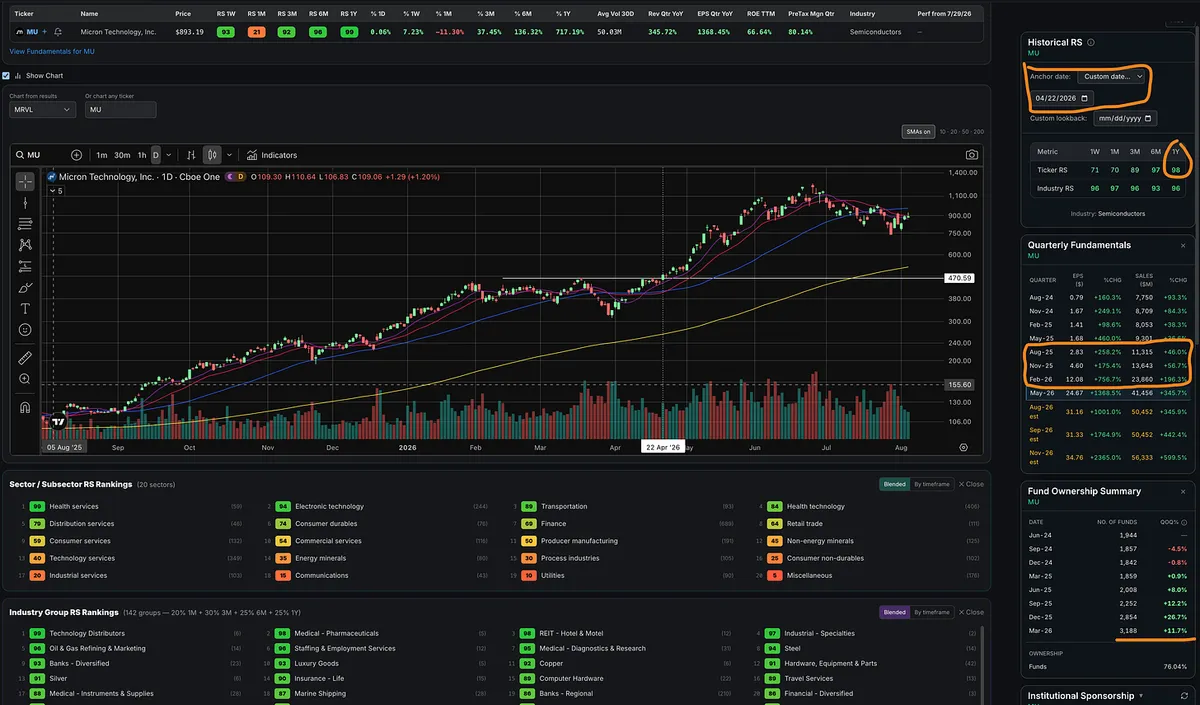
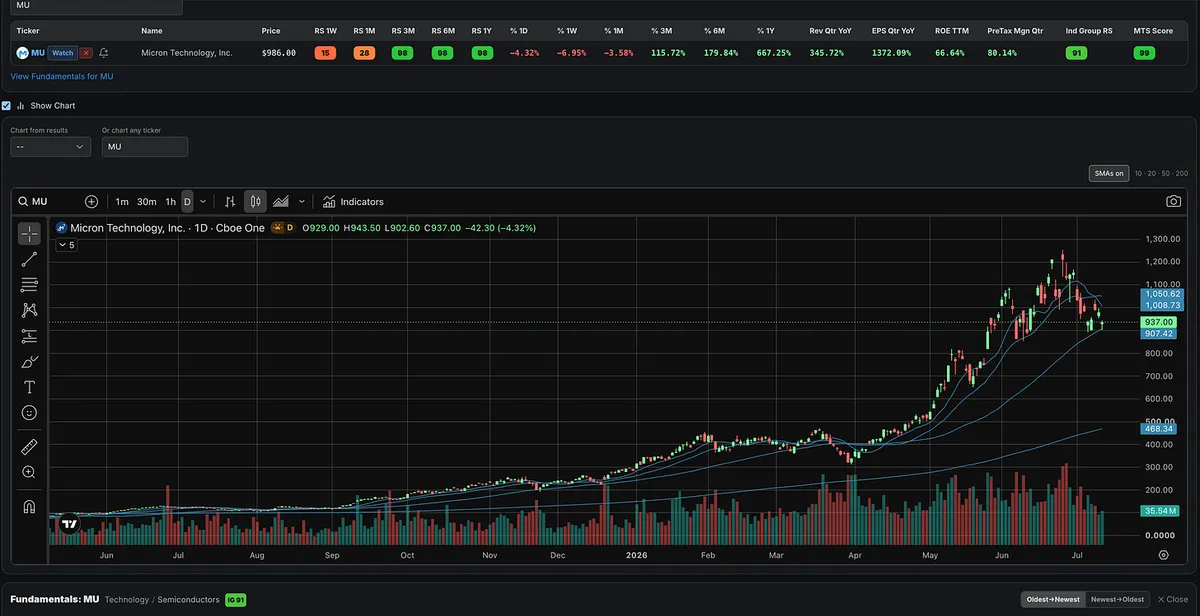
MU provides an even more dramatic example.

When MU broke out on April 22, its one-year RS rating was already 98.

The stock went on to advance more than 160% from that point.

According to the argument that high RS means the move is already over, MU should have had almost no upside remaining.

The exact opposite happened.

This is not simply something William O’Neil wrote about in How to Make Money in Stocks.

You can go back and see the evidence for yourself.

High RS does not tell you the opportunity is over.

Sometimes, it tells you the real move is just beginning.

View on Substack ↗

Nothing Lasts Forever. Don’t Fall in Love With Any Stock.

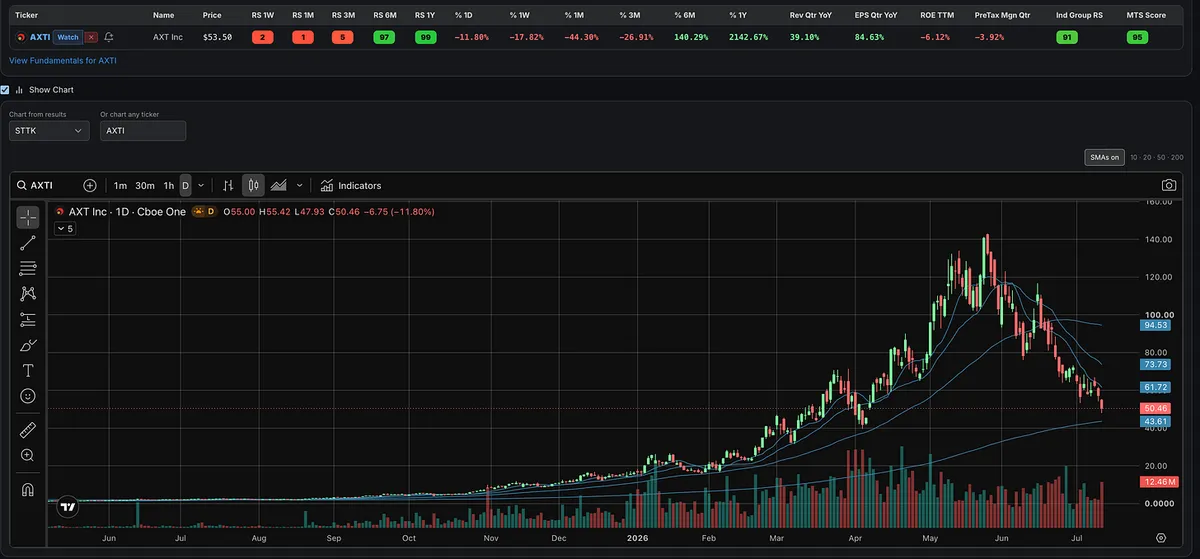
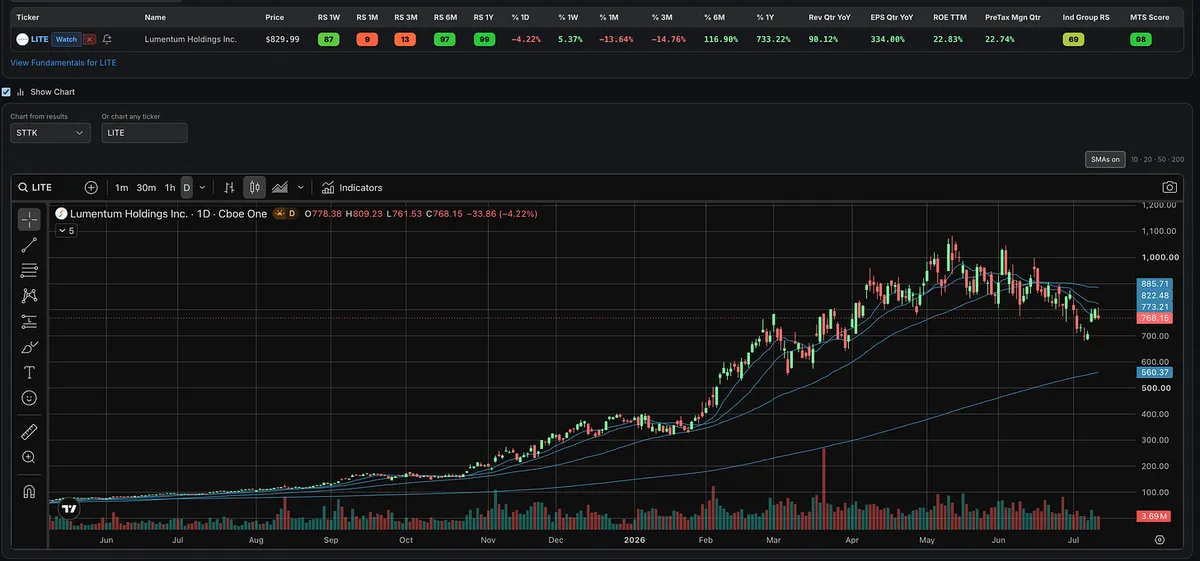
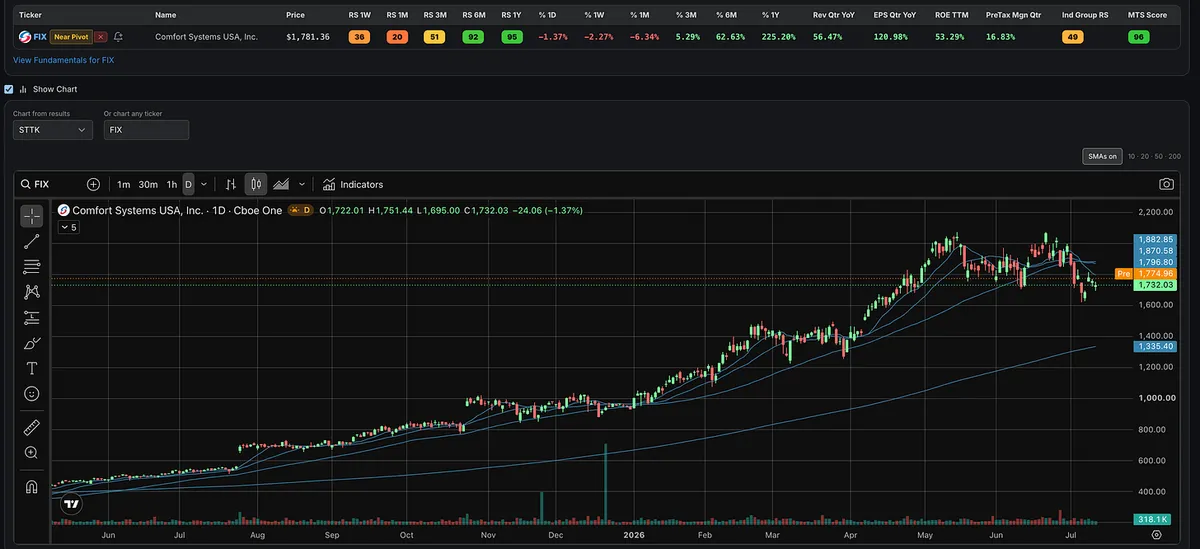
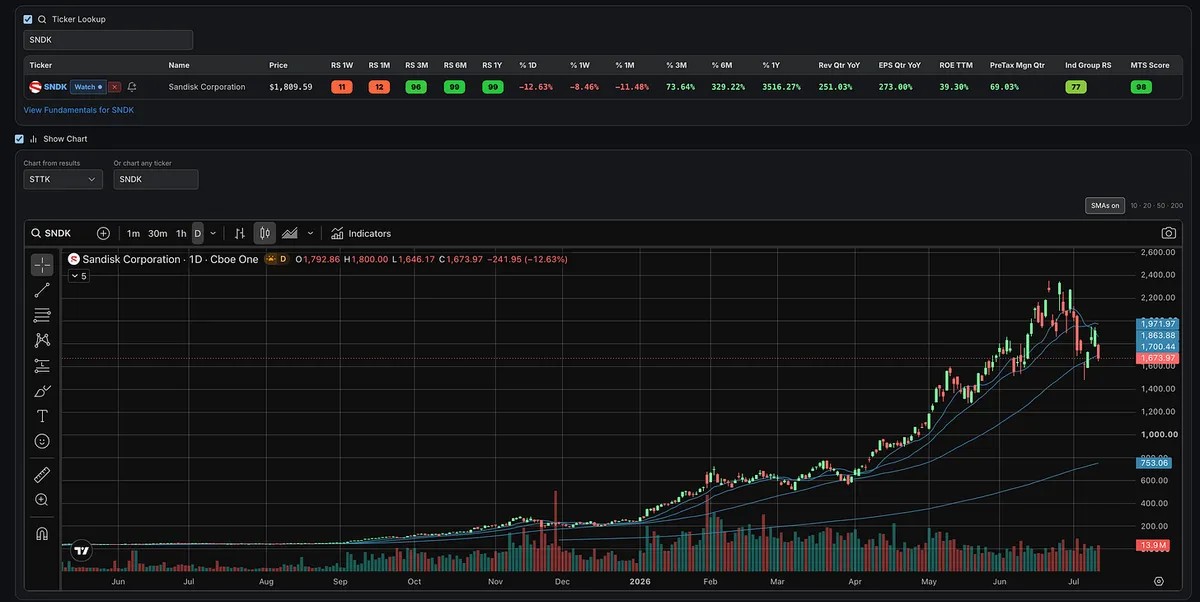
Some of the market’s biggest winners over the past year have now broken down. At least for the moment, their runs appear to be over.

AXTI delivered enormous gains over the last year, but it has now fallen below its 50-day moving average and is heading toward the 200-day. Its 10-day and 20-day lines are declining, and the 50-day is beginning to roll over.

LITE, CIEN, VICR, AAOI, VIAV, TTMI, FIX, COHR, and several other former leaders have also broken down or suffered significant technical damage.

Many more are sitting in the danger zone near their 50-day moving averages. That includes the memory names SNDK, WDC, STX, and MU, along with other hot names from hot groups VPG, MBIS, MXL, LSCC, MRVL, TER, VSH, STM, ADI, INTC, TSM, LRCX, COHU, PDFS, and others.

The bottom line is that many of the stocks that have driven this market, particularly the memory, semiconductor, and telecom names, have either already broken down or are now testing a critical area around their 50-day lines.

I have not needed to share many new tickers from week to week because the same names I have discussed throughout the year continued to lead. There was no reason to constantly search for something new when the existing leaders were still working.

But nothing lasts forever.

Many of the stocks that worked all year are now either ending their runs or approaching a decisive point. Do not fall in love with any stock. Respect the price action and let the market tell you whether the trend is still intact.

View on Substack ↗

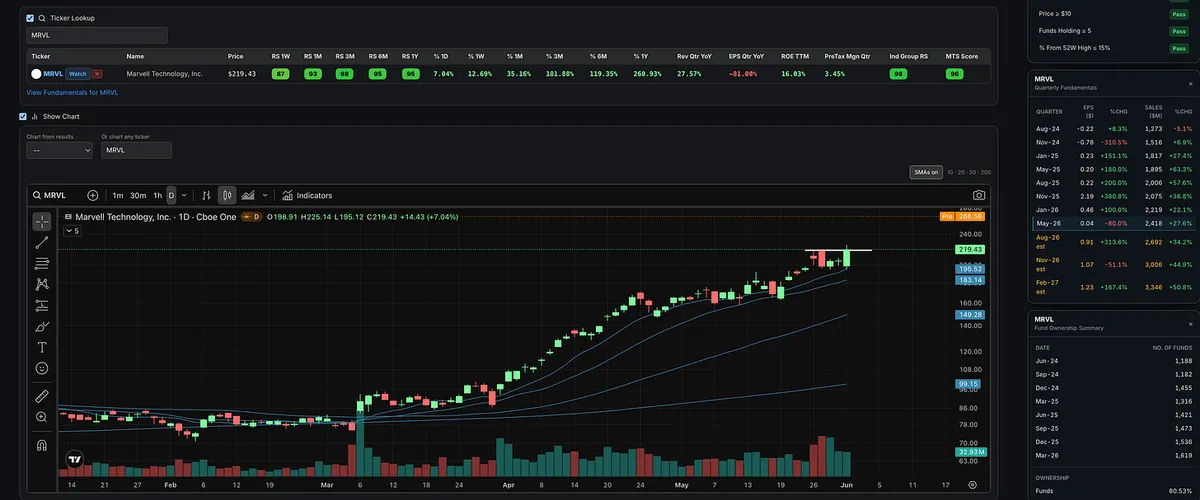
MRVL Big Gap Up.

If you bought the pullback to the 10-day moving average or entered as it broke out to new highs, you are feeling pretty good this morning.

This is why we track leaders and look for proper entries.

These types of entries are discussed in Module 5 of the Momentum Trading Strategy Course, which is free for paid subscribers.

View on Substack ↗

The Quiet Warning Showing Up Under the Surface

A lot of leading stocks are still acting strong.

Many are making new highs. Many still have great relative strength.

Price is still king, and I would never execute a trade based on one data point alone.

But I am noticing something worth paying attention to.

On the most recent earnings reports for a lot of leading names I’ve been following, fund ownership has dropped.

Again, this does not mean the move is over.

These stocks can absolutely keep running higher from here. That’s exactly why price always comes first.

Also, sometimes this happens for a quarter or two, then funds increase again and come right back into the name.

But when leading stocks are pushing higher while fund ownership starts declining, it can be an early sign that some institutions are taking profits into strength.

If price starts to break down later, this gives us a possible clue as to what may have been happening under the surface.

Some names where I’m noticing this:

SIMO, ALAB, MRVL, LITE, TTMI, NVT, LASR, AMD, STRL, LRCX, AAOI.

This is not a sell signal.

This is not a prediction.

Just something I’m taking note of.

View on Substack ↗

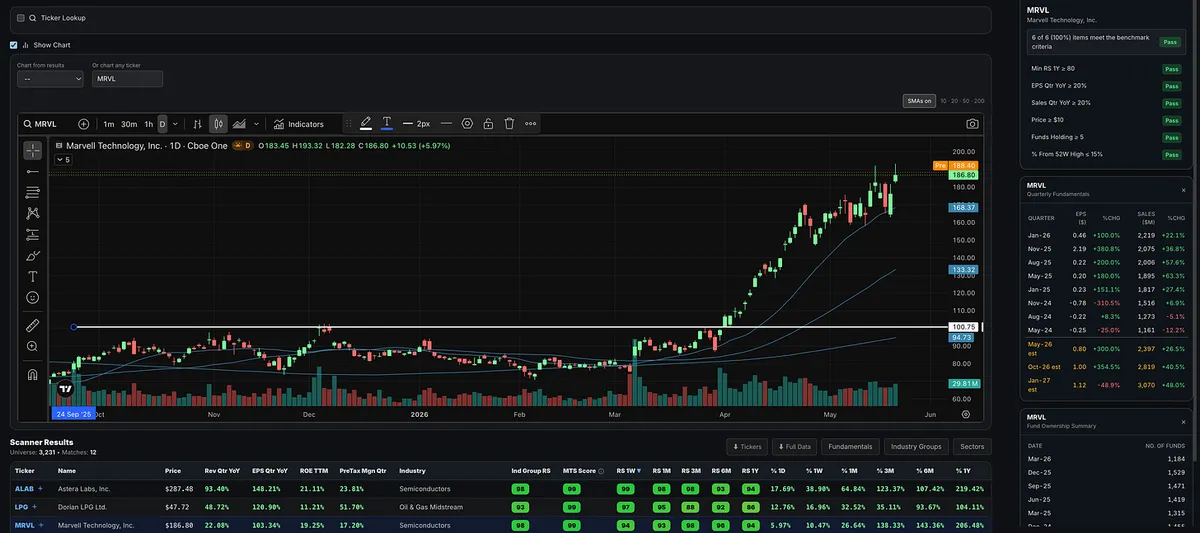
Look at MRVL.

This is what leadership looks like.

The stock has been showing a great deal of relative strength. Over the last week, it has held up extremely well and continues to trade near highs.

Fundamentally, it checks a lot of the boxes we want to see: strong earnings growth, good sales growth, good ROE, solid pre-tax margins, and it belongs to a strong industry group.

The relative strength is also very strong across multiple time frames, and it has been consistently outperforming.

View on Substack ↗

The Market Is Telling You Where To Look… Are You Listening?

You want the #1 stock.

The one that defines the cycle. The one everyone talks about. The one that goes 300%+.

And yes, if you land in that name, that is where life-changing returns come from.

But here is what most traders miss.

You do not need the #1 stock.

You can win big with #2, #3, #4, and so on.

How the market actually moves

Trends do not show up in isolation.

They show up in clusters.

Strong stocks inside strong industry groups. Aligned with powerful themes.

This is not new.

Nicolas Darvas was doing this in the 1950s.

He focused on stocks that stood out like a beacon above weaker names and moved into powerful advances.

He was not chasing random stocks.

He was following where strength was concentrating.

What the market is showing right now

Top groups:

  • Telecom Fiber Optics

  • Computer Data Storage

  • Semiconductor Equipment

That is where institutions are putting money.

That is where trends are forming.

Then you look at Marvell Technology.

Now everything lines up.

  • Relative strength in the highest percentile across timeframes

  • Strong earnings and sales growth

  • High return on equity

  • Strong pre-tax margins

  • Leader inside a top ranked group

This is what alignment looks like.

Not just a good stock.

A strong stock in the right place at the right time.

What most people miss

It is not just about the stock.

It is also about the group.

The takeaway

Focus on:

  • Leading stocks

  • In leading groups

  • With real fundamental strength

You do not need to find the one.

You just need to be positioned where strength is already working.