Momentum Trading Strategy

Notes

Short lessons on momentum trading, every day.

Every note from Substack, in one place: risk, setups, leading stocks, market conditions and the mindset behind them. Search them, browse by topic, or filter by stock.

Showing 1–13 of 13 notes

$AXTI ×
View on Substack ↗

A Different Kind of Strength Since Last Wednesday’s Low

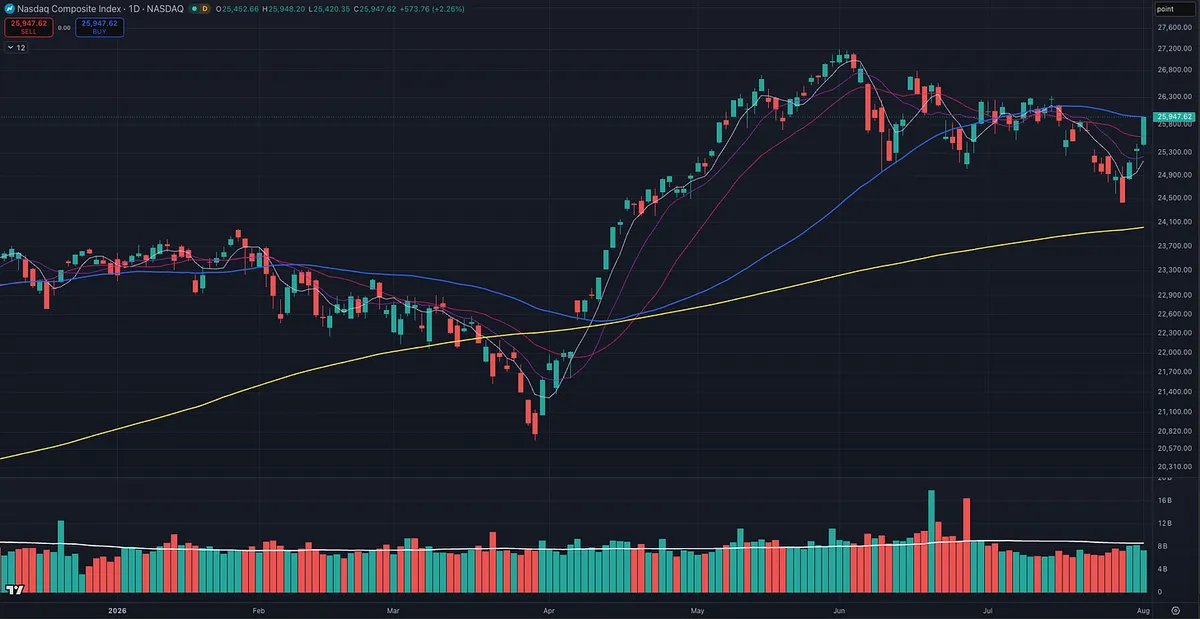
Now we will see if the rally attempt earns confirmation with a follow-through day in the coming days.

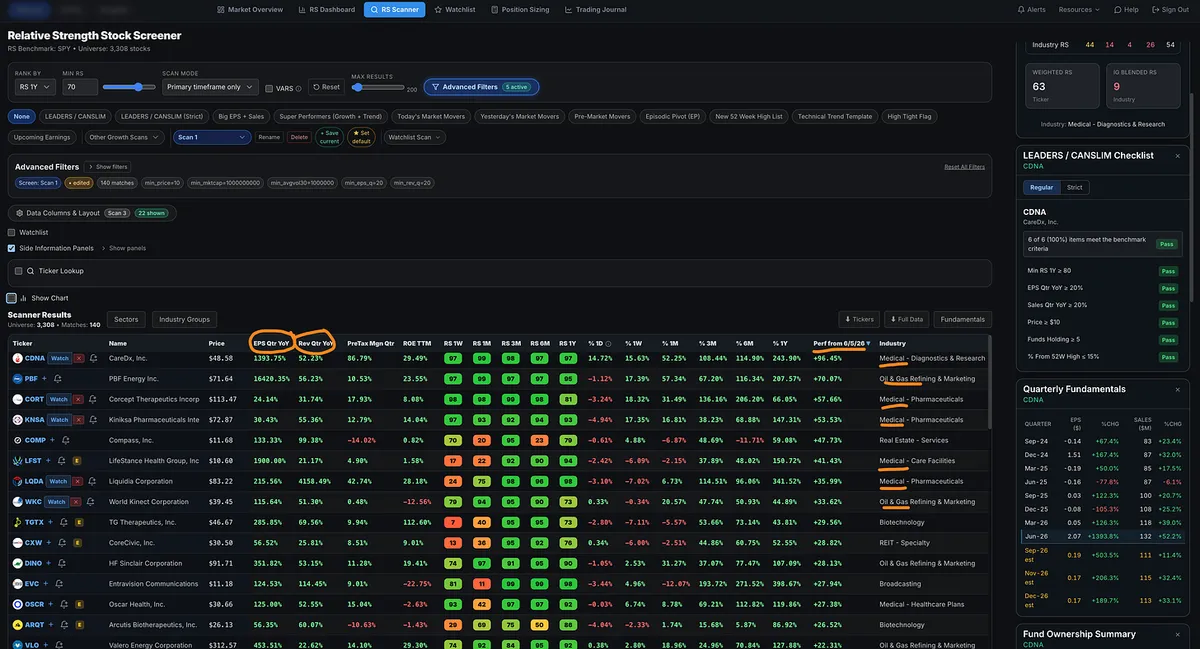
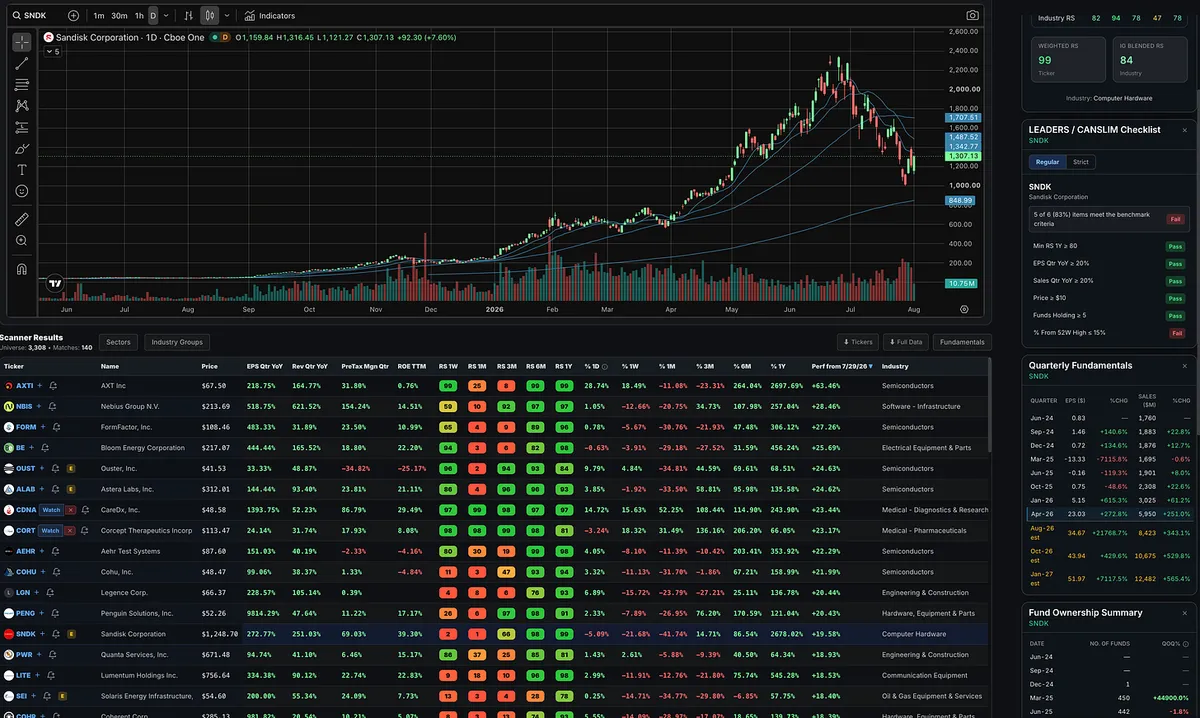
Using the same scan of liquid stocks with big earnings and sales growth, the leaderboard looks completely different depending on the starting point.

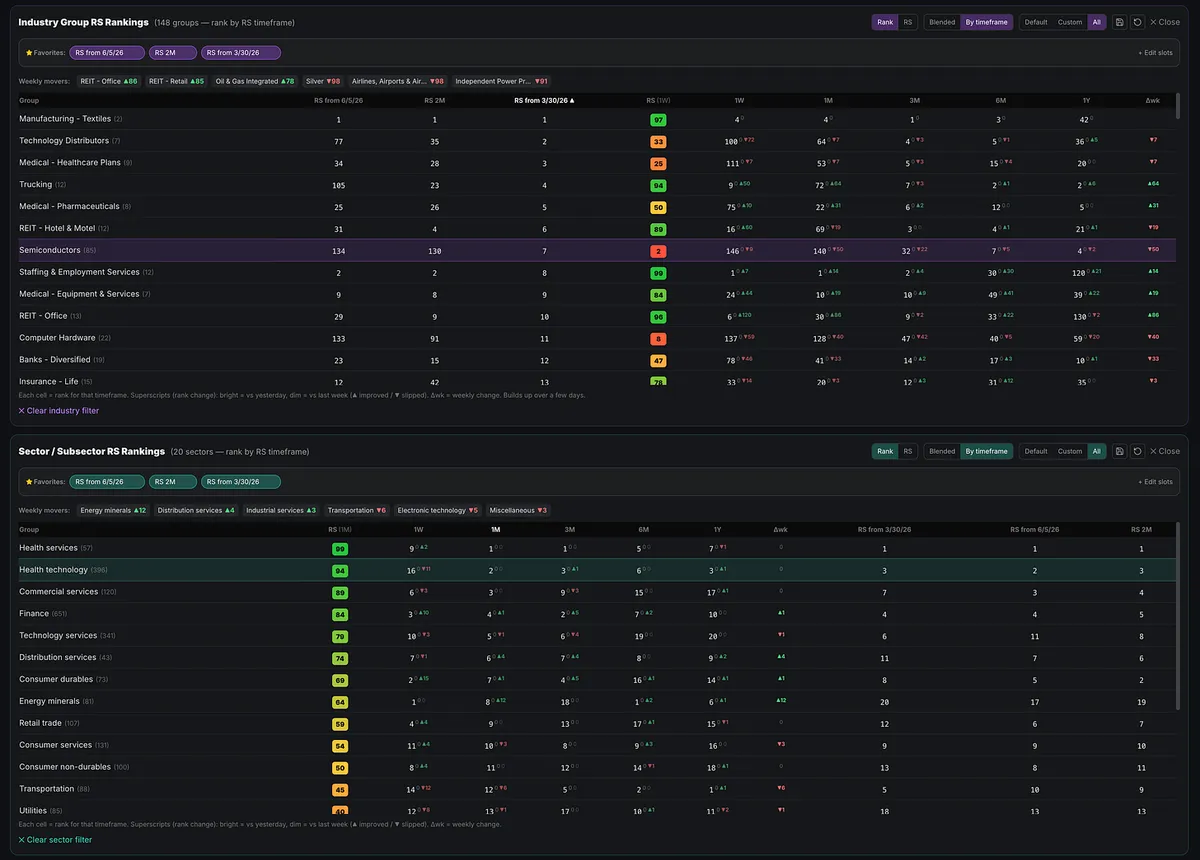
From the June 5 character change through today, the strongest performers have largely come from healthcare, energy, and other less traditional growth areas.

When performance is measured from last Wednesday’s low, however, the list shifts sharply toward semiconductors and beaten down former leaders.

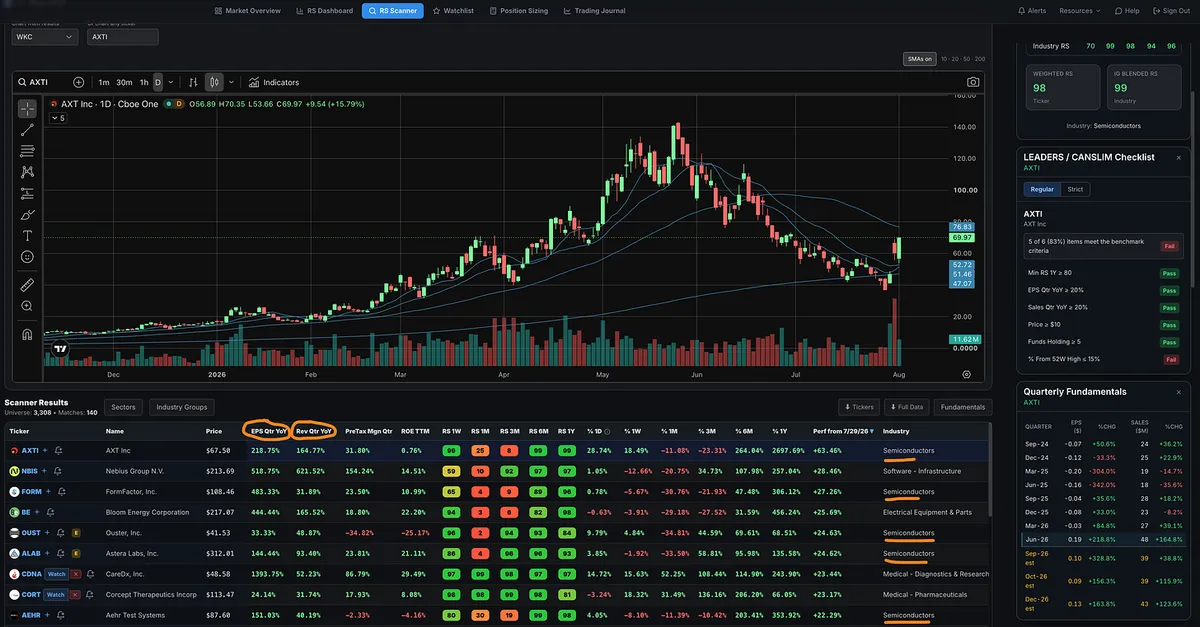
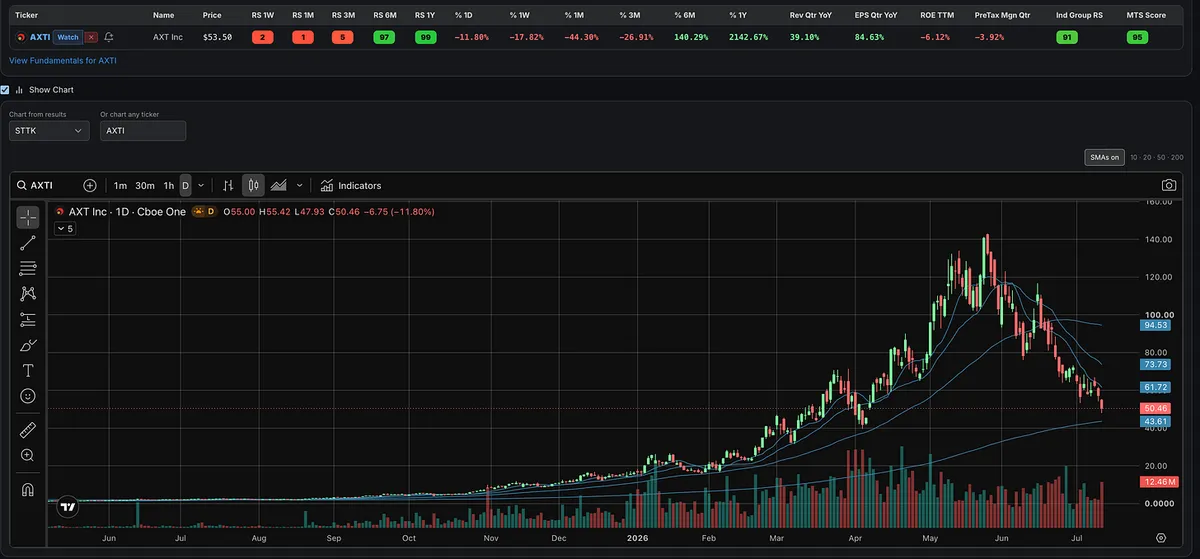
That change is notable, but it is not yet proof that these stocks are back or that a new leadership cycle has begun. Many remain well below their highs. AXTI, for example, had declined nearly 75%. During corrections and bear markets, deeply damaged stocks can produce powerful short term rallies without repairing their longer term trends.

The question now is whether this develops into sustained relative strength, institutional accumulation, or fades as another rebound from oversold levels.

The market still has to provide the evidence. A rally attempt can fail or develop into a legitimate follow through, while genuine leaders must continue separating themselves through superior relative strength and price and volume action.

Same fundamental scan. Different measurement window. Completely different type of stock showing strength. It is a character change worth watching, not a conclusion.
View on Substack ↗

Leadership changes before most traders notice.

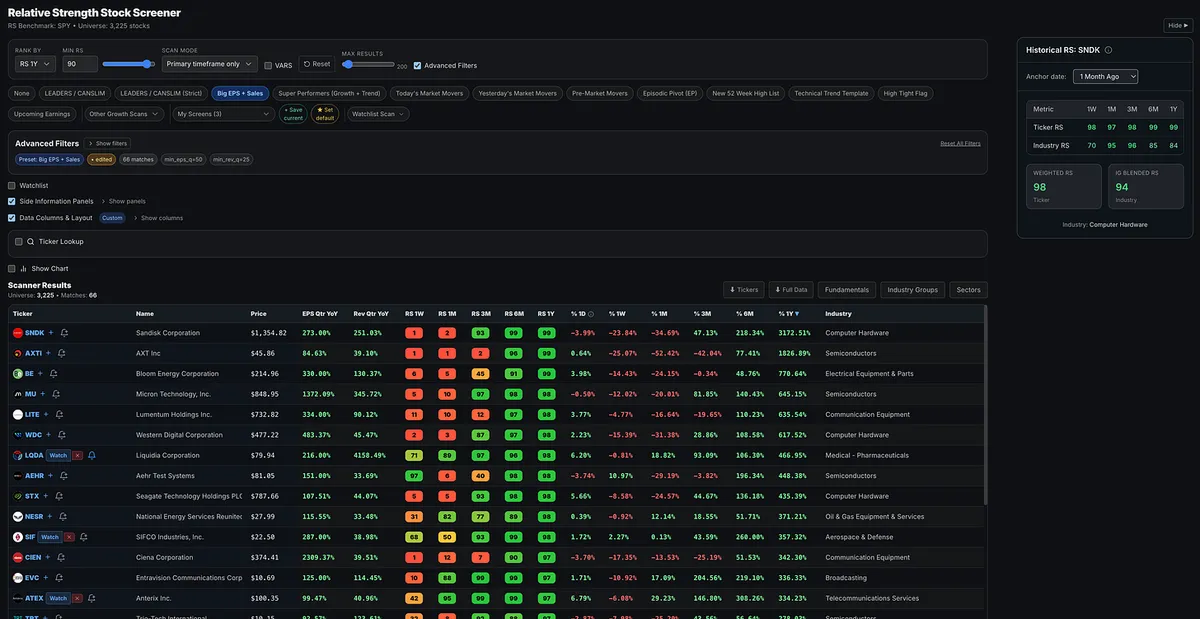
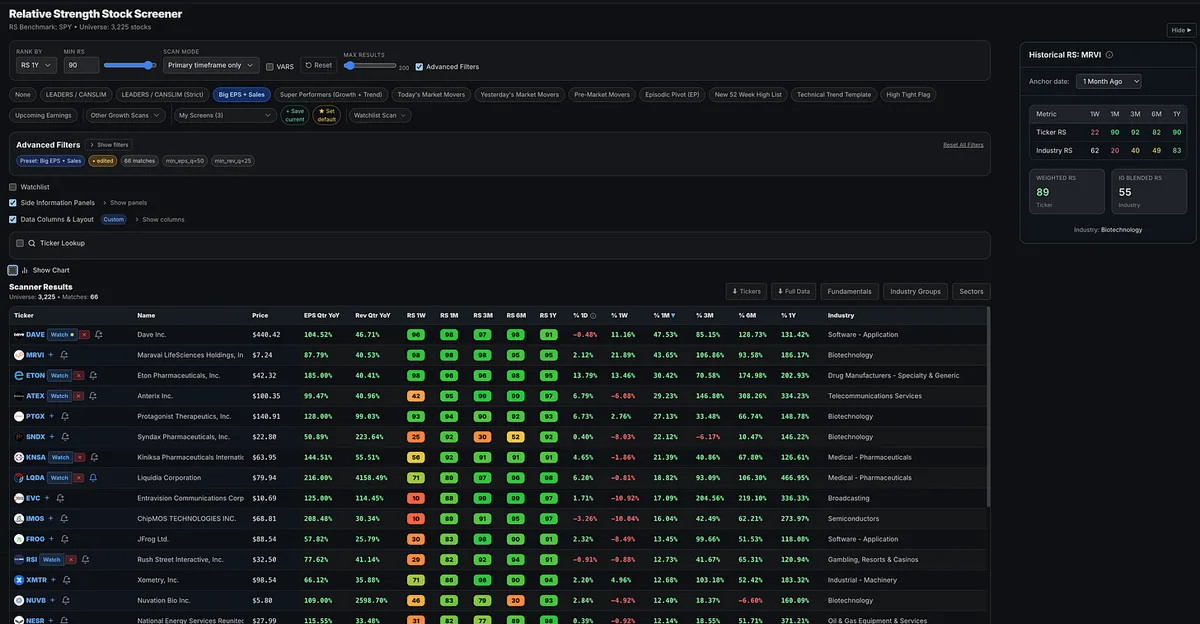
Run the Big Earnings and Big Sales screen, then compare one-year relative strength with one-month relative strength.

The shift is unmistakable.

Many of the stocks that dominated the last year still carry elite long-term RS ratings, but their short-term rankings have collapsed:

SNDK: 1yr RS = 99 / 1m RS = 2

AXTI: 99 to 1

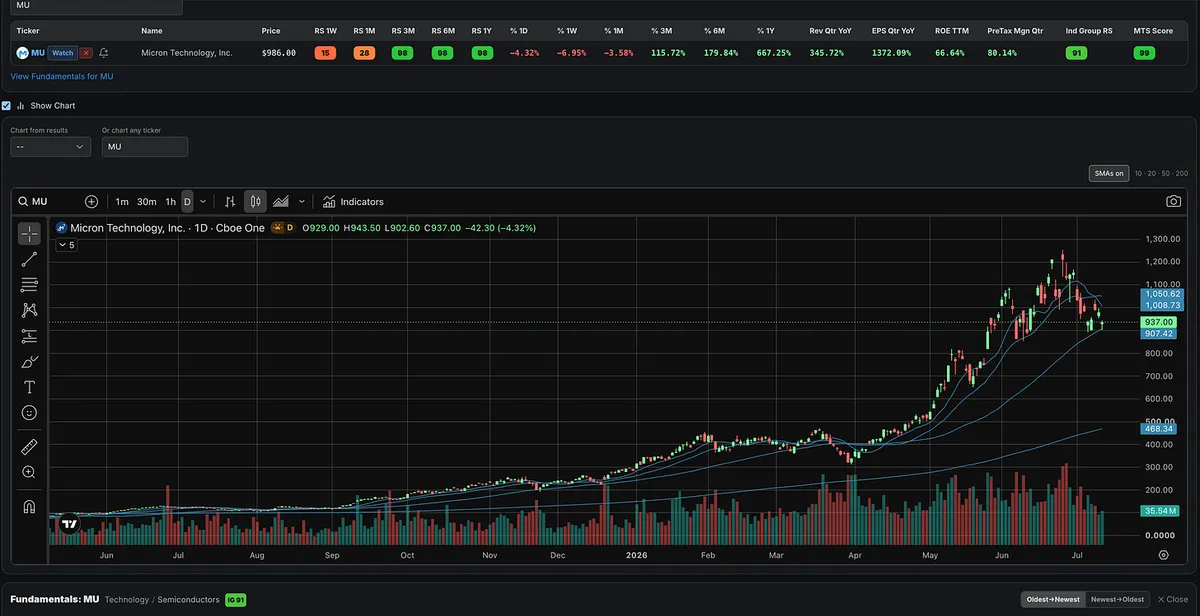
MU: 98 to 10

WDC: 98 to 3

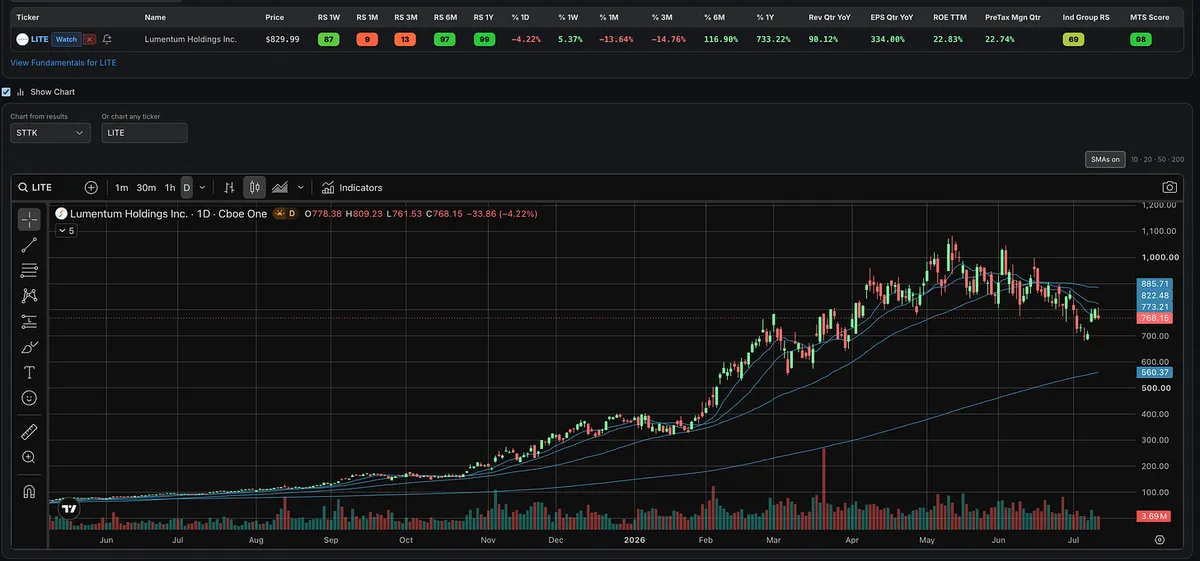
LITE: 98 to 10

CIEN: 97 to 12

At the same time, biotechnology, pharmaceuticals, software, and other emerging groups are moving toward the top of the screen.

That is what leadership rotation looks like in real time.

The market doesn’t send a memo. It leaves clues in relative strength, and industry-group rankings.

View on Substack ↗

Nothing Lasts Forever. Don’t Fall in Love With Any Stock.

Some of the market’s biggest winners over the past year have now broken down. At least for the moment, their runs appear to be over.

AXTI delivered enormous gains over the last year, but it has now fallen below its 50-day moving average and is heading toward the 200-day. Its 10-day and 20-day lines are declining, and the 50-day is beginning to roll over.

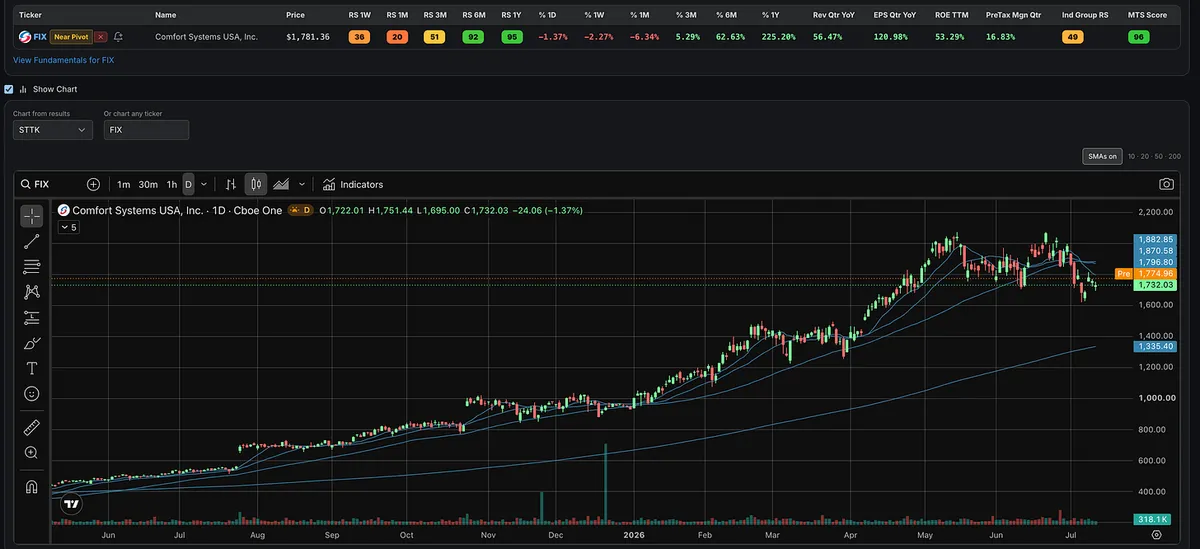
LITE, CIEN, VICR, AAOI, VIAV, TTMI, FIX, COHR, and several other former leaders have also broken down or suffered significant technical damage.

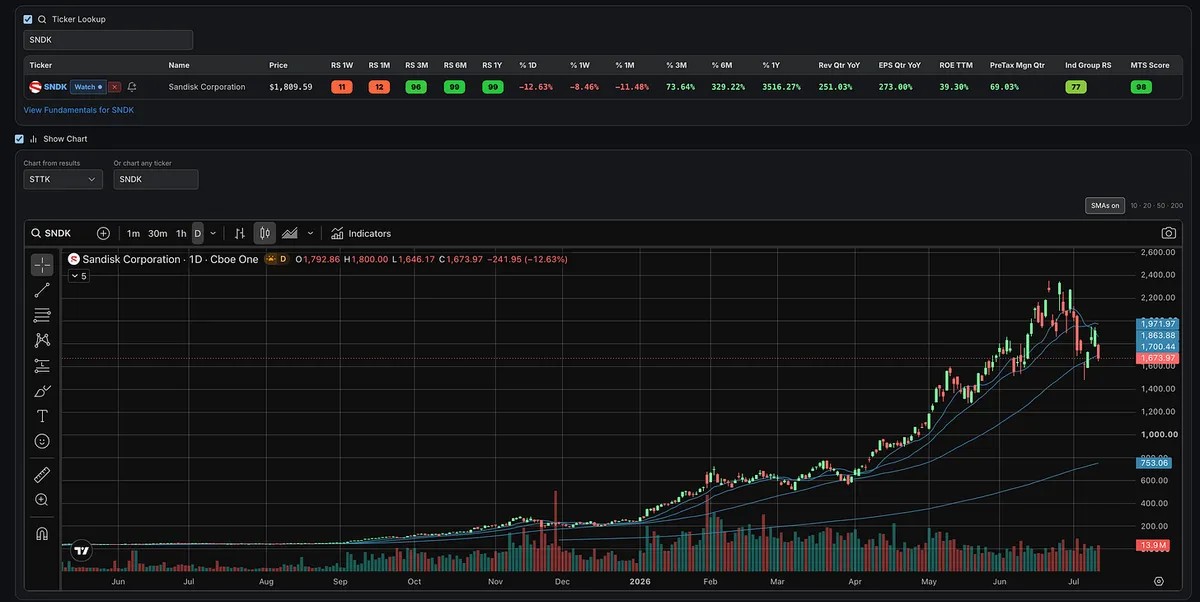
Many more are sitting in the danger zone near their 50-day moving averages. That includes the memory names SNDK, WDC, STX, and MU, along with other hot names from hot groups VPG, MBIS, MXL, LSCC, MRVL, TER, VSH, STM, ADI, INTC, TSM, LRCX, COHU, PDFS, and others.

The bottom line is that many of the stocks that have driven this market, particularly the memory, semiconductor, and telecom names, have either already broken down or are now testing a critical area around their 50-day lines.

I have not needed to share many new tickers from week to week because the same names I have discussed throughout the year continued to lead. There was no reason to constantly search for something new when the existing leaders were still working.

But nothing lasts forever.

Many of the stocks that worked all year are now either ending their runs or approaching a decisive point. Do not fall in love with any stock. Respect the price action and let the market tell you whether the trend is still intact.

View on Substack ↗

Stop Waiting for Someone to Hand You the Next Big Winner

If you are struggling to find the big winning stocks, you do not need to wait around for me or anyone else to tell you the names.

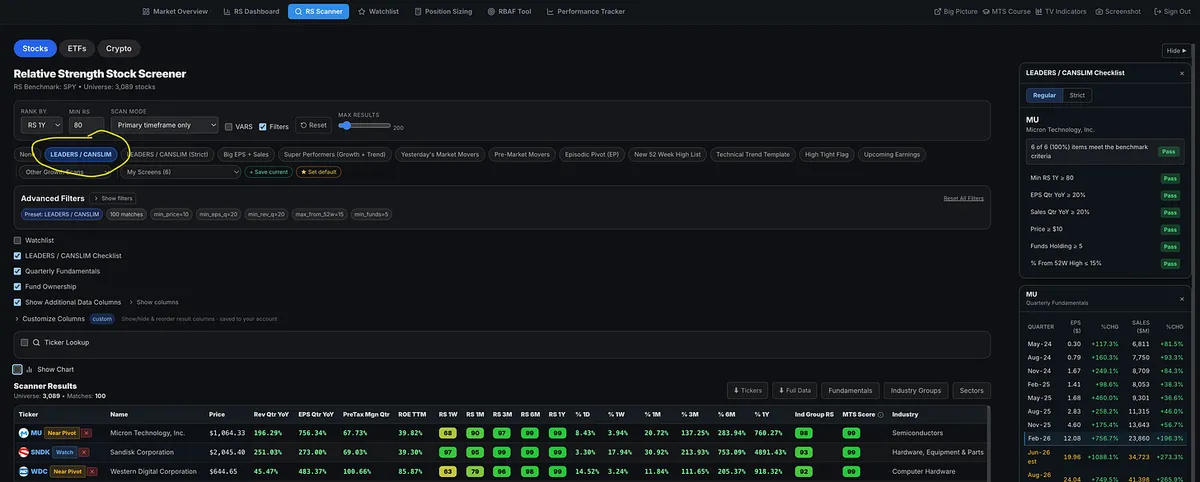
Open the Relative Strength Stock Screener and click the Leader / CANSLIM preset stock screen.

You will immediately see many of the market’s strongest names near the top of the list.

As you scroll through the list, some names will be extended. Those go on your watchlist so you can wait for the next proper pullback or setup.

Some will be near pivot points.

Some will already be actionable.

That is the entire point of the screener.

It is not there to overwhelm you with tickers. It is there to help you quickly identify where the real leadership is.

This is the same exact process I have used to find and share many of the biggest winners since January.

Names like:

SNDK

MU

AAOI

AXTI

DELL

CIEN

LITE

WDC

STX

SIMO

and many more!

Your job is to build the habit of checking the list, following the leaders, managing risk, and being ready when the setup appears.

Everything you need to learn the process is inside the Momentum Trading Strategy Course. I also provide a list of books that teach many of the same timeless principles.

Learn the process.

Use the tools.

Trust yourself.

You can do this.

View on Substack ↗

The Multi-Bagger Irony

A lot of stock newsletters sell people on the hope of finding the next multi-bagger.

A 100%, 200%, or 300% winner.

Many talk about holding for years to get the big returns.

What people don't realize is this:

By the time you figure out they were full of it, they already made plenty of money selling you the hope.

The funny thing is, I don't even teach or claim to give people multi-baggers.

But many investors would likely get similar or better results by learning how to identify true growth stock leadership, proper setups, institutional demand, and strong price action.

Here are a few names I mentioned in January and early February:

• AAOI +302%

• AXTI +294%

• SNDK +249%

• DELL +214%

• MU +160%

• LITE +155%

• CIEN +147%

• STRL +127%

• STX +126%

• WDC +124%

• INTC +101%

• AMD +101%

These were discussed in the paid subscriber chat and watchlist posts.

But to be clear, this is not what I do here.

I'm not telling you to blindly buy a stock and hold it until it becomes a multi-bagger.

The goal is to teach you how to find leadership, manage risk, identify proper entries, and build a repeatable process.

View on Substack ↗

Are You Sick of Me Posting About AXTI Yet?

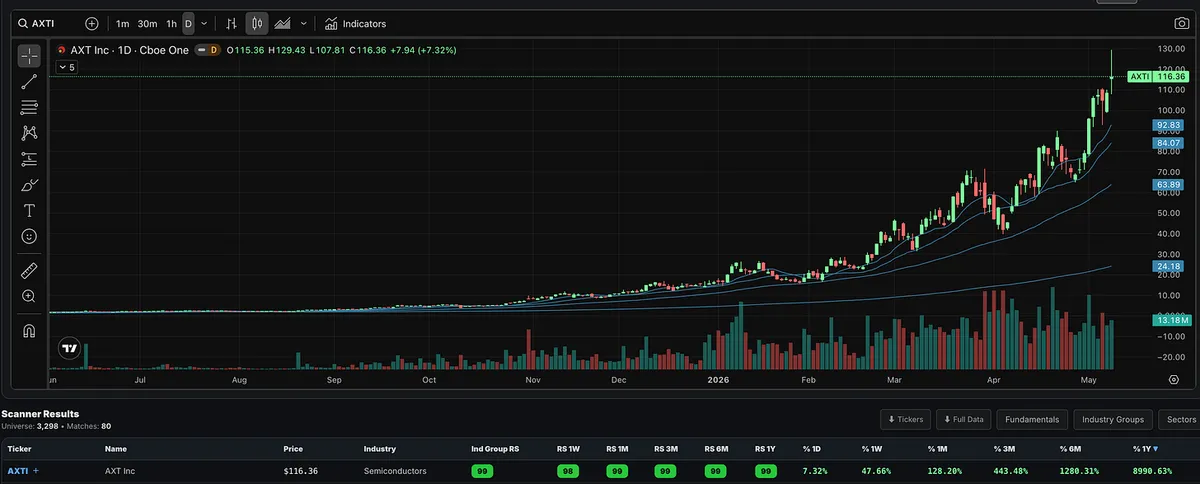
AXTI is back at all-time highs.

Are you sick of me posting about this stock yet?

Good.

Because this is the whole point of relative strength.

The strongest stocks usually keep showing up before everyone wants to believe them. They keep appearing on the screens. They keep building higher. They keep forcing you to either pay attention or make excuses.

That does not mean you chase.

That does not mean you FOMO into the trade.

And it definitely does not mean the stock can’t pull back or that the trend will last forever.

But when a stock keeps showing up with strong price action, strong relative strength, strong earnings and sales, and strength from a leading industry group, it deserves to stay on the radar.

This is where a lot of traders make the mistake.

They miss the first entry, take it off the watchlist, and never come back.

Or the stock pulls back, and they assume the move is over.

But leading stocks can trend for months.

AXTI has been doing exactly that.

So the better question is not, “Did I miss it?”

The better question is:

Is the trend still intact, and is the stock still acting like a leader?

“The trend is your friend except at the end when it bends.” — Ed Seykota

And right now, AXTI still hasn’t bent.

View on Substack ↗

AXTI still refuses to quit.

Still making new highs and once again sitting near the top of my relative strength screen.

Current RS profile:

Industry Group RS: 99

Stock RS: 99

  • AI bull market theme.

  • Semiconductors are one of the leading industry groups.

  • AXTI is one of the leading stocks in that group.

That is exactly the type of alignment I want to see in a growth-led market: strong theme, strong group, strong stock.

View on Substack ↗

“Relative Strength Doesn’t Work.” Okay.

“It only finds extended names.”

“I don’t want to buy strong stocks because they’ve already moved too much.”

I hear this all the time.

Most of that fear does not come from relative strength being flawed.

It comes from people not knowing how to manage risk, or frankly, not studying big winning stocks cycle after cycle.

If you understand position sizing, proper entries, logical stops, and low-risk, high-reward setups, high relative strength is not something to fear.

It is something that should grab your attention.

AXTI is a great example.

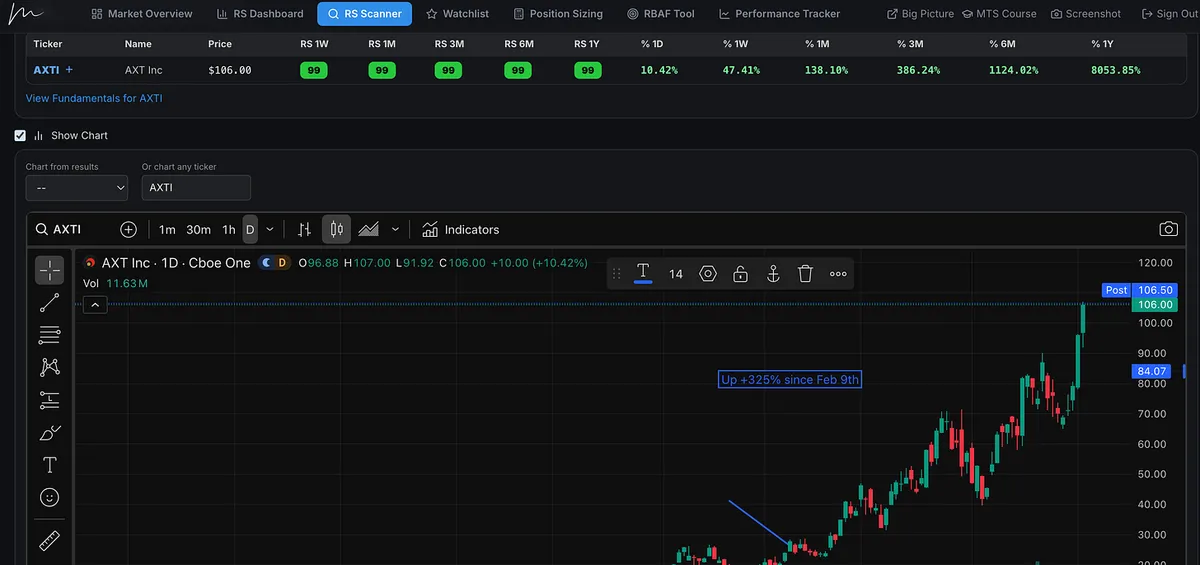
Back in February, it had a 99 RS and was sitting near the top of my Relative Strength Stock Screener.

It kept showing up week after week.

Month after month.

And since then, it has gone up more than 325%.

That is what strong stocks often do.

They go much higher than most people expect.

And weak stocks often go much lower than most people expect.

AXTI also had something else going for it:

A strong stock, in a strong group, aligned with a major bull market theme.

That is a principle that has shown up in market leaders for decades.

Follow relative strength.

Do not fear strength just because other people do not know how to manage risk.

If the trade does not work, you get out with a small loss.

If it works, you have the potential for a huge gain.

View on Substack ↗

Strength Tells You Where to Look

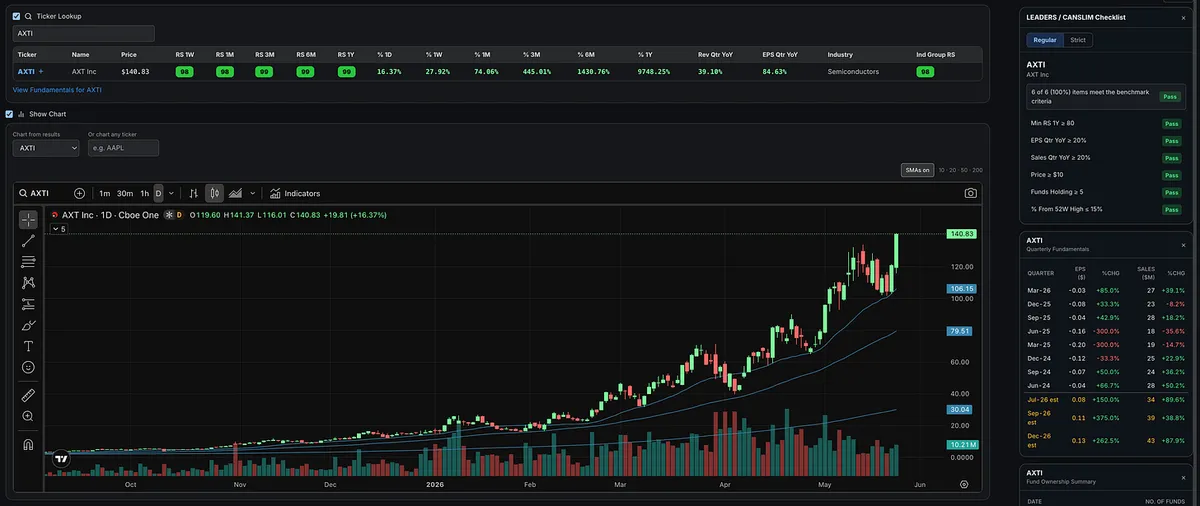
AXTI continues to show strong relative strength and trend higher.

This is what leadership looks like:

  • Higher highs

  • Higher lows

  • Strong price action

  • Demand on pullbacks

While most traders chase headlines, the real signal is already on the chart and showing up in relative strength.

And for those who think the window is small, it’s not.

AXTI has been showing up on the Relative Strength screener for months.

This isn’t new.

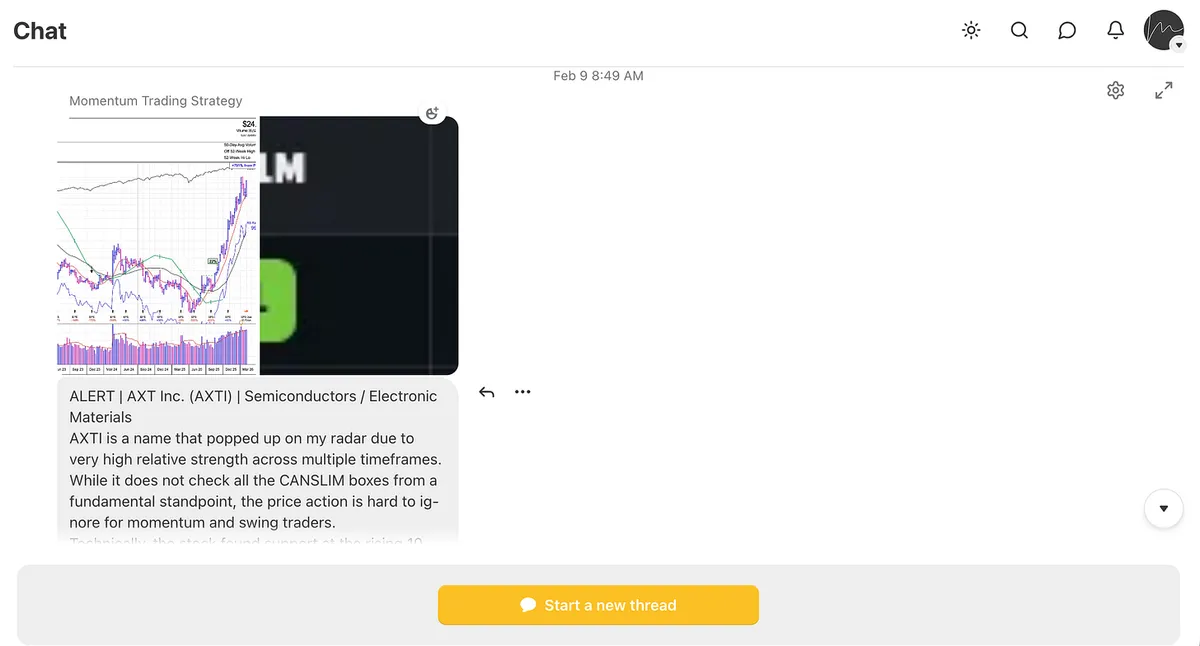
Shared in the subscriber chat back on February 9th. Now up 200%+.

If you’re not using relative strength to find leaders like this, you’re making trading harder than it needs to be.

View on Substack ↗

If I Could Only Run 1 Scan the Rest of My Life It Would Be Relative Strength

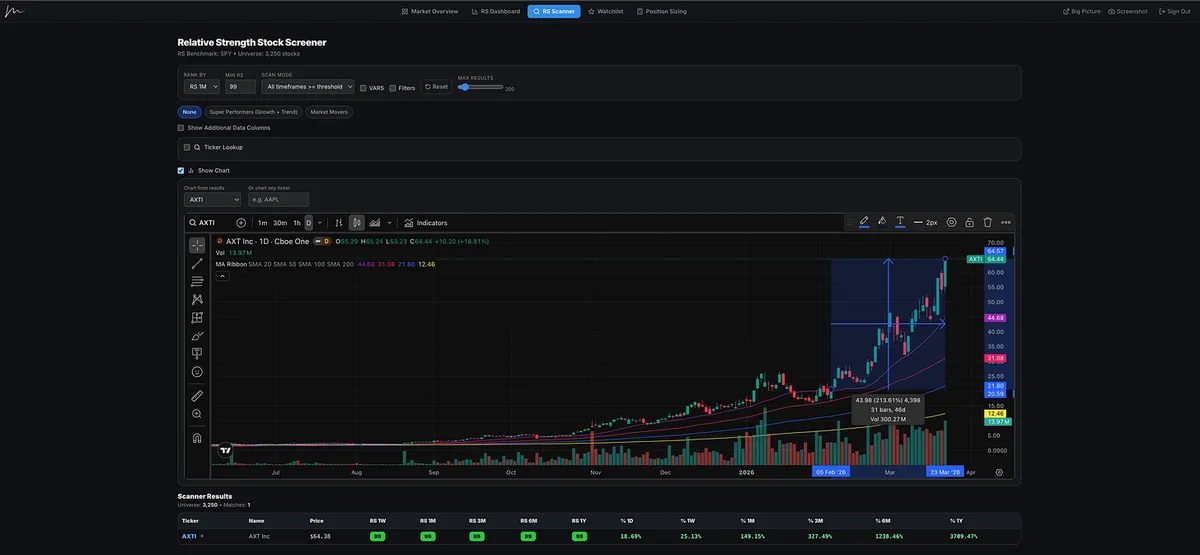
$AXTI has been absolutely crushing it. It’s been showing up for months and I’ve been sharing it consistently. Up 213% since February 5th.

I didn’t find it. The RS scan did. Nothing fancy.

Many of the biggest names I’ve found and put on your radar all come from this one simple scan.

There’s a reason for that.

It’s why O’Neil made it the L in CANSLIM. It’s why Kristjan Kullamägi focuses on the top 1 to 2 percent across multiple timeframes. It’s why Minervini builds it into his trend template.

The best stocks don’t hide. They show up over and over again.

Relative strength just helps you see it.

👉 Paid subscribers can run this exact scan here: https://tradingmomentum.substack.com/p/the-relative-strength-screener-just

On SubstackThe Relative Strength Screener Just Leveled Up
View on Substack ↗

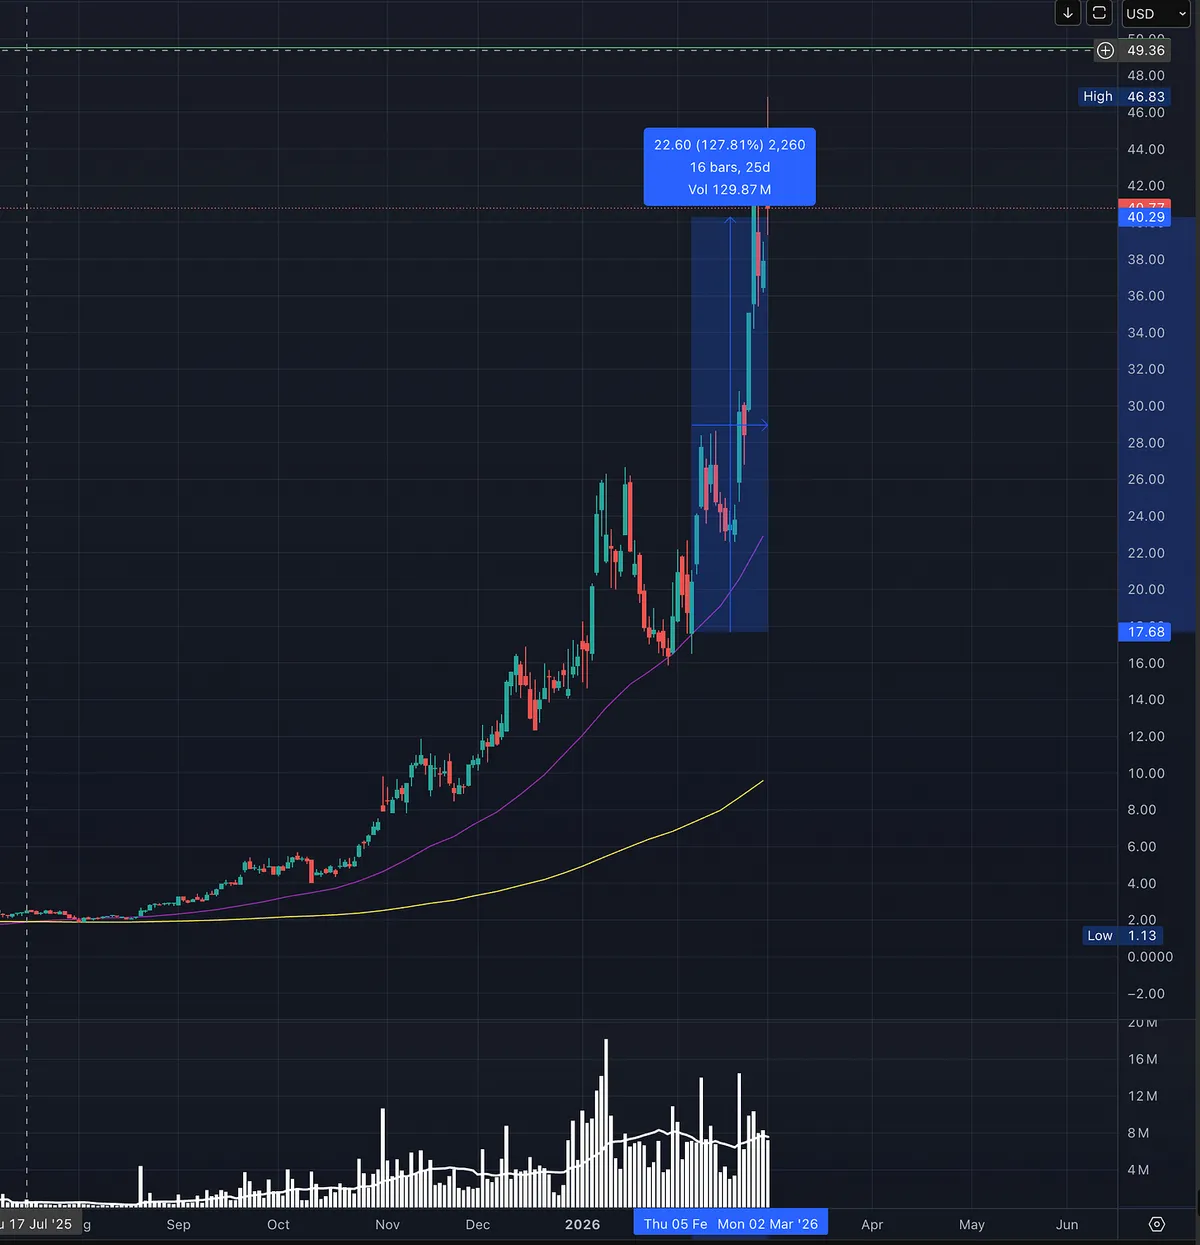
AXTI Is Up 127% Since I Flagged It in Chat

On February 5th, I mentioned AXT Inc. to paid subscribers in the chat.

Why?

It was showing up on my Relative Strength screener and pulling back to a key moving average that had been supporting price.

Nothing fancy.

No crystal ball.

Just strength plus constructive pullback.

Since then, the stock is up 127 percent.

Am I some stock picking guru?

Absolutely not.

I learned from people far more successful and intelligent than me. I just follow the process.

Here’s the truth most people do not want to hear.

I have more losers than winners.

The difference?

My winners pay for the losers and then some.

Bottom line.

I cut my losses short.

And I let my winners run.

That is the entire game.

View on Substack ↗

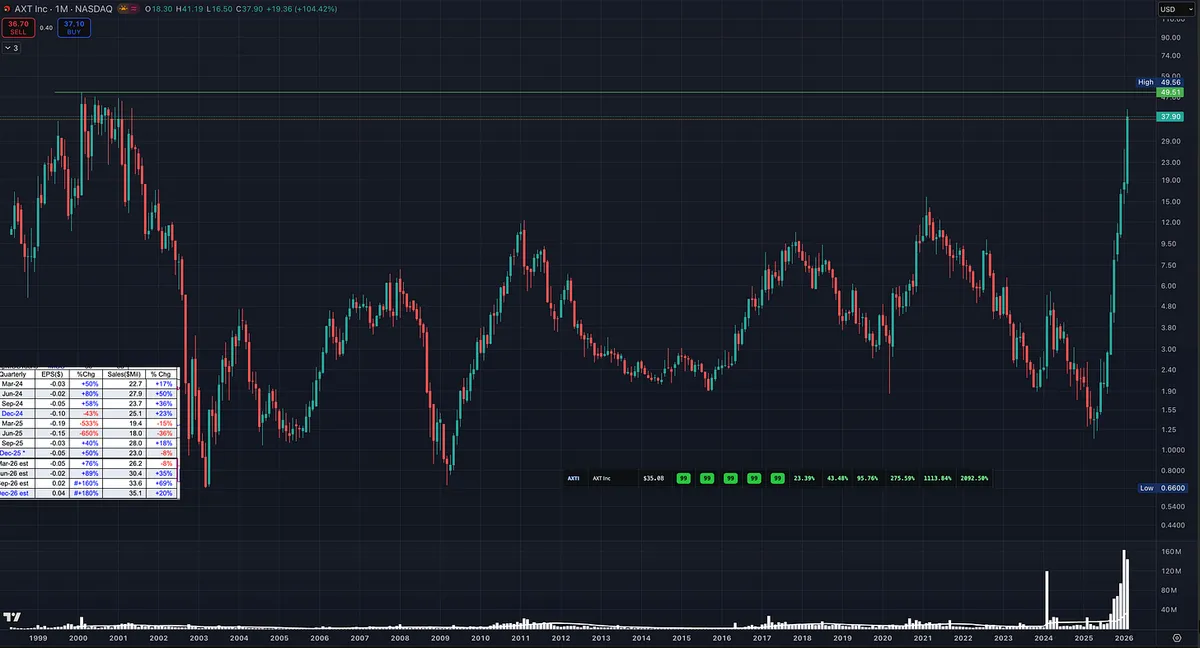
AXTI Is Up 3,000%… And Almost Back to Its 2000 Highs

Up 3,000 percent!

Found this one on my Relative Strength scanner.

From dot com darling to a 98 percent collapse.

AXT Inc. topped near 50 dollars in 2000.

Then it fell apart.

For 25 years it went nowhere. No sustained leadership. Just lower highs and dead money.

And then April 2025.

Right after the Nasdaq bottomed during the tariff scare and ripped higher, AXTI quietly turned up from under a dollar.

Since then it has surged more than 3,000 percent.

Now it is pressing into a 25 year ceiling with:

• 99 RS

• Explosive multi time frame strength

• Surging volume

• Sales and earnings estimates accelerating

Forward projections into 2027 are eye opening. Some estimates show earnings growth of over 11,000 percent off depressed levels.

The real question is not the percentage.

It is durability.

Is this:

A one cycle rebound fueled by tariff relief and the domestic semiconductor narrative?

Or the start of a true Stage 2 institutional move backed by sustainable earnings power?

A lot of investors get scared at all time highs.

But when you study the biggest winning stocks in history, that is often when their real run begins.

This is a U.S. based semiconductor materials company headquartered in Fremont, California. In a world worried about Taiwan supply chains, that story matters.

But price is now testing a level that trapped investors for 25 years.

Clear 50 with real volume and tight action and this becomes historic.

Fail here and it becomes just another high flyer that ran too far too fast.

Either way.

What a move.

View on Substack ↗

If You Want Big Winners, Start With Relative Strength

Before a stock makes a massive move, it almost always shows one thing first.

Relative strength.

I spot nearly every big winner the same way. It shows up on a relative strength scan before it shows up on social media, before it becomes obvious, before the breakout gets attention.

Running a daily relative strength screen takes minutes.

When you start seeing the same names appear day after day, week after week, that is your signal.

That is not noise. That is accumulation.

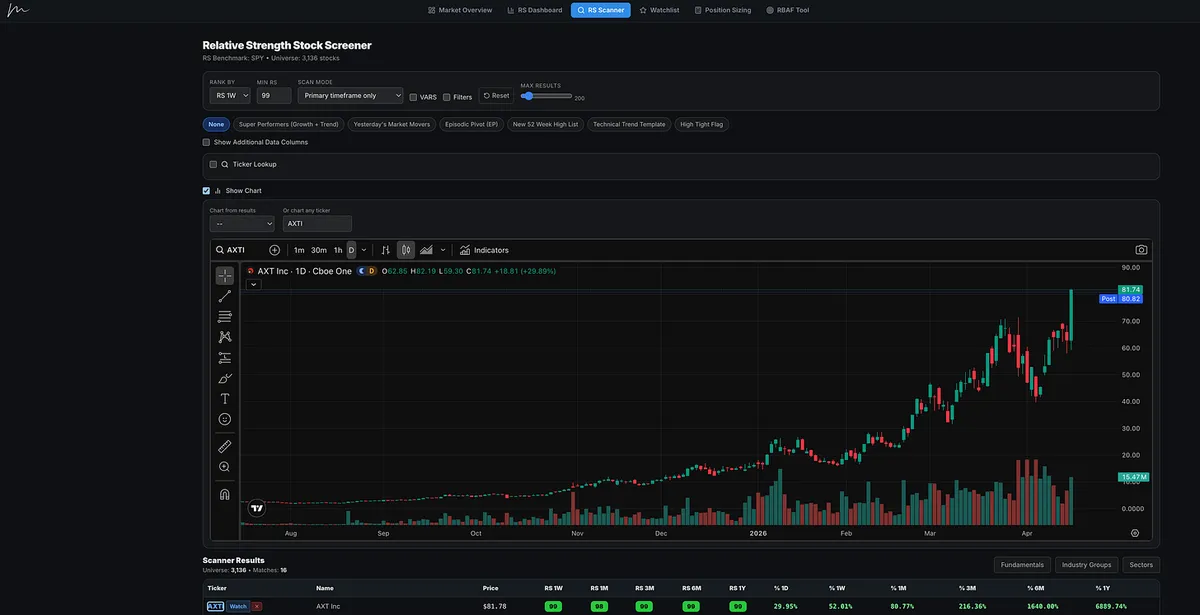
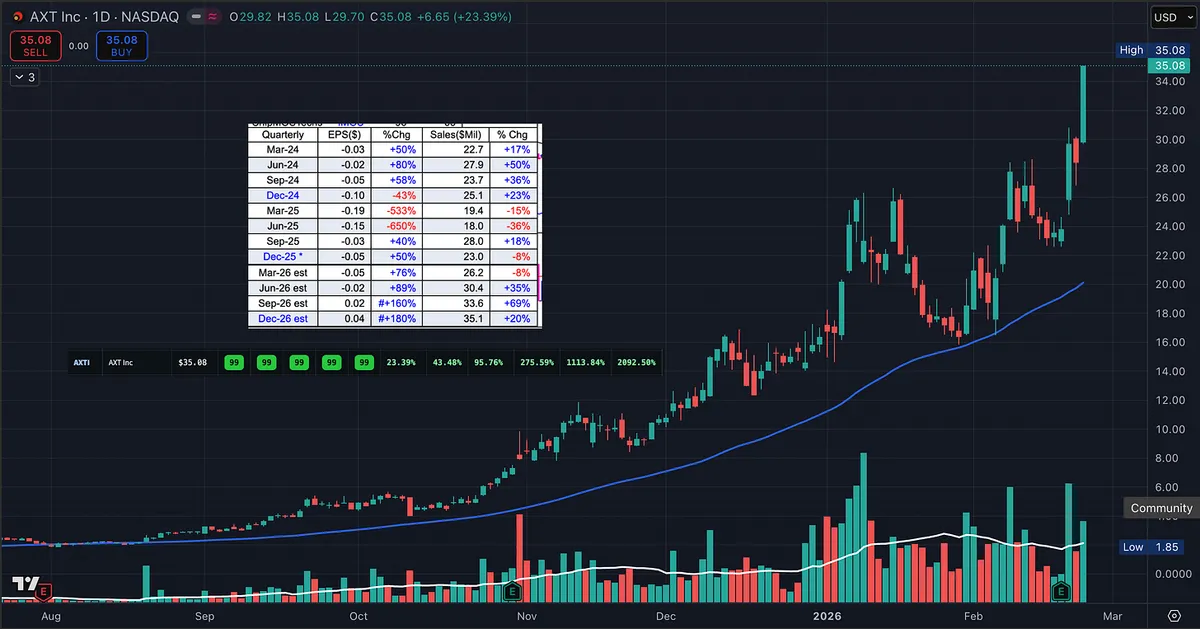
Look at AXTI.

RS 1W: 99 RS 1M: 99 RS 3M: 99 RS 6M: 99 RS 1Y: 99

That is sustained outperformance across every meaningful timeframe.

Now look at the returns:

1 month: +95% 3 months: +275% 6 months: +1113% 1 year: +2092%

Big winners do not come out of nowhere.

They begin by outperforming the market quietly.

Institutions accumulate strength, not weakness. Capital flows toward leaders.

Relative strength tells you:

• Where money is going

• Which stocks are being accumulated

• Who is leading right now

If you want to catch outsized moves, stop looking for cheap.

Start looking for strong.