Momentum Trading Strategy

Notes

Short lessons on momentum trading, every day.

Every note from Substack, in one place: risk, setups, leading stocks, market conditions and the mindset behind them. Search them, browse by topic, or filter by stock.

Showing 1–20 of 40 notes

$SNDK ×
View on Substack ↗

When the Leaders Stop Leading, Pay Attention.

The indexes can still look reassuring while the stocks that carried the market higher are beginning to deteriorate. That change deserves your attention.

In How to Make Money in Stocks, William O’Neil identifies the behavior of leading stocks as the second most important indicator of a major change in market direction, after the daily market averages.

Tracking distribution days is part of the process. The next step is examining the individual leaders:

  • Abnormal selling: Sharp price breaks on heavy volume.

  • Poor recoveries: Leaders struggle to recover after those declines.

  • Deteriorating bases: Price action becomes wide, loose, and erratic, particularly in third or fourth-stage bases.

  • Climax runs: After months of gains, a leader suddenly accelerates for two or three weeks.

  • Weakening leadership: Sound buying opportunities become scarce while lower-quality, speculative laggards attract attention.

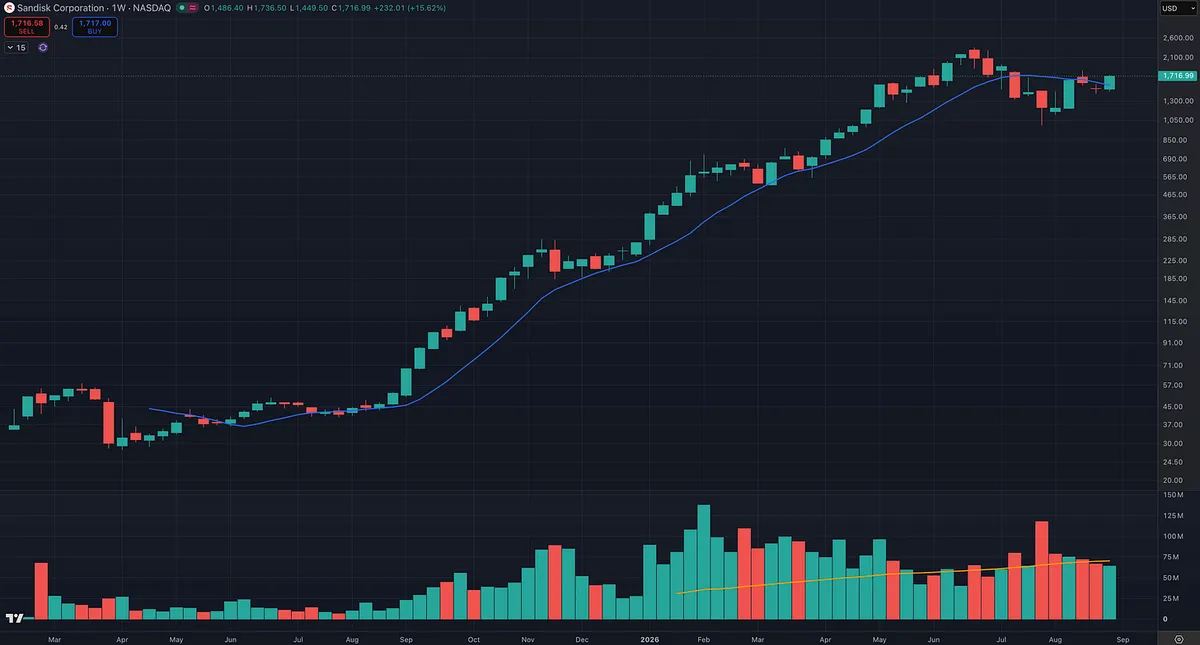
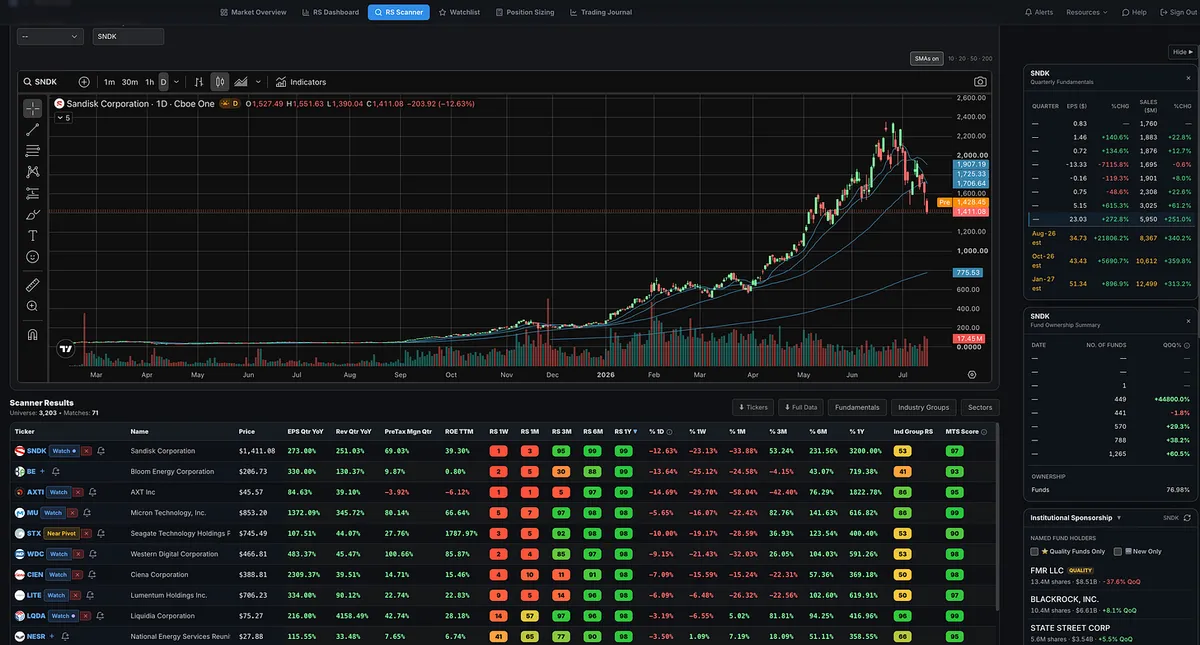
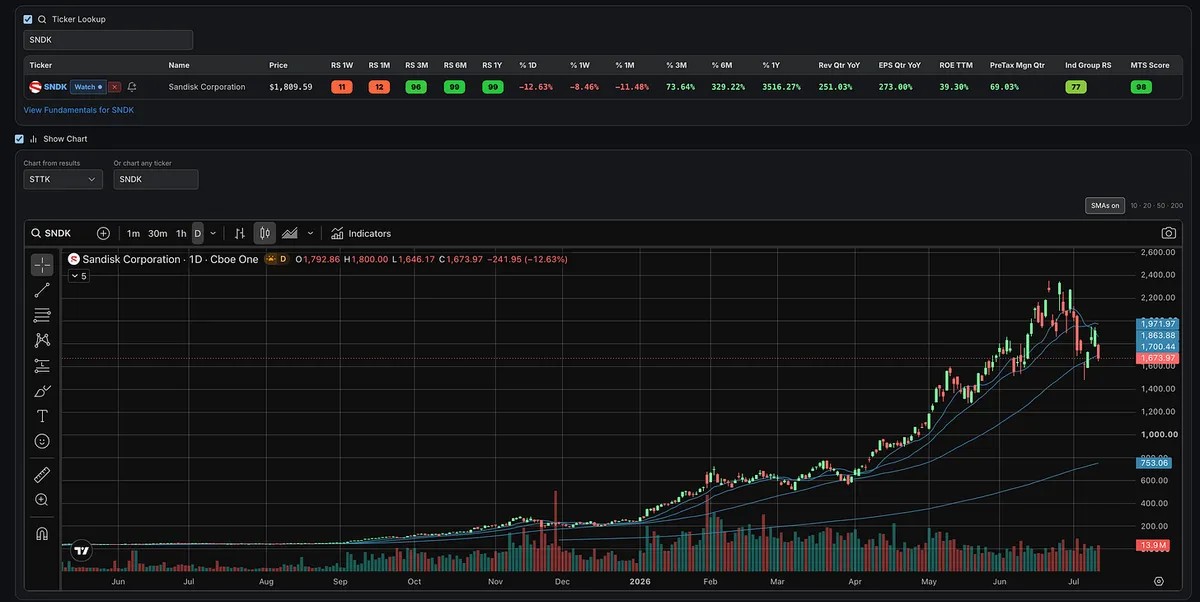
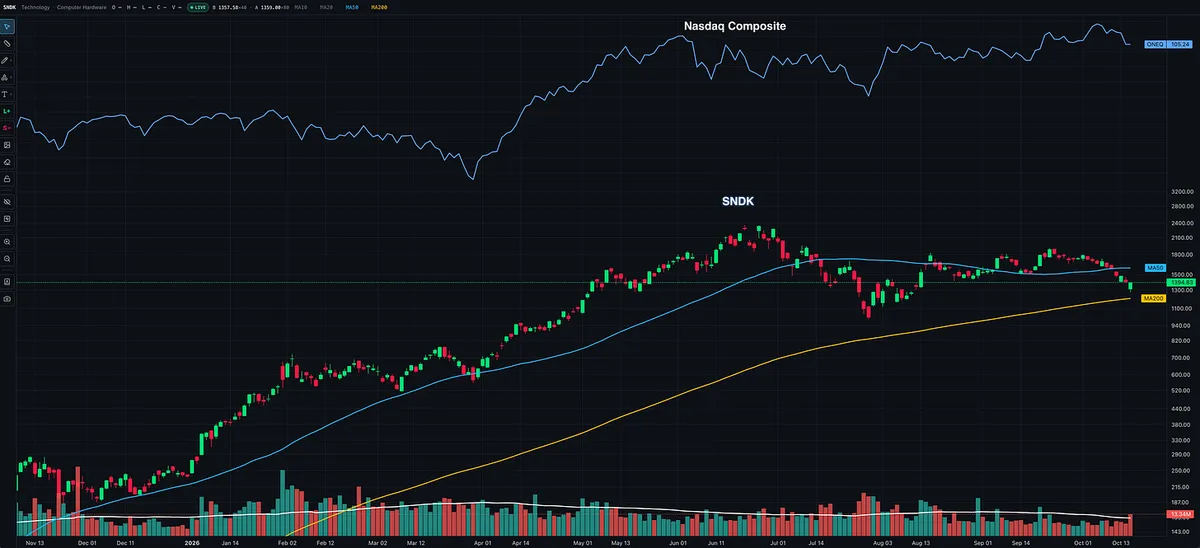
Look at SNDK in the attached chart. After a powerful advance, it peaked in June and declined substantially. Subsequent rallies failed to reclaim that peak, and the stock has fallen back below its 50-day moving average.

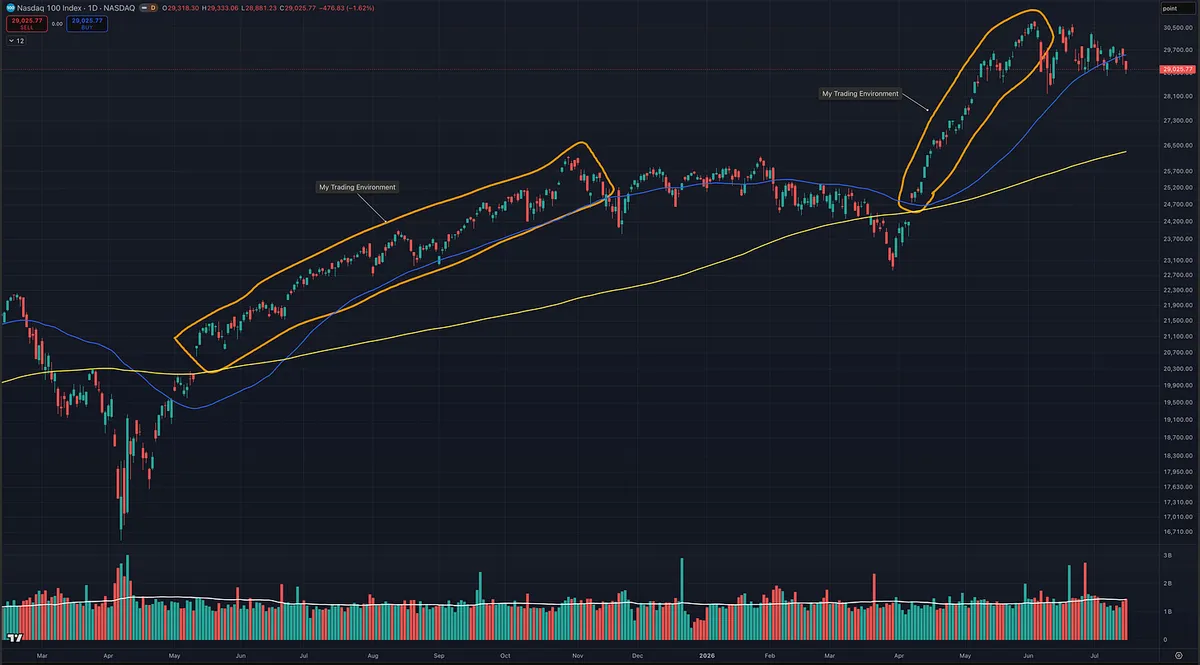
Meanwhile, ONEQ, the Nasdaq Composite ETF shown by the blue line, went on to new highs. The broader benchmark’s strength has not been matched by this prior winner.

O’Neil also suggests reviewing your last four or five purchases. If none has made progress, that may be another clue that conditions are changing.

One struggling stock doesn’t establish a market top. But when abnormal behavior spreads across the leaders while distribution builds in the indexes, the warning becomes more significant.

A stock’s past leadership is no guarantee of its future strength. Keep watching how it acts.
View on Substack ↗

Missed the Breakout? Learn to Buy the Pullback.

A stock moving beyond its base breakout doesn’t mean you’ve missed every opportunity to get involved. But if you want to participate in the next leg higher, you need to learn how to recognize and buy constructive pullbacks.

You also need to understand which entries the market is rewarding.

Just as we study the market environment, we should study how leading stocks are behaving.

Are breakouts to new highs following through? Or are better opportunities appearing earlier, as stocks find support and begin turning higher?

If you’re always waiting for a new high before entering, pay attention to how much of the move has already happened by the time you buy.

Buying pullbacks has been critical for me over the last few years. It has helped me get involved in several of my biggest winners. LITE and SNDK.

The key is recognizing a pullback within an established uptrend, watching for evidence of support, and identifying an entry where you can clearly define your risk.

Study more than which stocks are working. Study which entries are working.

That can make a meaningful difference in both the opportunities you recognize and the risk you take.

View on Substack ↗

The Best Setups Often Look the Scariest

Some of the strongest stocks will look expensive by the time you notice them.

That doesn’t automatically make them bad trades.

I want stocks showing relative strength. A strong advance gets my attention, then I look for a proper setup where I can define my entry and risk.

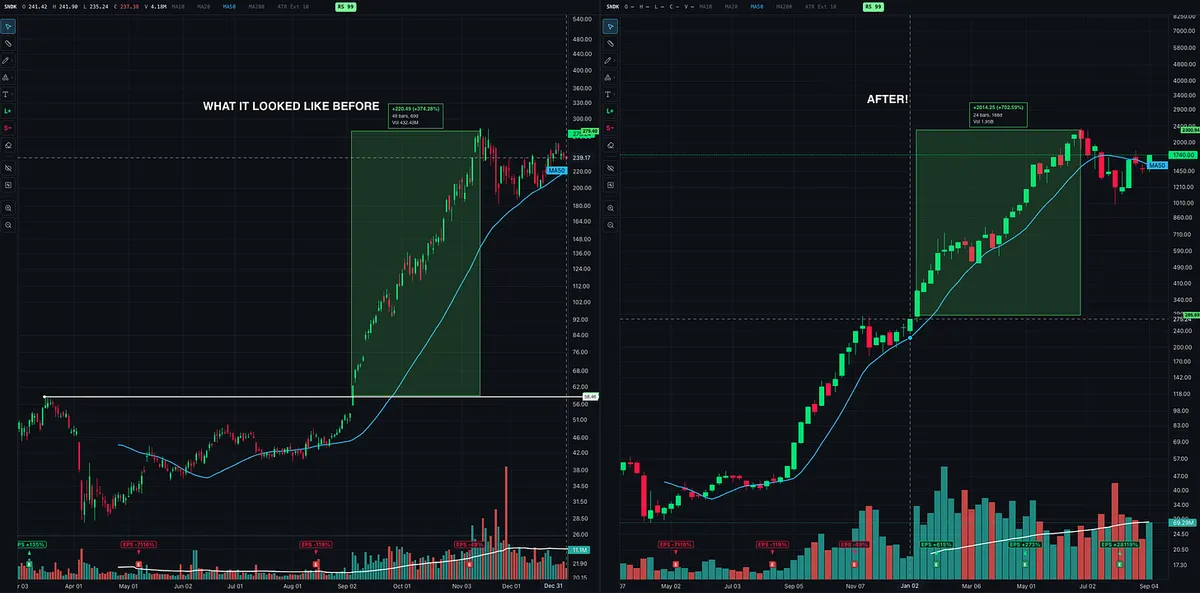
Look at SNDK. The first highlighted advance was roughly 374%. It then consolidated, and the next marked advance was roughly 703% to the later peak.

If I dismissed it because it had “already gone up too much,” I would have stopped looking before the next setup developed.

The trap is letting the price you could have paid months ago determine whether today’s opportunity deserves consideration.

A strong stock still needs a proper entry, a logical stop, and a position size that fits the risk. Its earlier advance doesn’t replace any of that.

Don’t confuse discomfort with danger. Judge the setup in front of you, not the price you wish you had paid.

View on Substack ↗

Stocks Like SNDK Are Nothing New

Over the last year, I’ve heard people talk about massive winners like SNDK as though these moves are something unique to modern markets. Open William O’Neil’s How to Make Money in Stocks and study the historical charts. You’ll find stock after stock, across more than a century, that looks remarkably similar to the leaders we see today.

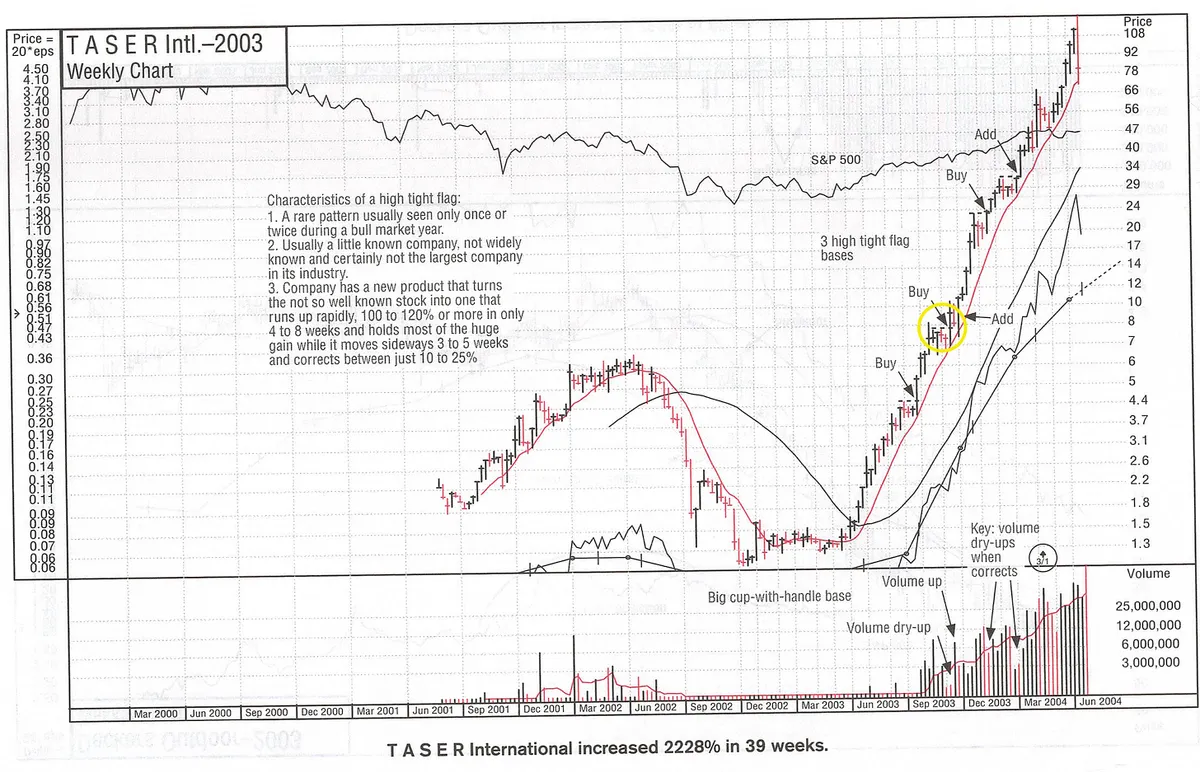
Look at TASER in 2003. O’Neil’s chart identifies three high tight flag bases during an advance that ultimately produced a 2,228% gain in 39 weeks. Notice the buy and add points as the stock keeps moving into new highs.

I’ve shared and discussed many stocks with similar patterns over the last couple of years, and the response is often the same: “It looks too extended.” But a stock having already made a huge move doesn’t automatically mean its next setup is unbuyable. I think some traders are missing what bull flags and pennants actually look like, and how tight consolidations or pullbacks can provide opportunities to enter and manage risk. They let fear or memories of past failed trades keep them from taking the next valid setup, potentially missing a huge opportunity.

If you call yourself a growth stock investor or momentum trader, study the biggest winning stocks in history. Buying strength and new highs is central to this discipline. We look for powerful stocks forming valid setups, and we use sell rules to cut losses when we’re wrong and protect gains as trends break down.

History gives us the confidence to buy strength. Discipline helps us manage the risk.

View on Substack ↗

Every Market Cycle Has a “Big Stock.” But the Real Clue Is Usually the Industry Group Behind It.

The market’s biggest winners rarely emerge alone. They are usually part of an industry group benefiting from a powerful new fundamental trend.

2023: AI Compute and Semiconductors

This marked the beginning of a new bull market and the emergence of the generative AI theme.

Big leaders:

  • $NVDA | Nvidia

  • $SMCI | Super Micro Computer

NVDA became the face of the cycle, but the leadership was much broader. Chips, servers, networking equipment, and the entire data-center buildout were beginning to move.

2024: AI Software, Data Platforms, and Power

Leadership expanded from companies building the AI infrastructure to those finding ways to monetize and support it.

Big leaders:

  • $PLTR | Palantir

  • $APP | AppLovin

AI adoption spread into software, data platforms, advertising optimization, networking, and power generation. The theme was evolving, but the underlying driver remained the same.

2025: Memory, Storage, and the AI Data Stack

The market’s attention shifted toward the next major bottleneck. AI systems required enormous amounts of high-performance memory, flash storage, and data-center capacity.

Big leaders:

  • $SNDK | SanDisk

  • $WDC | Western Digital

  • $STX | Seagate Technology

  • $MU | Micron Technology

These became some of the market’s biggest winners as demand for AI memory and storage accelerated.

2026: The Memory Supercycle Continues

Leadership continued into 2026 and semiconductors remerged as a leading group rather than transitioning into an entirely new theme.

Leaders:

  • $SNDK | SanDisk

  • $MU | Micron Technology

  • $STX | Seagate Technology

  • $WDC | Western Digital

But don’t overlook what happened outside the dominant AI theme.

Metals and mining also developed into a major winning group during this bull market period 2024-2026. The market can have one dominant secular story while still producing powerful leadership in completely different areas.

The next monster winner probably won’t be random.

It will likely emerge from a strengthening industry group with accelerating earnings and sales, increasing institutional sponsorship, elite Relative Strength, and a chart that refuses to break.

2023: AI compute and semiconductors

2024: AI software, data platforms, and power

2025–2026: AI memory, storage, semis

Meanwhile, metals and mining proved that major leadership can still emerge outside the market’s primary theme.

What industry group do you think becomes the next true market leader for 2026–2027?

View on Substack ↗

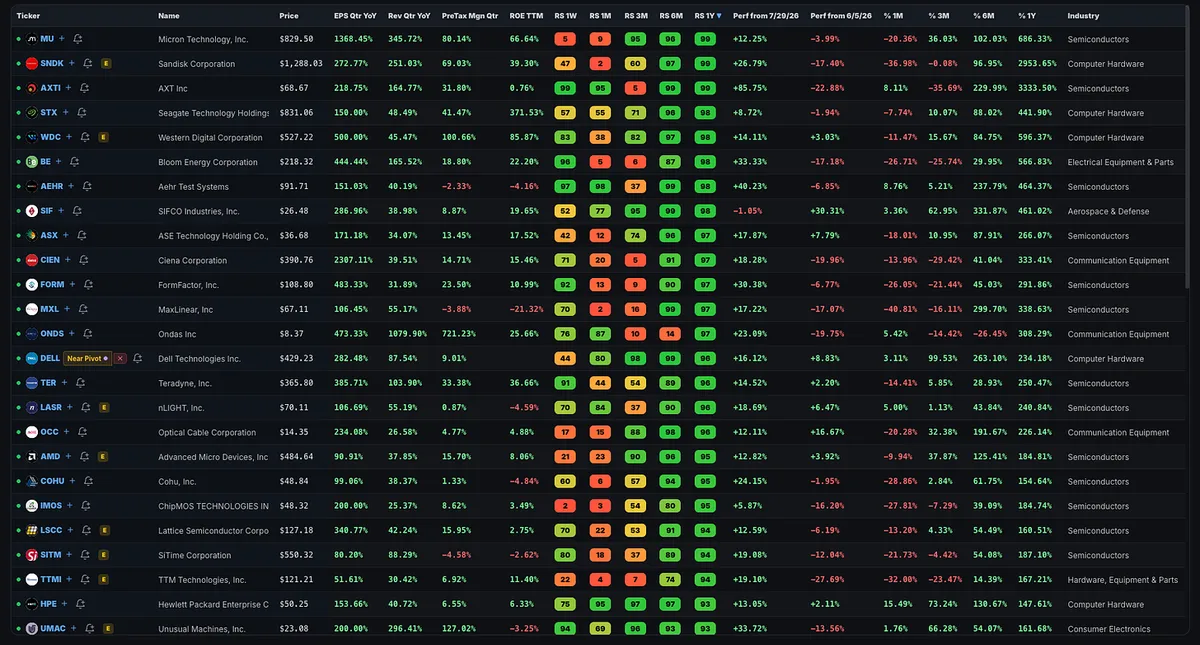
When Low Short-Term Relative Strength Is Actually Bullish (Most Traders Get This Wrong)

A lot of traders misunderstand what they’re seeing when they sort stocks by Relative Strength.

When a stock is ripping higher, you’ll usually see strong RS across nearly every timeframe: 1-year, 6-month, 3-month, 1-month, even 1-week.

But that’s also usually when everyone starts saying:

“It’s too extended.”

The more interesting opportunity can appear when a major leader finally starts to consolidate.

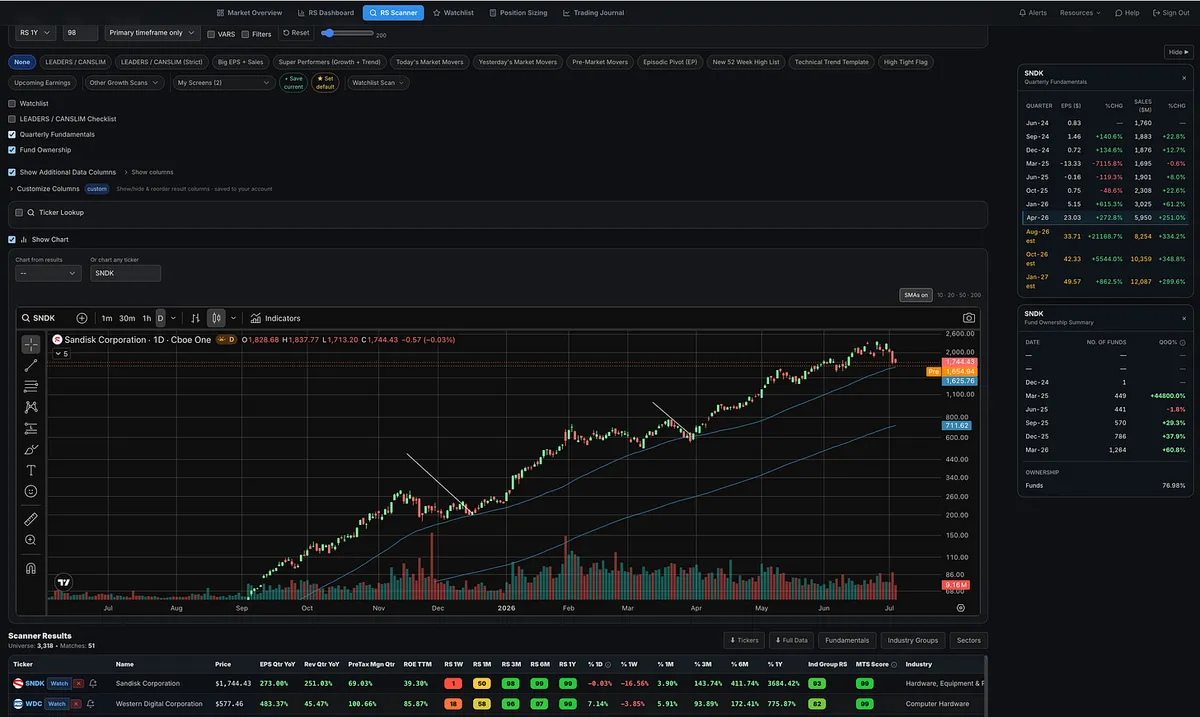
In this SNDK example, the stock still had elite longer-term Relative Strength, but its shorter-term RS started falling as price consolidated, found support, volume dried up, and higher lows began forming.

At first glance, that weaker short-term RS might look bearish.

But in the right context, it can be exactly the opposite.

It can be telling you that a powerful leader has finally stopped running long enough to build another potential buying opportunity.

That’s the part many traders miss.

But there’s a catch.

The exact same RS relationship can also appear when a former leader is actually breaking down.

If price loses important moving averages, fails to reclaim them, starts making lower lows, and the overall chart deteriorates, then falling short-term RS may be confirming that the stock’s leadership is ending.

Same Relative Strength readings. Completely different message.

That’s why I never use Relative Strength in isolation.

A screener can help me find the stock.

Price, volume, trend, and the chart tell me what the RS actually means.

This clip comes from a longer video where I walk through some of the exact stock screens I personally use inside MTS Velocity, including how I combine different Relative Strength timeframes, fundamentals, volume, trend, and market context to narrow thousands of stocks down to the names I actually want to study.

The full video and MTS Velocity Stock Screener are available to all paid subscribers.

Watch the video on Substack →
View on Substack ↗

This Is One of My Favorite Price Patterns to Watch

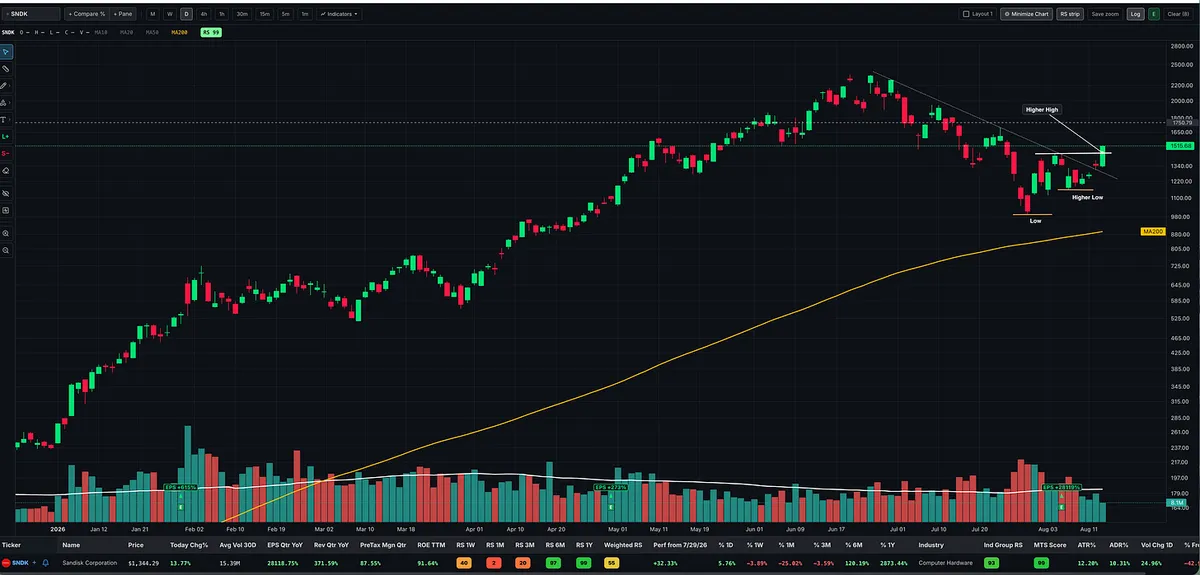
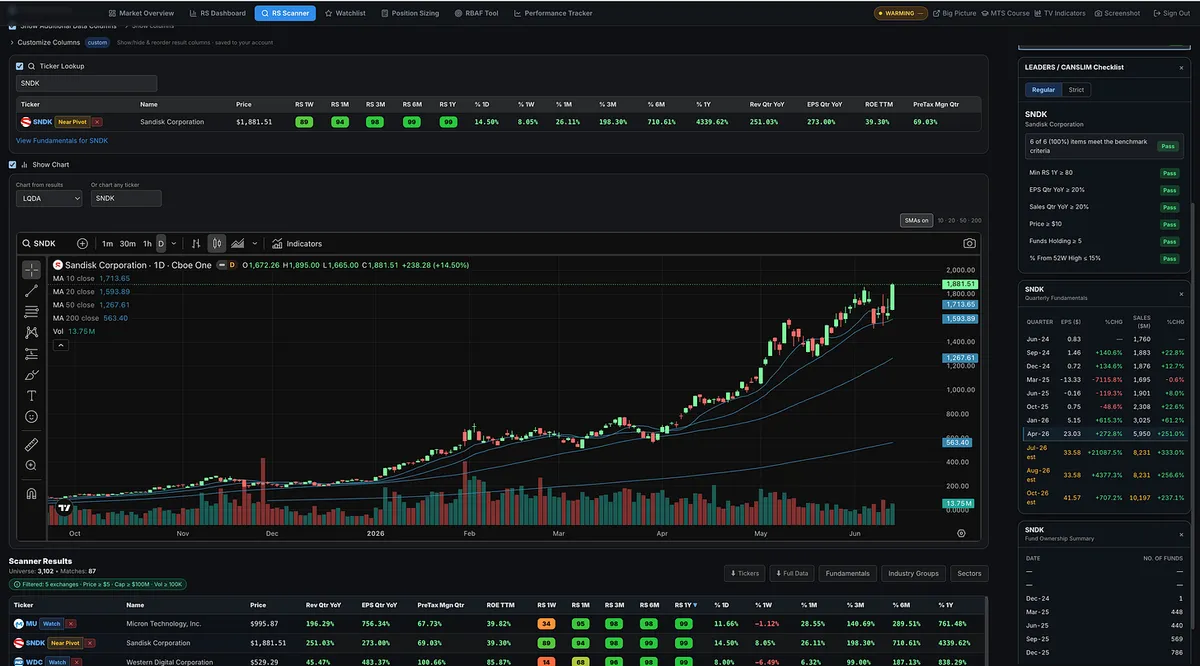
SNDK is showing up near the top of today’s market mover scan.

Big earnings growth. Big sales growth. Strong relative strength. And now the price action is starting to get interesting.

Look at the chart.

SNDK put in a low, rallied, pulled back without making a new low, and formed a higher low.

Today it pushed above the August 4 swing high, giving us the next higher high.

Higher low → Higher high.

This is one of my favorite patterns to watch because I’m not trying to guess the exact bottom. I want price to start showing me evidence that the trend may be changing.

There are still plenty of reasons to remain patient.

The stock is still below its 50-day moving average, and I would like to see more volume coming into the advance.

And this stock has a lot of work left to do.

From around current prices, SNDK would still need to climb more than 50% just to get back to its June highs.

So I’m not saying the stock is suddenly fixed or that it has to go back to the highs.

I’m simply saying:

This is the type of price action that gets my attention.

Strong fundamentals get the stock on my radar.

Price has to earn the trade.

View on Substack ↗

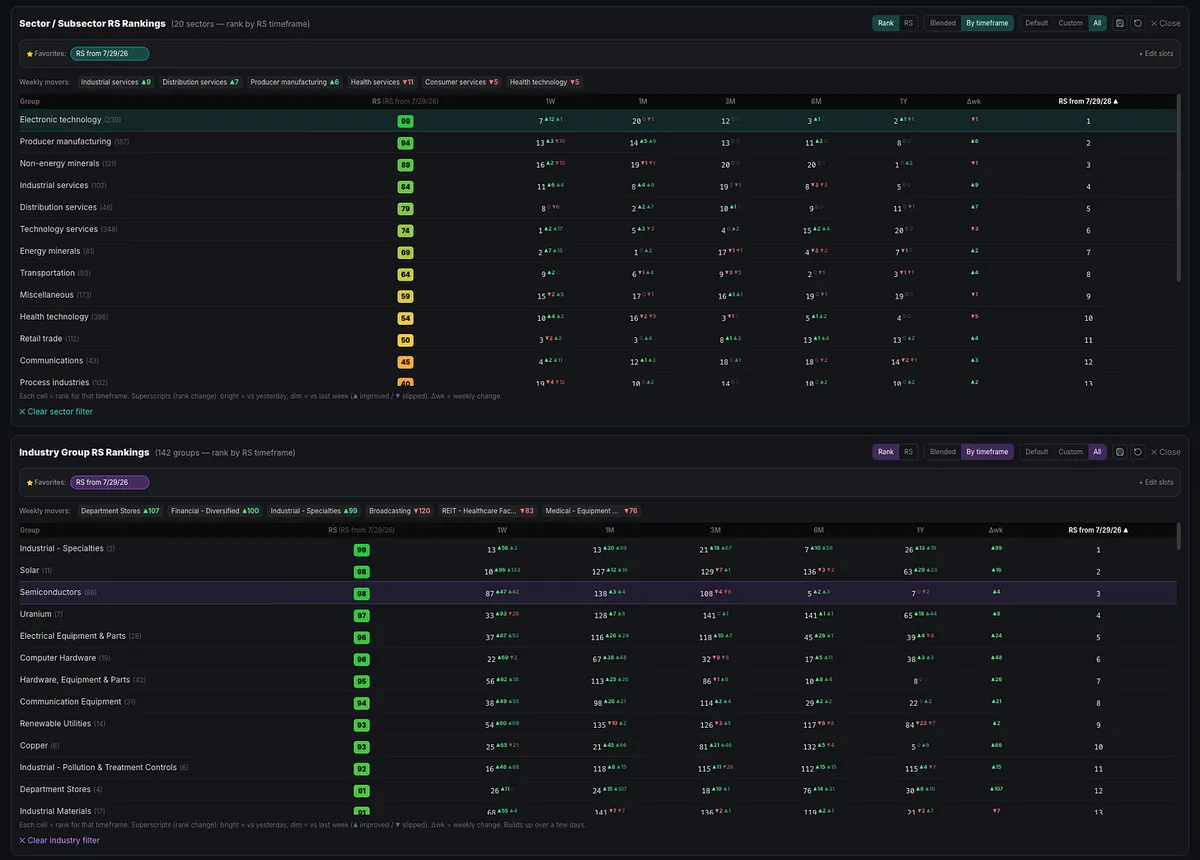
The Old Leaders Are Waking Back Up

The strongest sectors and industry groups since the July 29 low are many of the same areas that led the market over the past year:

Technology

Semiconductors

Electrical Equipment and Parts

Computer Hardware

Electronic Equipment and Parts

Communication Equipment

These areas took a beating after major runs in many of their leading stocks.

We will see whether the market produces a follow-through day today or in the coming days, and whether these groups can reclaim their prior leadership.

Many of the former leaders, including SNDK, MU, BE, CIEN, and PENG, were hit hard and still have significant ground to recover.

But the areas that led before the correction are once again showing some of the strongest relative performance off the lows.

View on Substack ↗

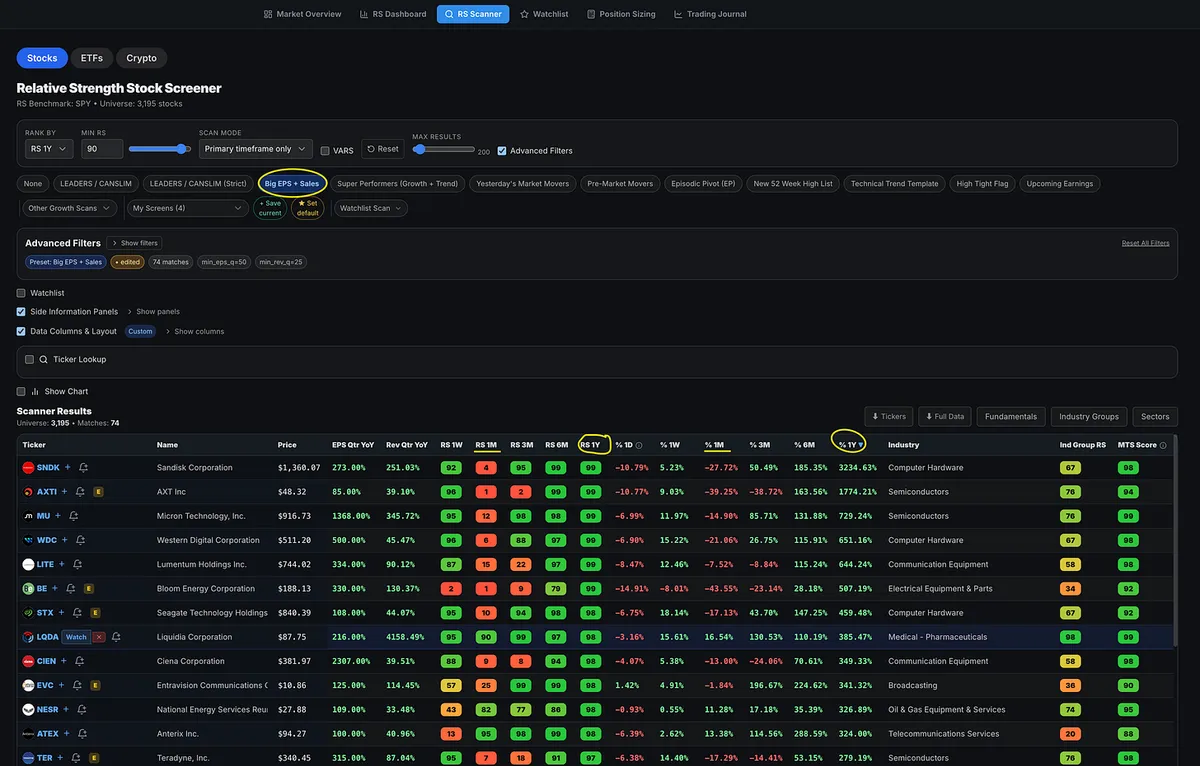
The Market Shift Was Hiding in the Screens

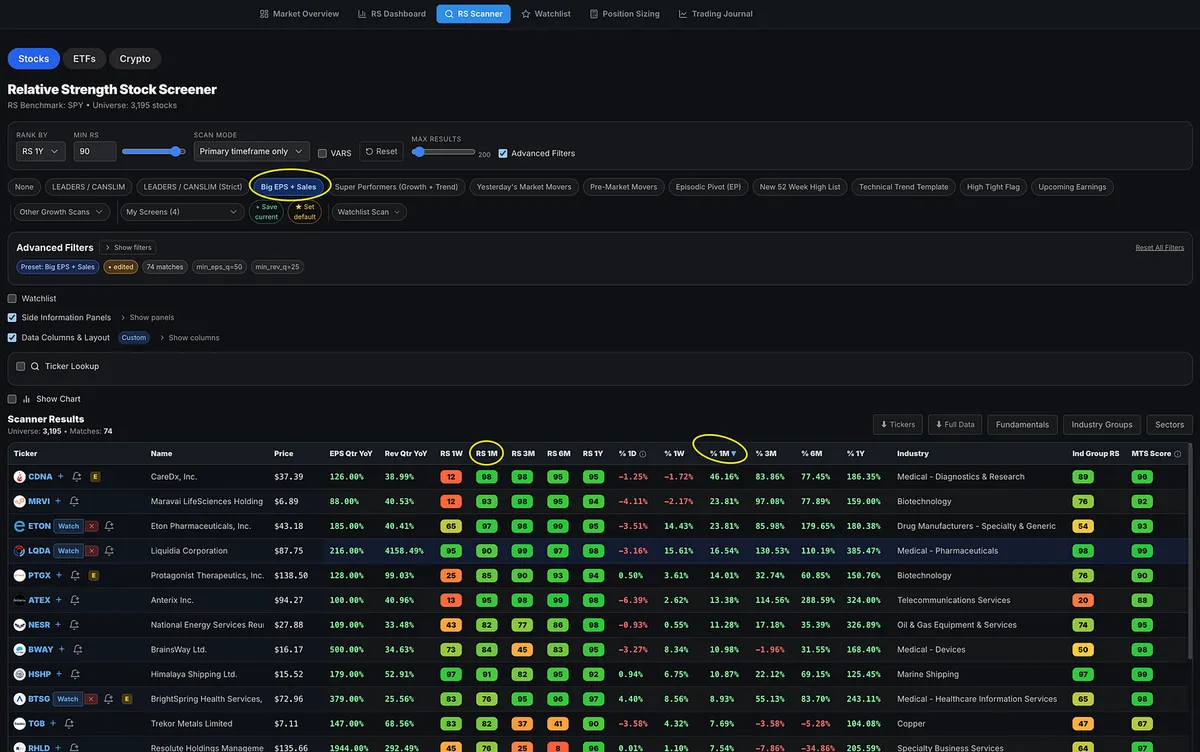
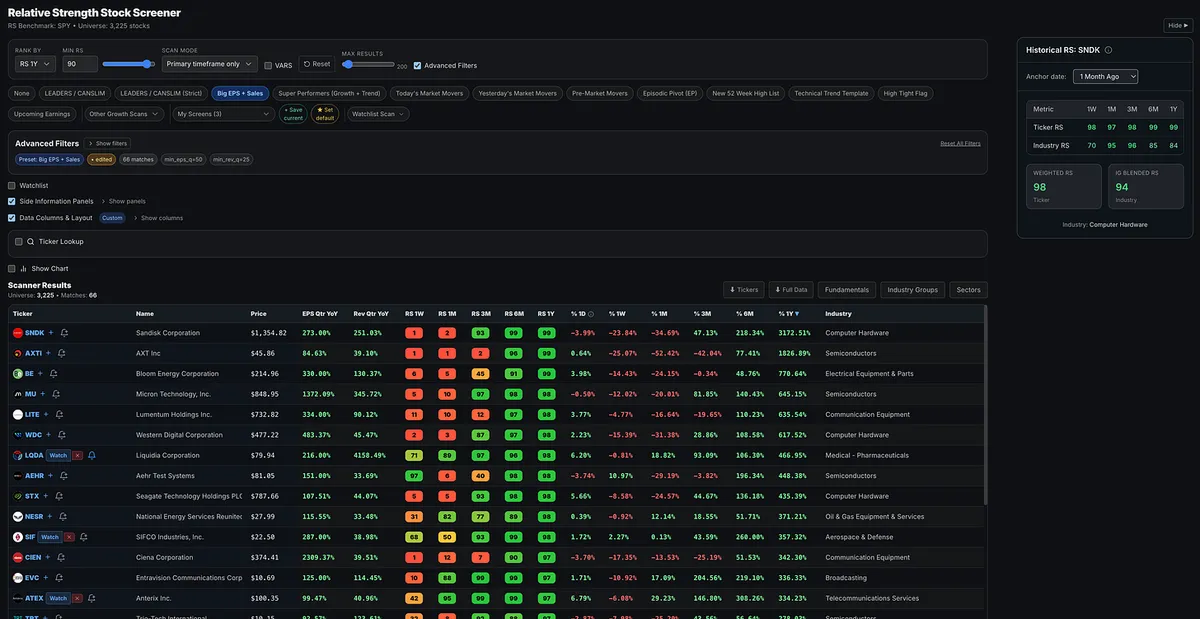
One of my favorite scans, and one I ran for years in MarketSurge, is the Big EPS and Sales screen. I now run the same scan inside the Momentum Trading Strategy software.

When you sort the results by one-year relative strength, the familiar leaders dominate: SNDK, MU, LITE, WDC, WTX, TER, etc.

The strongest groups are also the ones we have become accustomed to seeing: semiconductors, computer hardware, telecom, and communications equipment.

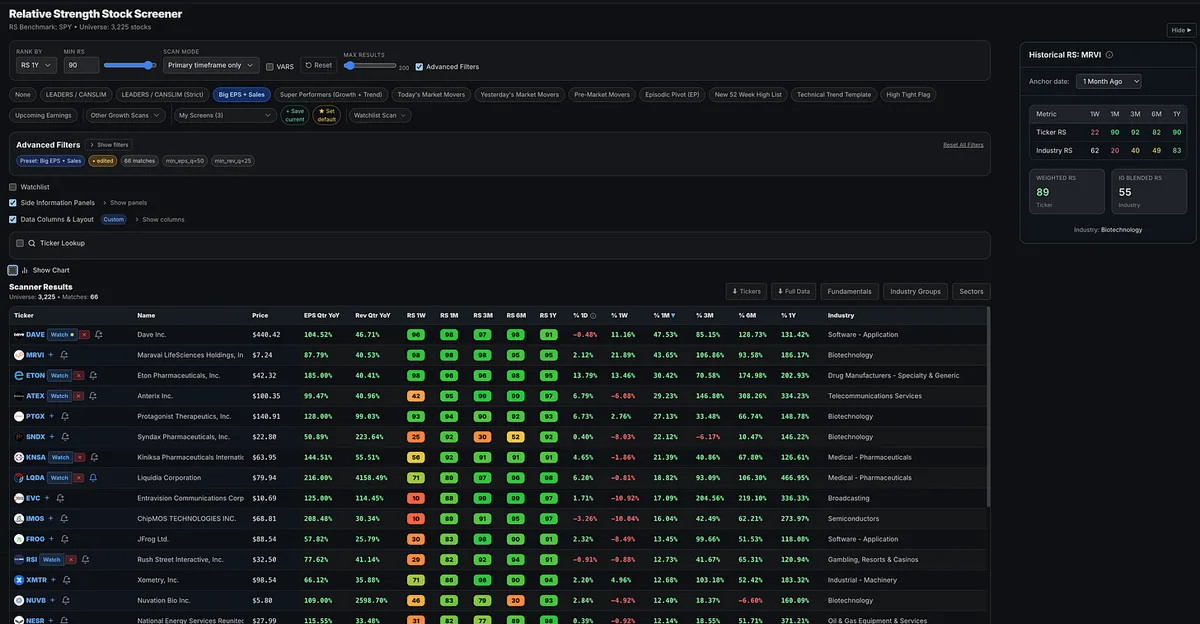
But sort the exact same screen by one-month relative strength, and the picture completely changes.

Now you see medical, biotechnology, pharmaceutical, oil and gas, and marine shipping names moving toward the top.

This shift was visible in the individual stock screens weeks ago.

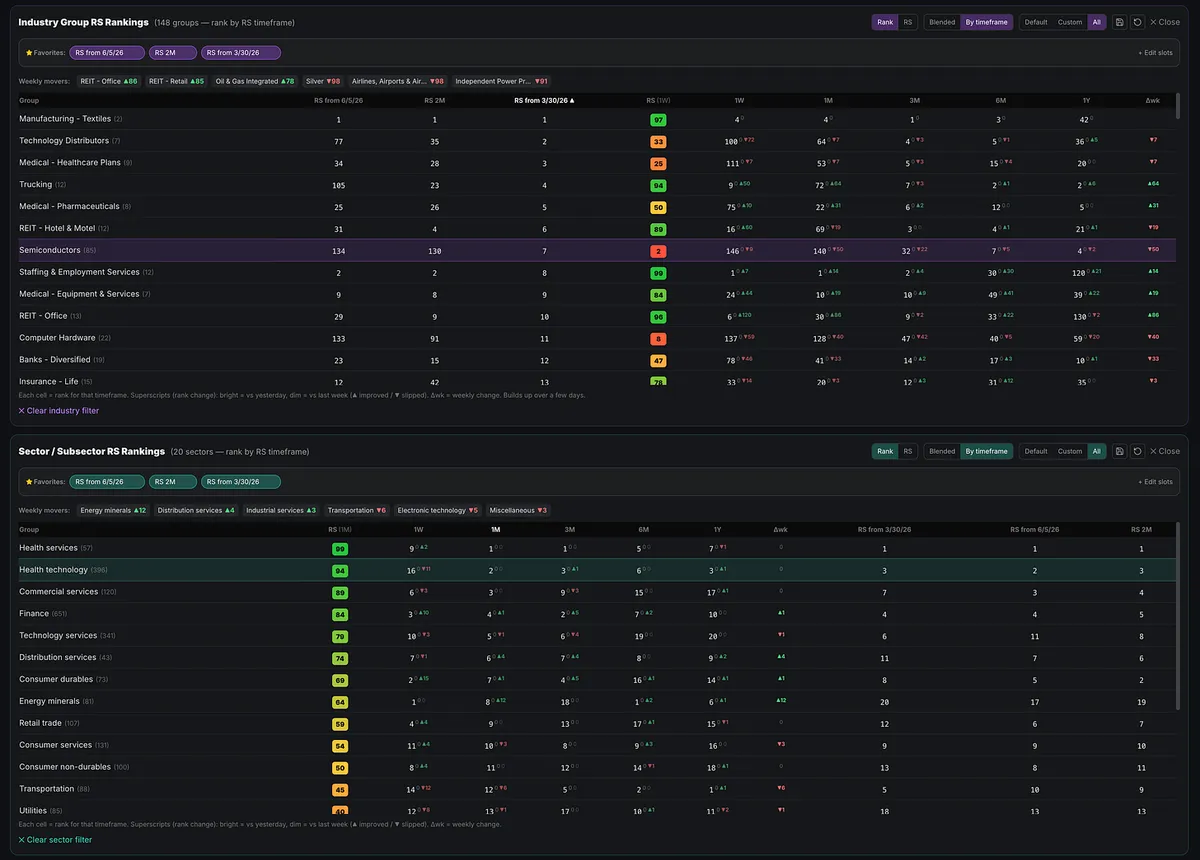
When the indexes, sectors, industry groups, and individual stock screens all begin telling the same story, you are no longer guessing whether leadership is changing.

You are watching it happen in real time.

View on Substack ↗

Leadership changes before most traders notice.

Run the Big Earnings and Big Sales screen, then compare one-year relative strength with one-month relative strength.

The shift is unmistakable.

Many of the stocks that dominated the last year still carry elite long-term RS ratings, but their short-term rankings have collapsed:

SNDK: 1yr RS = 99 / 1m RS = 2

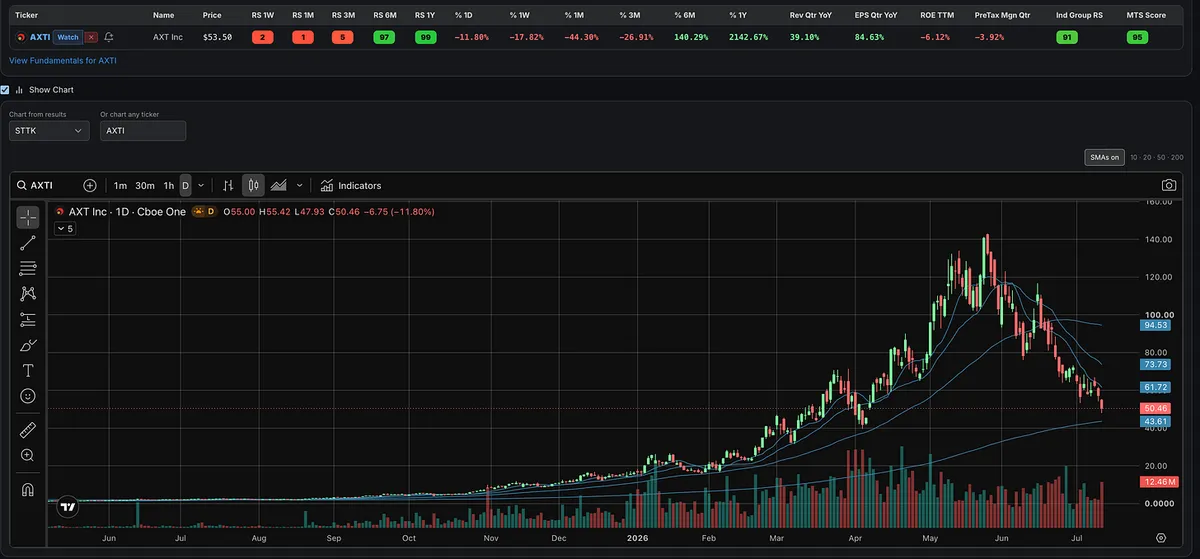
AXTI: 99 to 1

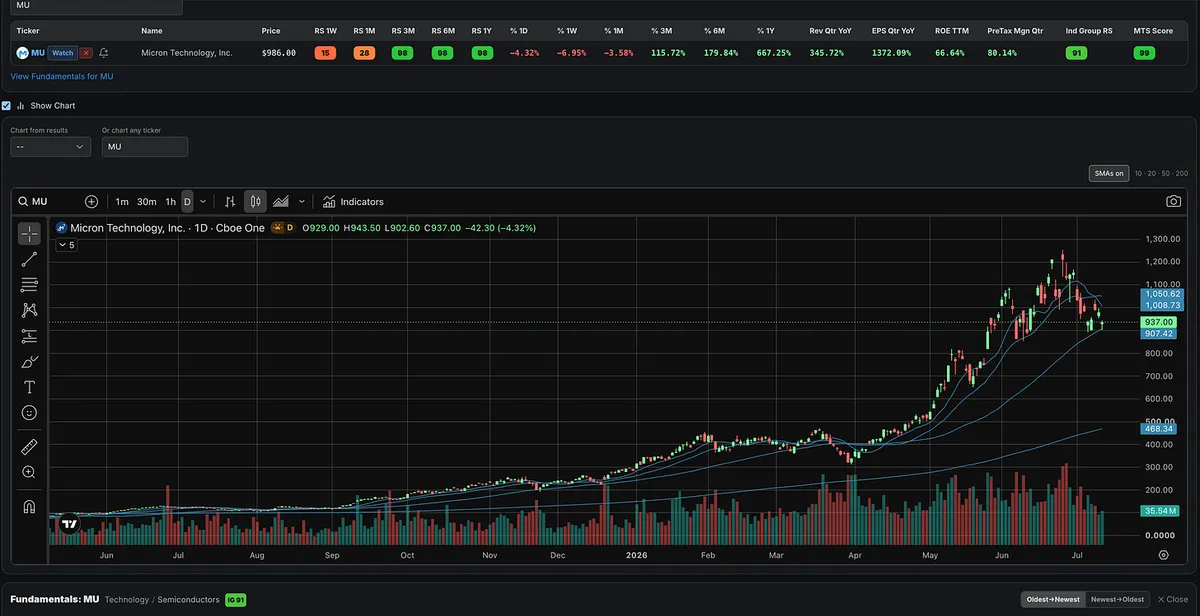
MU: 98 to 10

WDC: 98 to 3

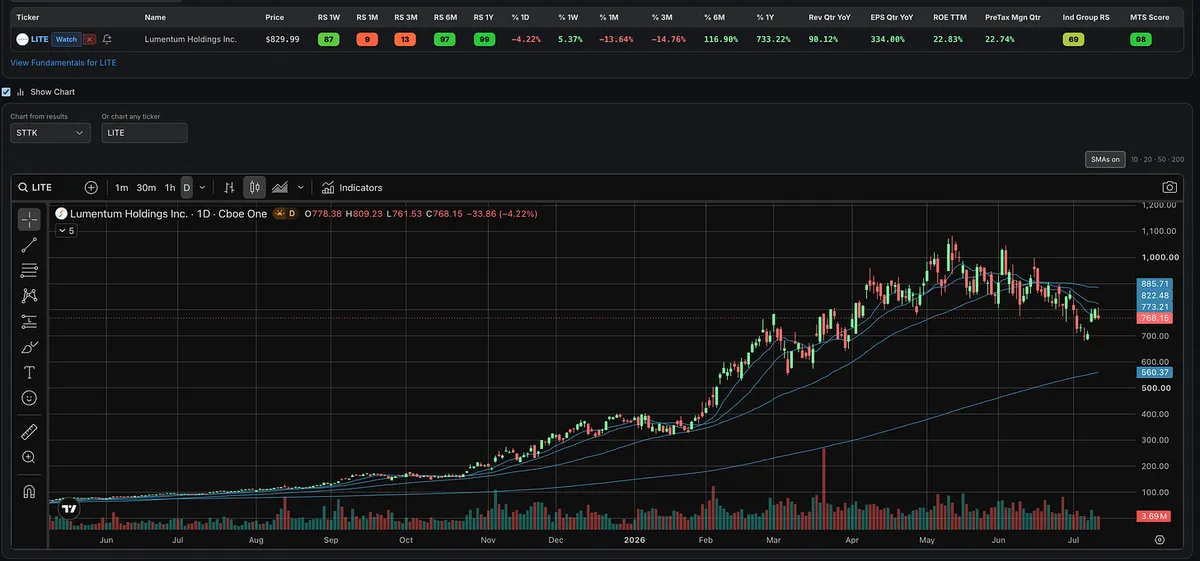
LITE: 98 to 10

CIEN: 97 to 12

At the same time, biotechnology, pharmaceuticals, software, and other emerging groups are moving toward the top of the screen.

That is what leadership rotation looks like in real time.

The market doesn’t send a memo. It leaves clues in relative strength, and industry-group rankings.

View on Substack ↗

What Leader Is Still Standing?

The market looks ugly, but the individual stock scans may look even worse.

Many of the leading stocks from the past year have suffered meaningful technical breakdowns. With SNDK now confirming its breakdown below the 50-day moving average, it joins MU, STX, WDC, and a growing list of former leaders that have lost important support.

Since the market set its low on March 30 and began a new Stage 2 uptrend, which leaders are actually still standing?

Post a chart of a leading stock in a leading industry group that has not suffered a meaningful technical breakdown. Let’s see which former leaders are still holding up, if there are any.

View on Substack ↗

Three New Research Panels Are Now Live

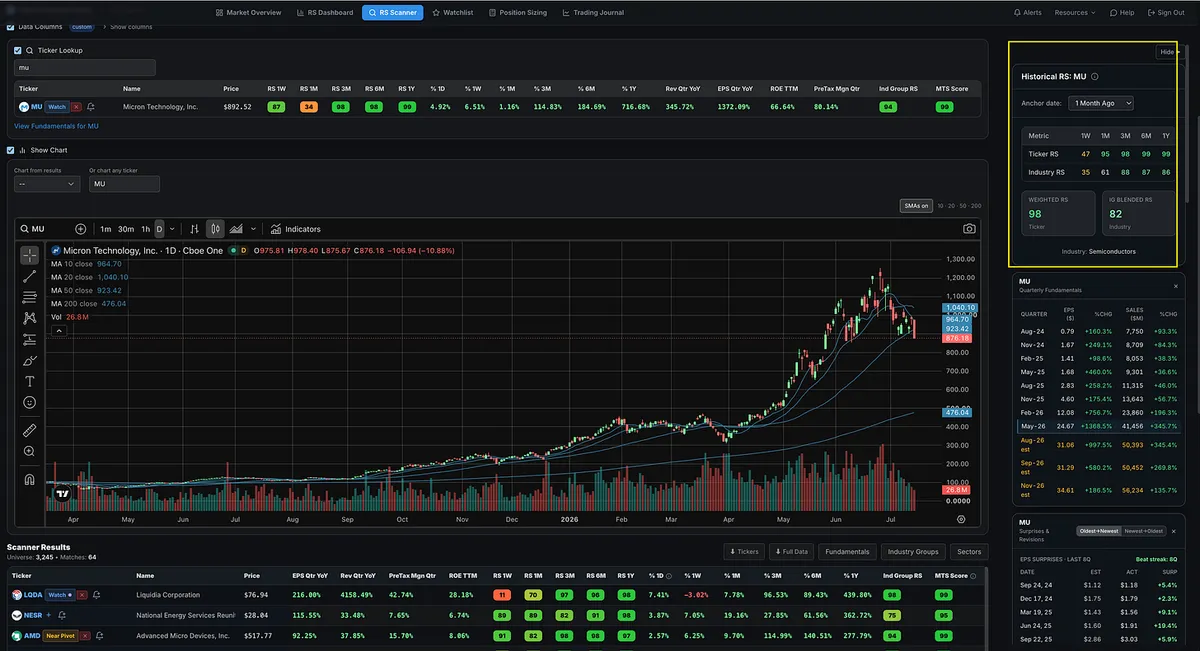
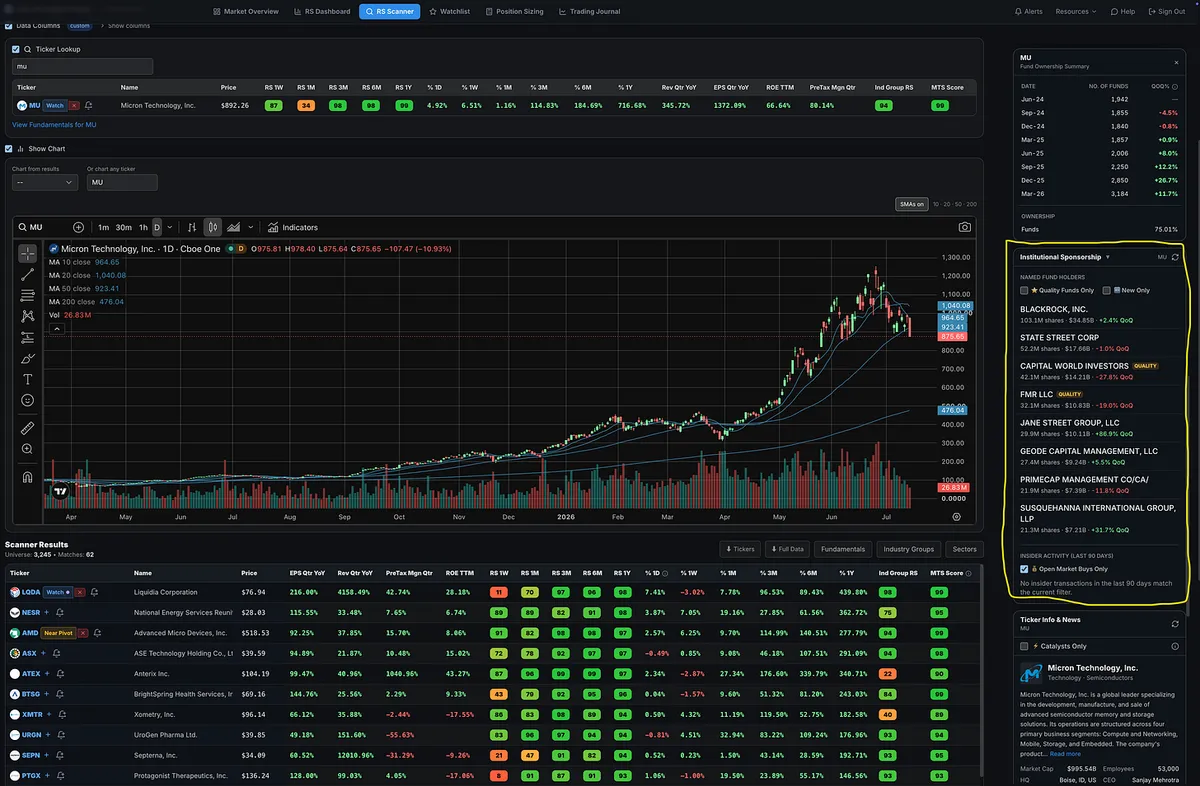
We added three new side panels to the Momentum Trading Strategy software this week: Historical RS, Institutional Sponsorship, and Surprises & Revisions.

Each panel is designed to provide an additional layer of research beyond the headline earnings, sales, relative strength, and fund ownership numbers you already see in the scanner.

Historical RS

The Relative Strength readings currently displayed in the software show a stock’s performance ending today.

For example, the one-month RS measures relative performance over the month ending today. The three-month RS measures the three months ending today, and the same applies to the one-week, six-month, and one-year readings.

The new Historical RS panel allows you to change the anchor date and see what those readings looked like at an earlier point in time.

For example, you can select one year ago and see what the stock’s one-month, three-month, six-month, and one-year RS readings were as of that date. You could also go back six months and see what the three-month RS looked like at that specific point.

The panel also displays the stock’s Weighted RS score, its Industry Group Blended RS score, and the company’s industry.

Institutional Sponsorship

We already displayed quarterly fund ownership, including the number of funds holding a stock and the quarter-over-quarter percentage change.

That allows you to see whether institutional ownership has been increasing or decreasing over several quarters.

The new Institutional Sponsorship panel takes the research one level deeper by showing the specific institutions involved in the stock.

O’Neil explained that it is not enough to know how many institutions own a company. Investors should also examine which institutions are involved, whether better-performing funds are participating, whether those funds have recently established positions, and whether the overall number of sponsors is increasing.

The panel gives you a clearer view of who is behind the ownership numbers and provides a starting point for evaluating the quality of that sponsorship.

A recognizable fund name does not automatically make the sponsorship high quality, but seeing the specific institutions involved gives you considerably more information than the fund count alone.

Surprises & Revisions

Strong quarterly earnings and sales growth remain the primary fundamental numbers we care about.

However, O’Neil also discussed the value of tracking earnings surprises and changes in analyst estimates as a secondary layer of research.

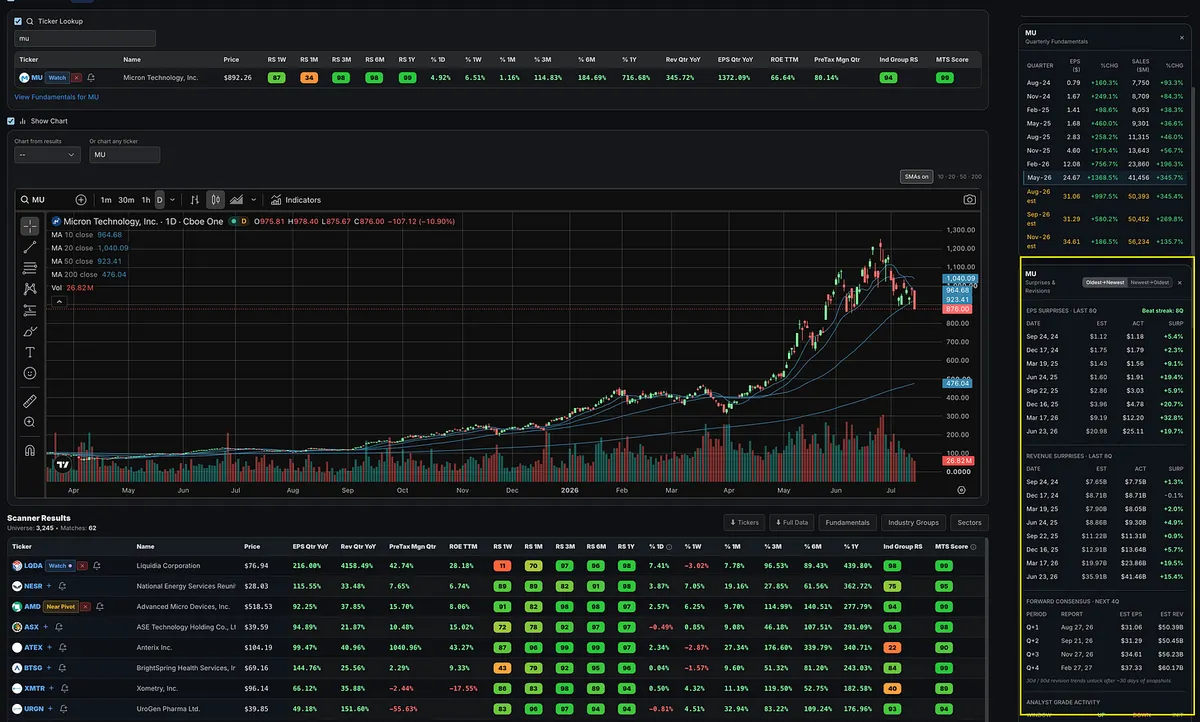
The new Surprises & Revisions panel displays earnings surprises, sales surprises, estimate revisions, and recent analyst upgrade and downgrade activity.

Some of the market’s strongest growth stocks can repeatedly report results well above expectations while analysts continue raising their future estimates. We saw this in names such as MU and SNDK during their strongest periods of earnings and sales growth.

That combination can help identify a company whose business is improving faster than the market originally expected.

Analyst upgrades and downgrades are also included because an unexpected change in opinion can sometimes act as a short-term news catalyst. However, these ratings should never be treated as standalone buy or sell signals. O’Neil repeatedly warned against blindly following analyst recommendations.

These panels do not replace the primary work of studying the chart, earnings and sales growth, price action, market direction, industry-group leadership, and the primary CAN SLIM criteria.

They simply give you more ways to dig beneath the surface and better understand the companies you are researching.

View on Substack ↗

Nothing Lasts Forever. Don’t Fall in Love With Any Stock.

Some of the market’s biggest winners over the past year have now broken down. At least for the moment, their runs appear to be over.

AXTI delivered enormous gains over the last year, but it has now fallen below its 50-day moving average and is heading toward the 200-day. Its 10-day and 20-day lines are declining, and the 50-day is beginning to roll over.

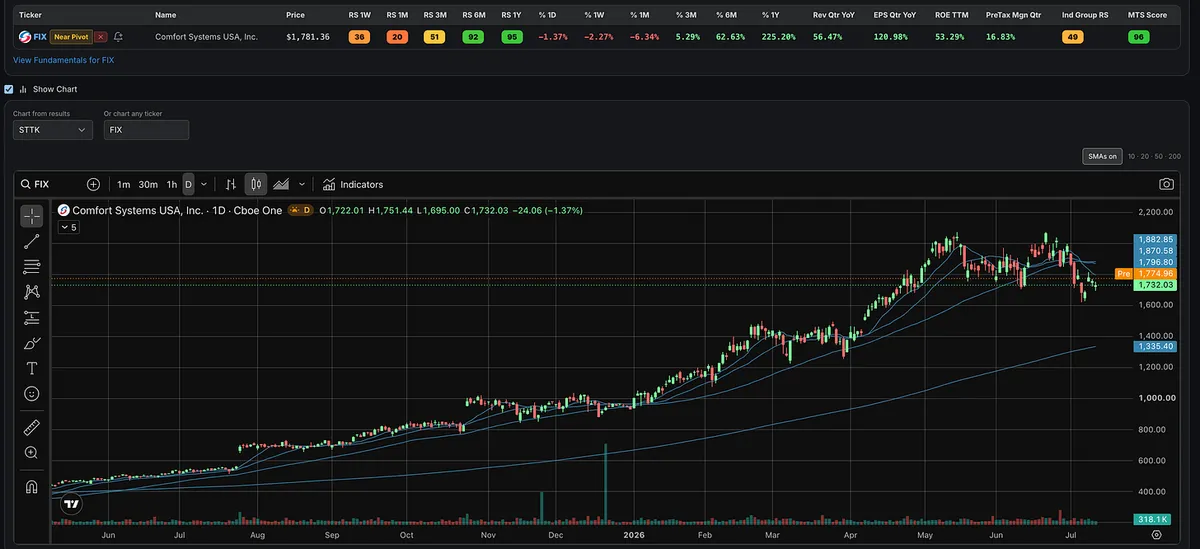
LITE, CIEN, VICR, AAOI, VIAV, TTMI, FIX, COHR, and several other former leaders have also broken down or suffered significant technical damage.

Many more are sitting in the danger zone near their 50-day moving averages. That includes the memory names SNDK, WDC, STX, and MU, along with other hot names from hot groups VPG, MBIS, MXL, LSCC, MRVL, TER, VSH, STM, ADI, INTC, TSM, LRCX, COHU, PDFS, and others.

The bottom line is that many of the stocks that have driven this market, particularly the memory, semiconductor, and telecom names, have either already broken down or are now testing a critical area around their 50-day lines.

I have not needed to share many new tickers from week to week because the same names I have discussed throughout the year continued to lead. There was no reason to constantly search for something new when the existing leaders were still working.

But nothing lasts forever.

Many of the stocks that worked all year are now either ending their runs or approaching a decisive point. Do not fall in love with any stock. Respect the price action and let the market tell you whether the trend is still intact.

View on Substack ↗

SNDK Loves the 50-Day

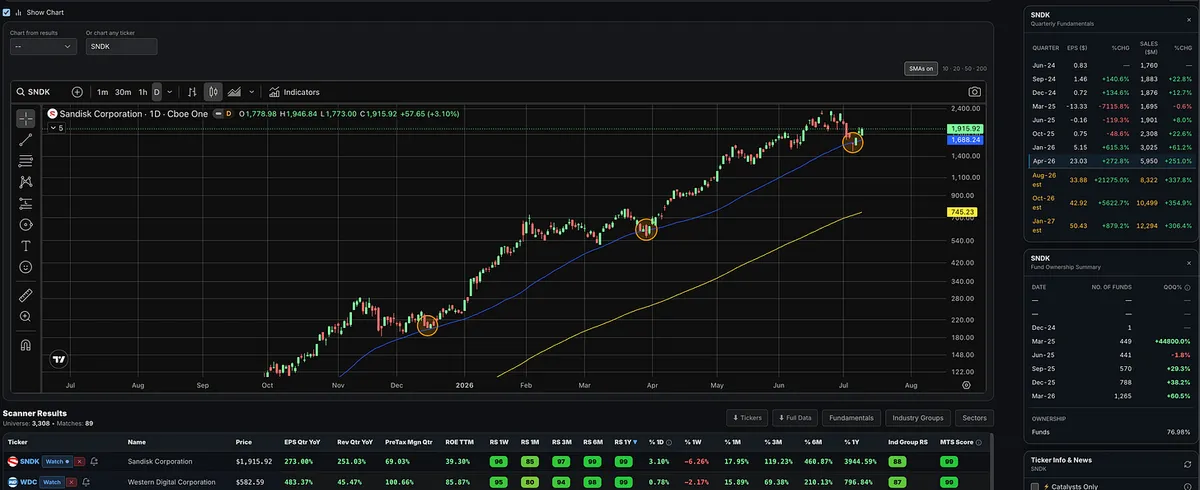
SNDK has repeatedly found support around the rising 50-day moving average throughout this massive run.

It happened in December 2025.

It happened again in late March as the market bottomed.

And now, SNDK has done it again, briefly undercutting the 50-day before reversing sharply and closing near the top of the day’s range.

We will see if the trend continues.

“The trend is your friend until the end when it bends.”

-Ed Seykota

View on Substack ↗

What Is Relative Strength and Why Is It So Important?

Many new traders, or people unfamiliar with relative strength, confuse it with RSI.

They are completely different.

RSI is an oscillator. It moves between 0 and 100 and is often used by traders to identify overbought or oversold conditions.

Relative strength, popularized by William O’Neil and Investor’s Business Daily, is completely different.

It is not asking:

“Is this stock overbought?”

It is asking:

“Is this stock outperforming the market and outperforming almost everything else?”

That is a much more important question.

William O’Neil said it best:

“I rarely pay attention to overbought/oversold indicators.”

And many Market Wizards have expressed a similar idea in one way or another.

The strongest growth stocks can stay “overbought” for long periods of time.

That is often what they do when they are under real accumulation.

They get strong.

They stay strong.

They keep making new highs.

And while everyone else is worried that the stock is “overbought,” the real leaders keep leading.

So that is why we do NOT care about RSI.

That is why relative strength is so valuable.

A true RS Rating is not just telling you whether a stock is moving up.

It is telling you how that stock is performing compared to a benchmark index, usually the S&P 500, and then how it ranks against all the other stocks in the market.

A 99 RS Rating means the stock is beating the market and outperforming almost everything else. It is in the top 1%.

A 90 RS Rating means it is in the top 10%.

A 50 RS Rating means it is roughly middle of the pack.

A low RS Rating means the stock is lagging badly.

Remember, as growth stock investors and momentum traders, we are:

Not looking for cheap.

Not looking for oversold.

We are looking for leadership.

The biggest winning stocks usually show strong relative strength before and during their major advances.

A stock can have an RS Rating of 80, 90, or 99 and still move hundreds or even thousands of percent. SNDK had a 99 RS Rating at the start of the year and moved another 300%.

They hold up better during market pullbacks.

They recover faster.

They push toward new highs while weaker stocks are still stuck below resistance.

RSI does not tell you that.

Relative strength does.

Inside the Momentum Trading Strategy Software, I break relative strength down across multiple timeframes, including 1 week, 1 month, 3 months, 6 months, and 1 year.

We also have functionality to set a minimum RS level across all timeframes, see what is accelerating and getting stronger, and see what is decelerating and losing strength.

That way, you are not stuck looking at one blended number.

You can see whether a stock is showing short-term strength, intermediate-term leadership, long-term leadership, or all three.

The goal is:

Find the strongest stocks in the strongest areas of the market.

Relative strength helps you do that.

View on Substack ↗

Stop Waiting for Someone to Hand You the Next Big Winner

If you are struggling to find the big winning stocks, you do not need to wait around for me or anyone else to tell you the names.

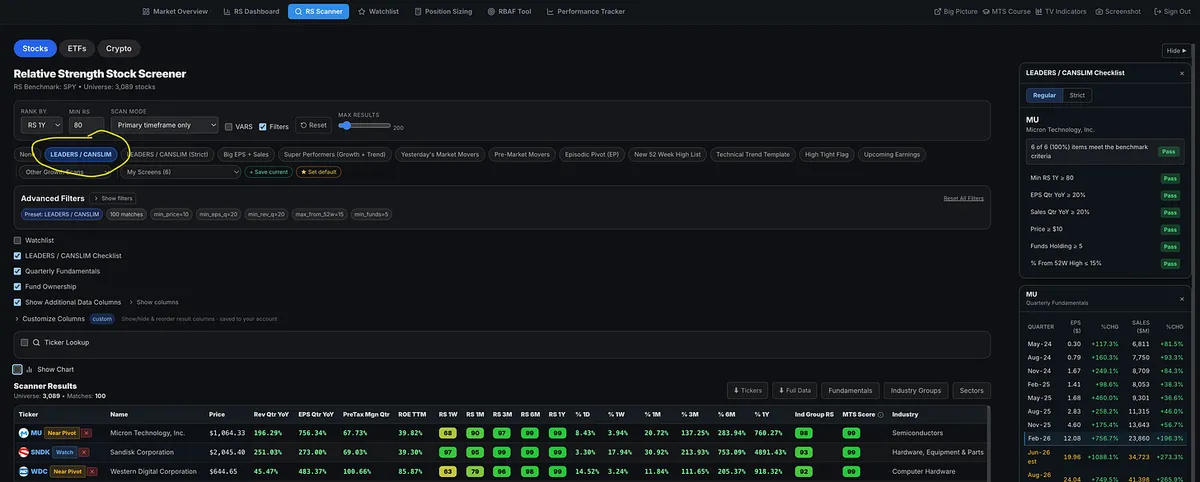
Open the Relative Strength Stock Screener and click the Leader / CANSLIM preset stock screen.

You will immediately see many of the market’s strongest names near the top of the list.

As you scroll through the list, some names will be extended. Those go on your watchlist so you can wait for the next proper pullback or setup.

Some will be near pivot points.

Some will already be actionable.

That is the entire point of the screener.

It is not there to overwhelm you with tickers. It is there to help you quickly identify where the real leadership is.

This is the same exact process I have used to find and share many of the biggest winners since January.

Names like:

SNDK

MU

AAOI

AXTI

DELL

CIEN

LITE

WDC

STX

SIMO

and many more!

Your job is to build the habit of checking the list, following the leaders, managing risk, and being ready when the setup appears.

Everything you need to learn the process is inside the Momentum Trading Strategy Course. I also provide a list of books that teach many of the same timeless principles.

Learn the process.

Use the tools.

Trust yourself.

You can do this.

View on Substack ↗

Everyone Wants the Next SNDK. That’s Why They Missed This One.

Most traders do not need more tickers. They need to learn how to recognize a real leader, manage risk, and stay with it until the evidence changes.

I shared SNDK back on January 22nd, and I’ve continued posting about it both publicly and inside the paid subscriber chat.

Yet I still get asked the same thing:

“What’s the next one?”

That is usually the sign of a beginning trader.

When you find a true market leader, the goal is not to immediately abandon it and go hunt for something else. The goal is to ride the move until the evidence changes.

That does not always mean you buy once and hold one full position forever.

  • You can trade around it.

  • You can sell some and hold some.

  • You can get stopped out and re-enter on a new setup.

  • You can even sell all of it and buy it back later when the stock gives you another proper entry.

But in a bull market, it is usually the same small group of names that drive most of the real performance.

Most people lose patience every time a leader pulls back, rests, or gets quiet.

Instead of waiting for the next proper entry in the strongest names, they start chasing random tickers that have not proven anything.

Meanwhile, the real leaders keep leading.

Look at SNDK.

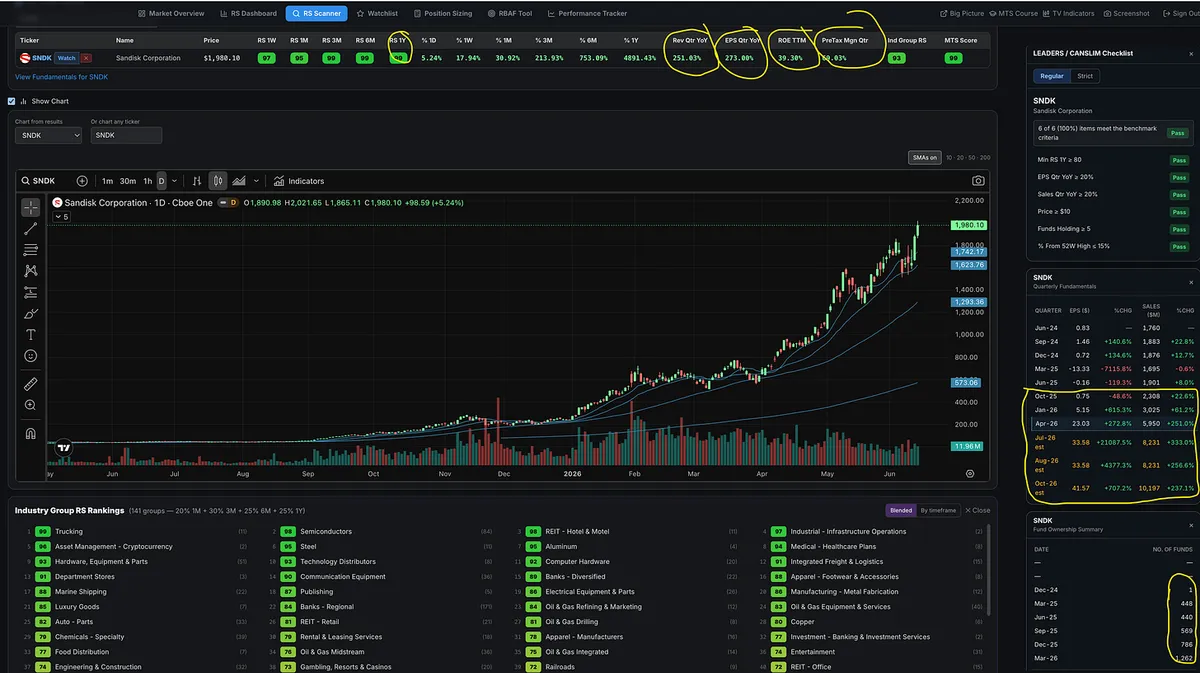
Price action has been screaming leadership. Relative strength across multiple timeframes is among the best in the market. The industry group is strong. Earnings are accelerating. Estimates are accelerating. Sales are accelerating too, which tells you this is not just a cost-cutting story.

There is real fuel behind the growth.

Funds are accumulating.

Return on equity is strong.

Pre-tax margins are strong.

The stock is tied directly into one of the biggest themes in the market: AI infrastructure and data demand.

So at some point you have to ask:

What else are you looking for?

This is CAN SLIM growth stock in real time.

And for the people who say they do not care about fundamentals, that is fine too.

It is not a coincidence that SNDK has also been showing up as a strong trend name for systematic trend followers.

Ed Seykota has had it listed on his Strong List.

One of the greatest systematic trend followers of all time is seeing the same thing CANSLIM growth stock traders are seeing.

Different methods.

Same conclusion.

Leadership.

When all of these things are lining up, the job is not to keep begging for new tickers.

The job is to recognize leadership, manage risk, and stay with the name until the evidence changes.

That is where the big money is usually made.

View on Substack ↗

SNDK Is Showing the Kind of Relative Strength Marty Schwartz Looked For

SNDK is doing something serious traders pay attention to.

It is making new highs while the broader market is not.

This is the type of relative strength Marty Schwartz looked for. Stocks that can push into new high ground when the market itself is not making new highs are often giving you an important clue.

This is just one of many golden nuggets Marty Schwartz shared in his book Pit Bull, and we wrote about several of them in this article:

https://substack.com/@tradingmomentum/p-201342828

ArticleHow Marty “Pit Bull” Schwartz Turned $40K Into $20M Without Big Drawdowns
View on Substack ↗

Why Do You Keep Missing the Biggest Winning Stocks?

Most traders spend their time looking for stock tips.

The best traders spend their time looking for stock characteristics.

Strong earnings. Strong sales. Strong relative strength. Strong industry groups. Strong price action.

The funny thing is many of the biggest winners were not hiding.

MU. LITE. SNDK. CIEN.

They were displaying many of the same characteristics long before their biggest moves.

The challenge isn’t finding the information.

The challenge is having a process that helps you recognize it.

I just published a new article walking through the exact screening process I use to find potential market leaders.

If you’ve ever wondered how traders consistently find big winners while everyone else seems to discover them months later, this article is for you.

https://tradingmomentum.substack.com/p/how-i-find-the-biggest-winning-stocks

ArticleHow I Find the Biggest Winning Stocks in the Market