Momentum Trading Strategy

Notes

Short lessons on momentum trading, every day.

Every note from Substack, in one place: risk, setups, leading stocks, market conditions and the mindset behind them. Search them, browse by topic, or filter by stock.

Showing 1–7 of 7 notes

$SMCI ×
View on Substack ↗

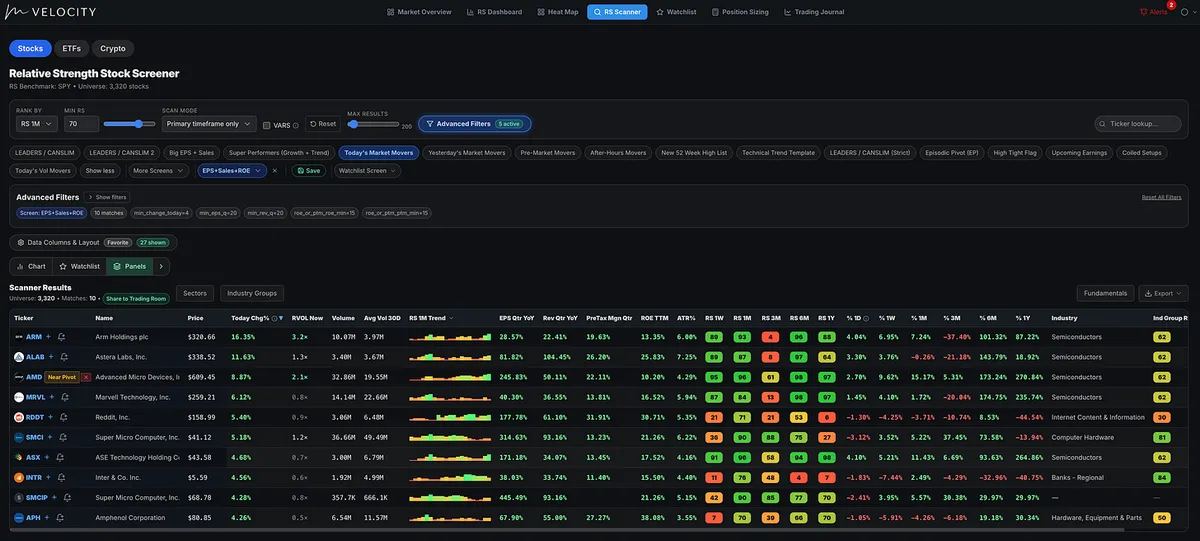
“Hey MTS Velocity, show me today’s market movers with the earnings, sales, and profitability to back up the move.”

Here’s the scan:

✅ Up at least 4% today

✅ 1-month RS rating of 70+

✅ Quarterly EPS growth of at least 20%

✅ Quarterly sales growth of at least 20%

✅ ROE or pre-tax margins of at least 15%

My starting universe: 3,320 NYSE and Nasdaq stocks, already filtered for minimum price, average trading volume, and market cap.

Just 10 matches.

$ARM · $ALAB · $AMD · $MRVL · $RDDT · $SMCI · $ASX · $INTR · $SMCIP · $APH

Leading the list when I ran the scan: ARM +16.35%, ALAB +11.63%, and AMD +8.87%.

View on Substack ↗

The Best Stocks Often Show Their Strength Before the Market Does

One of the things I love about studying the old masters is how often the same ideas show up decades apart.

Nicholas Darvas wrote about sitting on the sidelines during the 1957 market decline and watching for stocks that refused to go down with everything else.

“I tried to detect those stocks that resisted the decline. I reasoned that if they could swim against the stream, they were the ones that would advance most rapidly when the current changed.”

That is relative strength in its purest form.

Darvas noticed that while most stocks were falling with the general market, a small group began giving ground reluctantly. He later found that many of those companies also had sharply improving earnings trends. His conclusion was that capital was already flowing into them even while the broader market was weak.

That is exactly why I spend so much time looking for stocks holding up near their highs during corrections.

This is exactly what I did with SMCI back in 2022.

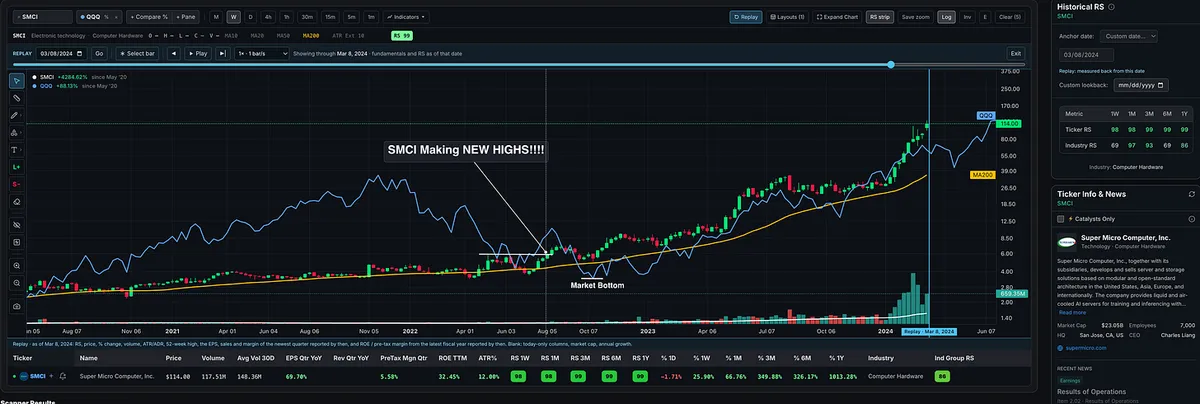
While the broader market was still in much worse shape, SMCI was already showing unusual strength. It was holding up far better than the indexes, its relative strength was improving, and as the market began to bottom and turn higher, SMCI was already pushing into new highs.

That strength was information.

The stock that refuses to break while everything around it is getting hit is telling you something.

Then, when the market finally turns, you often don’t have to go searching for leadership from scratch.

The leaders may have already identified themselves.

Darvas later described Lorillard doing exactly this. While most stocks were drifting or falling, Lorillard rose from 17 into a tight 24–27 area with a huge increase in volume. He called its strength in the face of a weak market “very impressive,” then bought as it pushed toward a higher range.

Different decade. Different stocks. Same behavior.

When the market gets weak, don’t only look at what is falling. Pay close attention to what refuses to fall.

Those stocks may be showing you where the next leadership is forming.

View on Substack ↗

Every Market Cycle Has a “Big Stock.” But the Real Clue Is Usually the Industry Group Behind It.

The market’s biggest winners rarely emerge alone. They are usually part of an industry group benefiting from a powerful new fundamental trend.

2023: AI Compute and Semiconductors

This marked the beginning of a new bull market and the emergence of the generative AI theme.

Big leaders:

  • $NVDA | Nvidia

  • $SMCI | Super Micro Computer

NVDA became the face of the cycle, but the leadership was much broader. Chips, servers, networking equipment, and the entire data-center buildout were beginning to move.

2024: AI Software, Data Platforms, and Power

Leadership expanded from companies building the AI infrastructure to those finding ways to monetize and support it.

Big leaders:

  • $PLTR | Palantir

  • $APP | AppLovin

AI adoption spread into software, data platforms, advertising optimization, networking, and power generation. The theme was evolving, but the underlying driver remained the same.

2025: Memory, Storage, and the AI Data Stack

The market’s attention shifted toward the next major bottleneck. AI systems required enormous amounts of high-performance memory, flash storage, and data-center capacity.

Big leaders:

  • $SNDK | SanDisk

  • $WDC | Western Digital

  • $STX | Seagate Technology

  • $MU | Micron Technology

These became some of the market’s biggest winners as demand for AI memory and storage accelerated.

2026: The Memory Supercycle Continues

Leadership continued into 2026 and semiconductors remerged as a leading group rather than transitioning into an entirely new theme.

Leaders:

  • $SNDK | SanDisk

  • $MU | Micron Technology

  • $STX | Seagate Technology

  • $WDC | Western Digital

But don’t overlook what happened outside the dominant AI theme.

Metals and mining also developed into a major winning group during this bull market period 2024-2026. The market can have one dominant secular story while still producing powerful leadership in completely different areas.

The next monster winner probably won’t be random.

It will likely emerge from a strengthening industry group with accelerating earnings and sales, increasing institutional sponsorship, elite Relative Strength, and a chart that refuses to break.

2023: AI compute and semiconductors

2024: AI software, data platforms, and power

2025–2026: AI memory, storage, semis

Meanwhile, metals and mining proved that major leadership can still emerge outside the market’s primary theme.

What industry group do you think becomes the next true market leader for 2026–2027?

View on Substack ↗

Why New Highs During Corrections Reveal the Next Leaders

Most traders avoid looking at stocks making new highs during a correction.

That is a mistake.

Because while the market is weak, a small group of stocks starts to act differently.

They hold up. They resist selling. They begin to outperform.

That is where new leaders come from.

Take SMCI as an example.

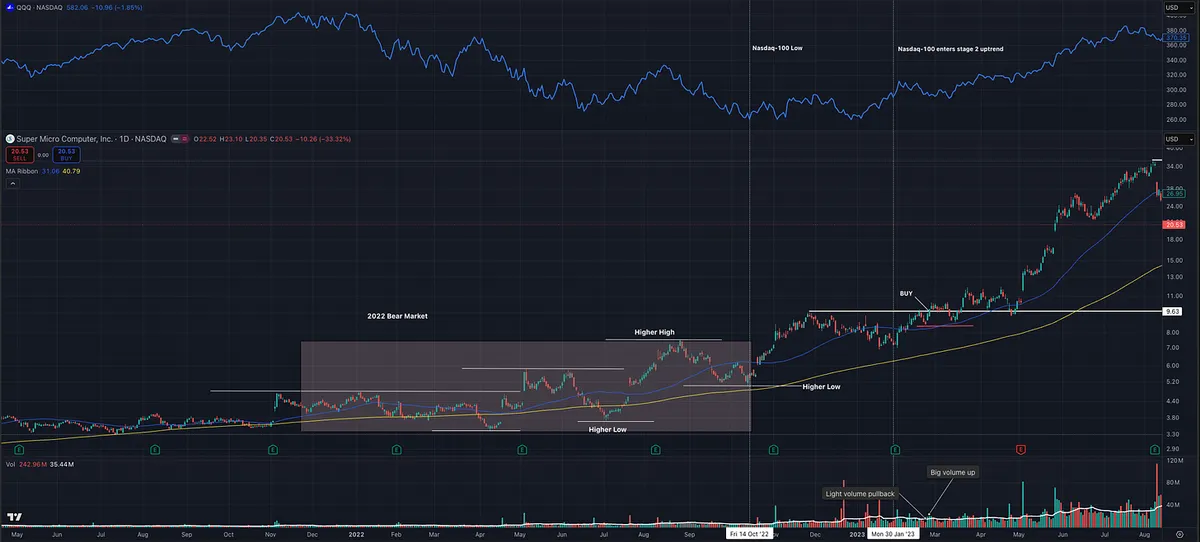
In 2022, while the Nasdaq-100 was still declining, SMCI was already making higher highs and higher lows.

That is not normal.

In most corrections, if the index drops 10%, leading growth stocks can drop 20 to 30%.

In 2022, the Nasdaq fell 37% and the S&P 500 dropped 27%.

SMCI only declined about 28% and was already pushing toward new highs by May.

That is your first signal.

Strength during weakness.

That is how you spot potential leaders early.

Then comes the next phase.

The market bottoms and begins to recover.

Indexes reclaim key levels and start making higher highs and higher lows.

Now you have alignment.

The market and the stock are moving in the same direction.

Then you go one level deeper.

The sector.

A new theme emerges. In this case, AI.

Groups like computer hardware begin to lead.

And SMCI is right at the center of that move.

Now you have group strength.

Finally, you look at the stock itself.

Tight price action. Higher highs and higher lows. Above key moving averages.

Volume dries up on pullbacks and expands on advances.

That is institutional accumulation.

Add in strong earnings and sales growth, and everything lines up.

This is how big winners are built.

SMCI moved over 250% in about six months.

Not because it was random.

Because the clues were there early.

Strength first. Then alignment.

That is how you find the next leader before everyone else.

View on Substack ↗

Why You Can’t Find VCPs Right Now (And Why That’s Not a Problem)

Received a great question today about VCPs that I think a lot of traders are struggling with right now.

They mentioned how hard it has been to actually find clean VCP setups, even after studying charts and screening for them.

This is a great question, and honestly what you’re experiencing is completely normal.

The first thing to understand is that most VCPs are not going to look like the textbook examples. The clean, perfectly staged contractions that many show are the exception, not the rule.

Minervini is not teaching you to find a perfect pattern. He is teaching you to recognize behavior.

What you are really looking for is:

  • volatility contraction over time

  • tighter price action

  • controlled pullbacks instead of sharp selloffs

  • volume drying up into the pivot

  • price tightening up the right side of the chart

Those things can show up in many different ways, and often they are subtle.

The second part of this is the environment.

Right now, it is harder to find clean setups. That is not a coincidence.

The best looking VCPs tend to show up earlier in a bull cycle when institutions are aggressively building positions and leadership is expanding. As the market matures, stocks become more extended, price action gets looser, and breakouts become less reliable.

So when you are scanning and thinking “these don’t look like the examples,” that is actually information.

It is telling you that either:

  • the setup is not truly there

  • or the environment is not ideal for it

A good way to think about it is this:

You are not trying to find a perfect VCP. You are trying to identify when supply is being absorbed before a potential expansion move.

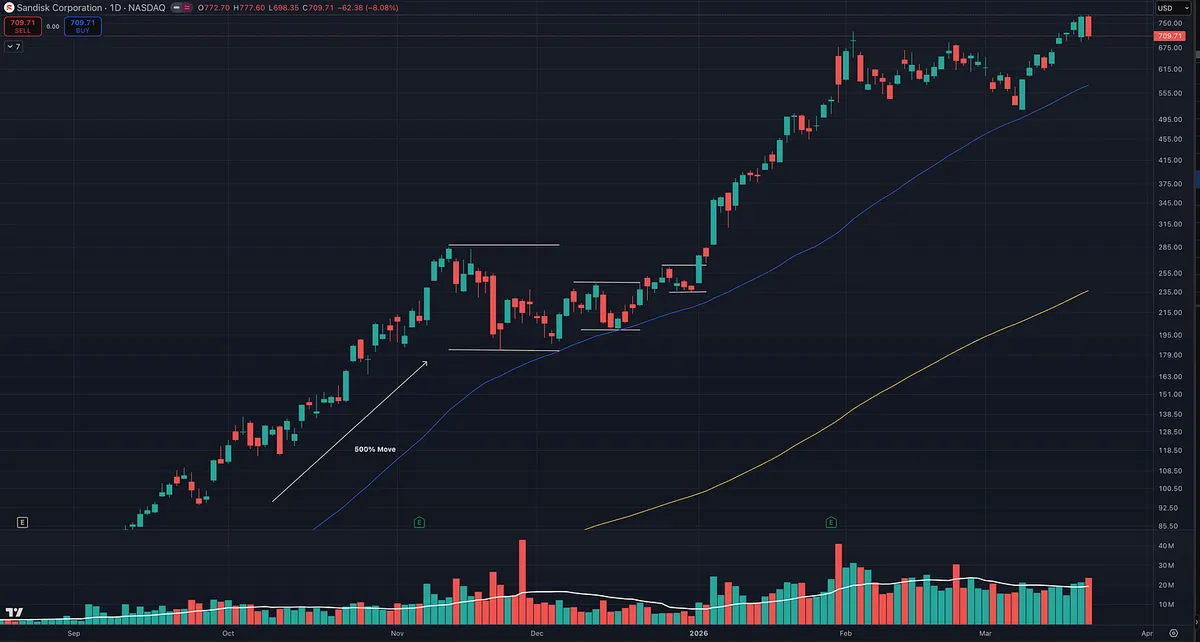
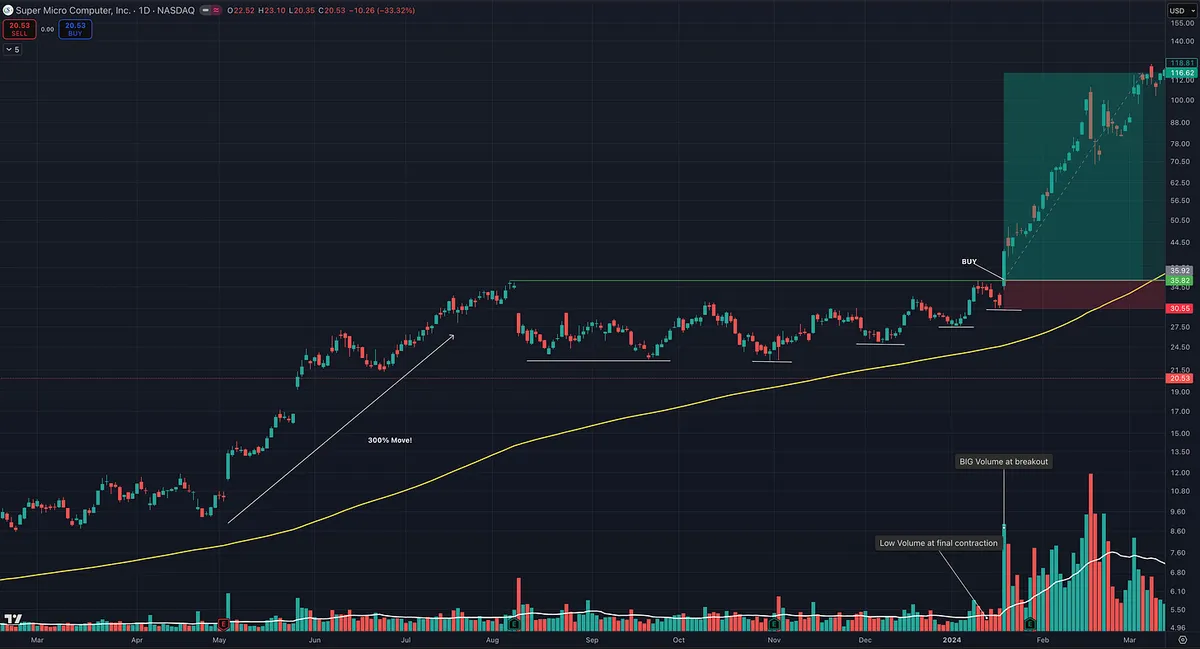
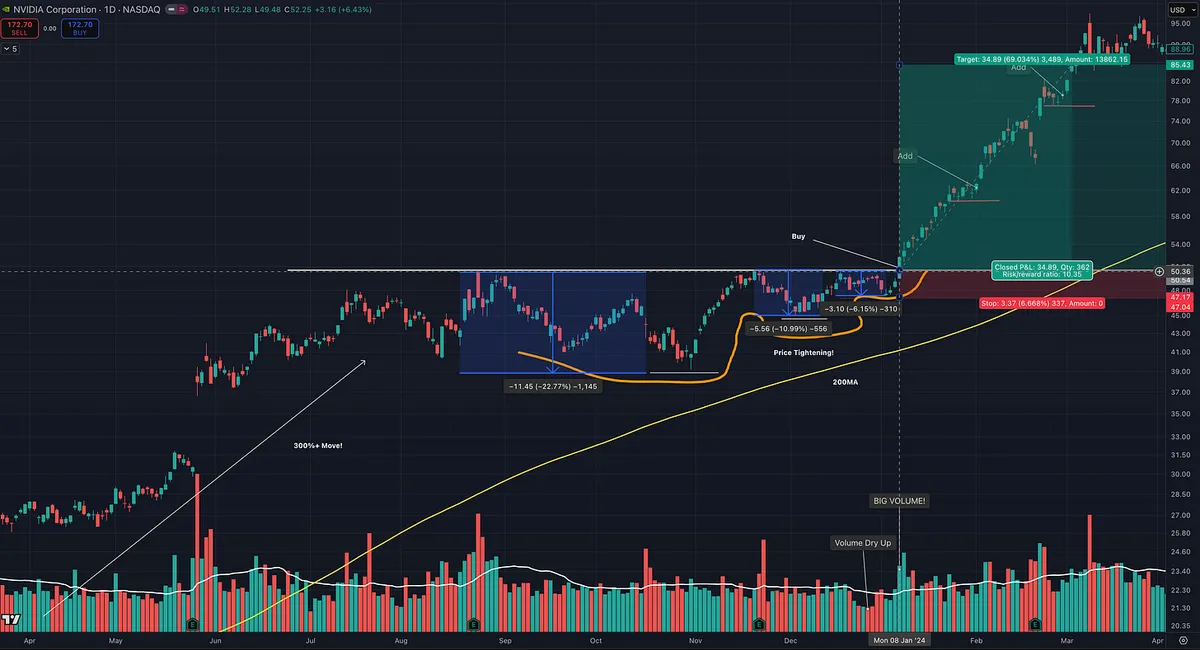
Sometimes that will look very clean like NVDA earlier in 2024 or slightly less perfect like SMCI. Other times it will look much messier, like SNDK in 2025, and require more experience to recognize.

If you are struggling to find them right now, that might not be a skill issue. It is very likely a reflection of the current market conditions.

Over time, you will get better at spotting these. It comes from screen time and reviewing charts over and over. What looks unclear now will start to stand out much more with experience.

Also, you do not need to master every setup to be successful. Some traders naturally see certain patterns better than others.

For example, you might find that:

  • cup with handle setups stand out more to you

  • or flat base breakouts are easier to recognize

That is completely fine.

The goal is not to trade every setup. The goal is to find the ones you can consistently recognize and execute well, and focus on those.

View on Substack ↗

The Leaders Bottom First

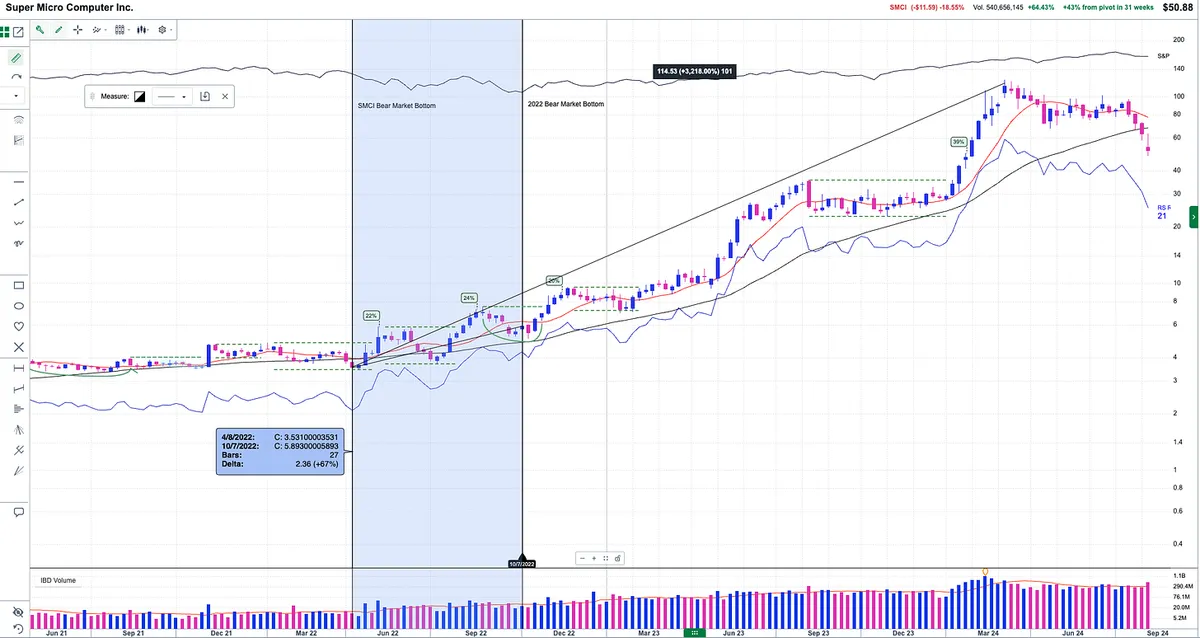
While the market was still falling in 2022, the biggest winner of the next cycle had already turned.

This is exactly what Mark Minervini talks about in Think & Trade Like a Champion. True leaders often bottom before the indexes and start building higher lows while everyone else is focused on the bear market.

Look at SMCI.

• April 2022 — SMCI bottoms

• October 2022 — S&P 500 finally bottoms

During that same period, SMCI had already rallied about 70%.

While the market was still weak, the stock began doing what leaders do:

• Forming higher highs and higher lows

• Holding key moving averages

• Building an ascending base

• Showing a rising relative strength line

By summer 2022, SMCI was already acting like a Stage 2 leader.

The market had not even bottomed yet.

From that early leadership signal to the peak in March 2024, SMCI went on to run over 3,200%.

The lesson is simple.

The next super performer can show itself while the market is still struggling. Pay attention to this. O’Neil highlighted the importance of this too!

Even if you waited until the market showed a clear character change in early 2023 with a confirmed higher low, higher high, and price back above the 200 day moving average, you still could have captured roughly 1,200% of the move from there.

Because the best stocks can tell you where the next bull market is going before the headlines do.

View on Substack ↗

Financing Your Risk: A Minervini and Soros Method

How I use the low cheat setup, partials, and breakeven stops to trade with house money

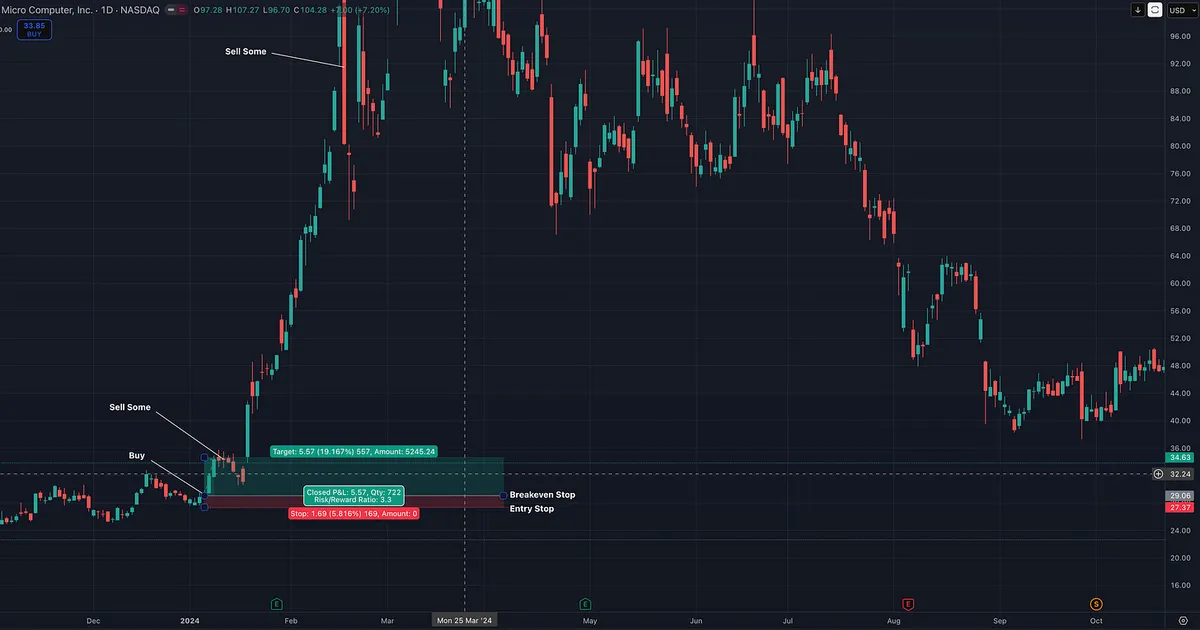
This SMCI chart from 2024 is a perfect example of what I mean when I say I like to finance my risk.

I bought using a classic Minervini low cheat entry. That means I was not waiting for a flat-base breakout at new highs. I entered lower in the base as price turned back up, forming a higher low and then a higher high. It is a tactical way to enter earlier when you see constructive higher-high and higher-low structure developing.

Once the trade began working and I hit roughly three times my initial risk, I sold a portion into strength. This locked in profit and reduced my emotional burden. When price pulled back, formed another higher low, and then pushed to a fresh high, that is when I moved my stop to breakeven. At that point the remaining position was operating on house money.

This idea lines up perfectly with something George Soros said in his 60 Minutes interview: “It’s very different when you’re risking your principal than when you’re risking your profits.”

That is the entire logic behind financing your risk. Lock in gains early when structure allows, remove exposure, and let the rest of the trade run without emotional drag.

Minervini gave me the entry tactics. Soros gave me the psychology. Together they create a simple edge: Protect the downside, pay for the trade early, and let the market decide how big the winner becomes.