
Trading articles/How to Buy Pullbacks in Leading Stocks Without Catching a Falling Knife
Jul 17, 2026 · Momentum Trading Strategy
How to Buy Pullbacks in Leading Stocks Without Catching a Falling Knife
A practical guide to identifying support, recognizing upside reversals, waiting for confirmation, placing logical stops, and building positions as the stock proves itself.
Originally published on Substack.
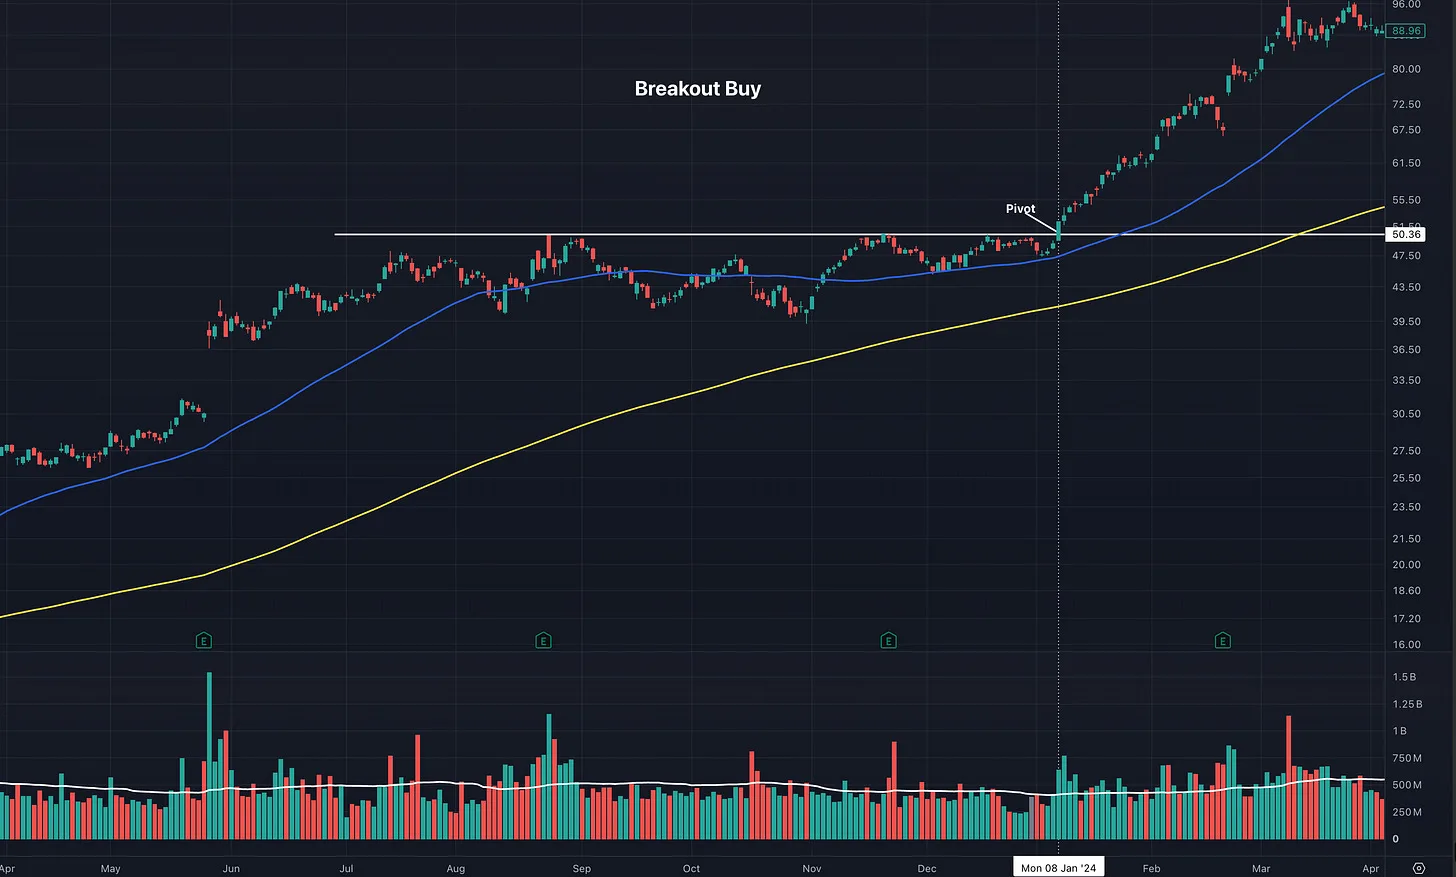
As growth investors and momentum traders, we are taught to buy strength, and one of the best ways to do that is by buying breakouts into new high ground. The pivot point is the price level a stock must clear to move above resistance, and ideally we want to see volume expand as the breakout occurs. Sometimes that volume arrives immediately, while in other cases it appears over the following sessions and confirms the move. Either way, the breakout matters because it demonstrates demand and removes much of the overhead supply that had previously held the stock back.
These breakouts can emerge from traditional base patterns such as a flat base, cup with handle, or volatility contraction pattern, commonly known as a VCP. They can also develop later in a stock’s advance, after the original breakout has already occurred and price begins consolidating sideways or pulling back in a controlled manner. When the stock eventually pushes through the top of that range and returns to new highs, the entry can be treated much like a breakout from a longer base. The underlying principle is the same: price is clearing resistance and showing that buyers are willing to pay up.
A trader can build an entire career by buying breakouts to new highs. However, no strategy works equally well in every market environment, and there will be periods when other entry techniques are rewarded more consistently. Breakouts may still be working, but you may want another way to add to an existing position. You may also have missed the original breakout and want a way to get involved without chasing the stock at another new high.
In some cases, a stock’s history shows that it tends to chop and grind around its highs, making breakout entries more difficult to manage. The stop may be wider than you prefer, the setup may not provide a clean risk level, or you may want to build a larger position without increasing the total dollars at risk. There are many reasons to use pullback buys, and they can offer a lower cost basis, clearer risk management, and greater flexibility in how you build a position.
This is where pullback buys and upside reversals become useful. Some traders build their entire careers around buying pullbacks, just as others focus almost exclusively on breakouts. I prefer to use both and think of pullback buying as another tool in the toolbox. It does not change the growth characteristics, fundamental strength, or technical qualities I screen for, but it gives me more flexibility in how I enter a position and allows me to adapt to the tactics the market is currently rewarding.
Neither approach is inherently better than the other. Both have advantages and disadvantages, and the market ultimately determines which one is working best at any given time. The market has a vote, the industry group has a vote, and the individual stock has a vote. The real questions are: What is being rewarded right now, and how can I enter a potential market leader with a low-risk, high-reward setup?
Buying pullbacks and upside reversals does not mean buying a stock simply because it has declined. It is not averaging down into a broken position, and it is not blindly buying every dip. A pullback is only worth considering when the larger trend remains healthy, the support level is identifiable, and the trader knows exactly what price action would prove the setup wrong.
In this article, we will take a deeper look at pullback buys and upside reversals, including how they differ, where they tend to develop, what makes one setup stronger than another, and how to define risk when entering the trade.
Breakout entry versus pullback entry.
The Conditions That Must Be Present
Pullback buying works best when both the general market and the individual stock are in clear uptrends. A strong market is more forgiving. Leading stocks are more likely to respect their moving averages, recover from shakeouts, and resume their advances. When the market is rolling over, support levels that would normally attract buyers can fail without warning.
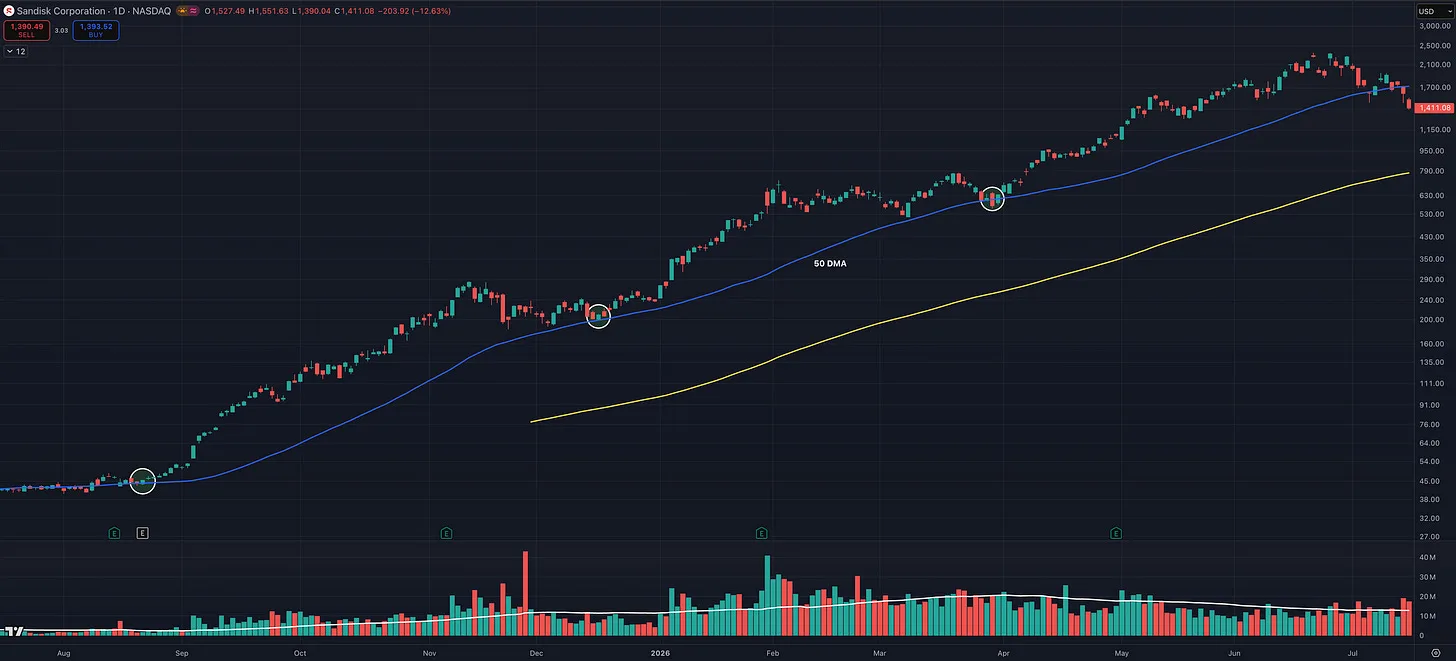
The stock itself should also be acting like a leader. A practical definition of an uptrend is a pattern of higher highs and higher lows supported by a rising 50-day moving average. If the stock is making lower highs, breaking prior lows, and trading beneath a declining 50-day line, the setup is not a tradable pullback within this framework.
We are not buying a stock simply because it has pulled back. It should still meet the same criteria we use when buying breakouts. The stock should be in a clear Stage 2 uptrend and display the characteristics commonly found in the market’s biggest winners, including strong earnings and sales growth, high ROE and/or strong margins, leadership within a strong industry group, and alignment with the broader bull market theme.
Technically, the major moving averages should be rising and properly aligned. Ideally, the 20-day moving average is above the 50-day, and the 50-day is above the 200-day. We also want to see strong volume as the stock advances, followed by lighter or declining volume as it pulls back or consolidates. The setup may involve buying weakness, but only within the context of unmistakable strength.
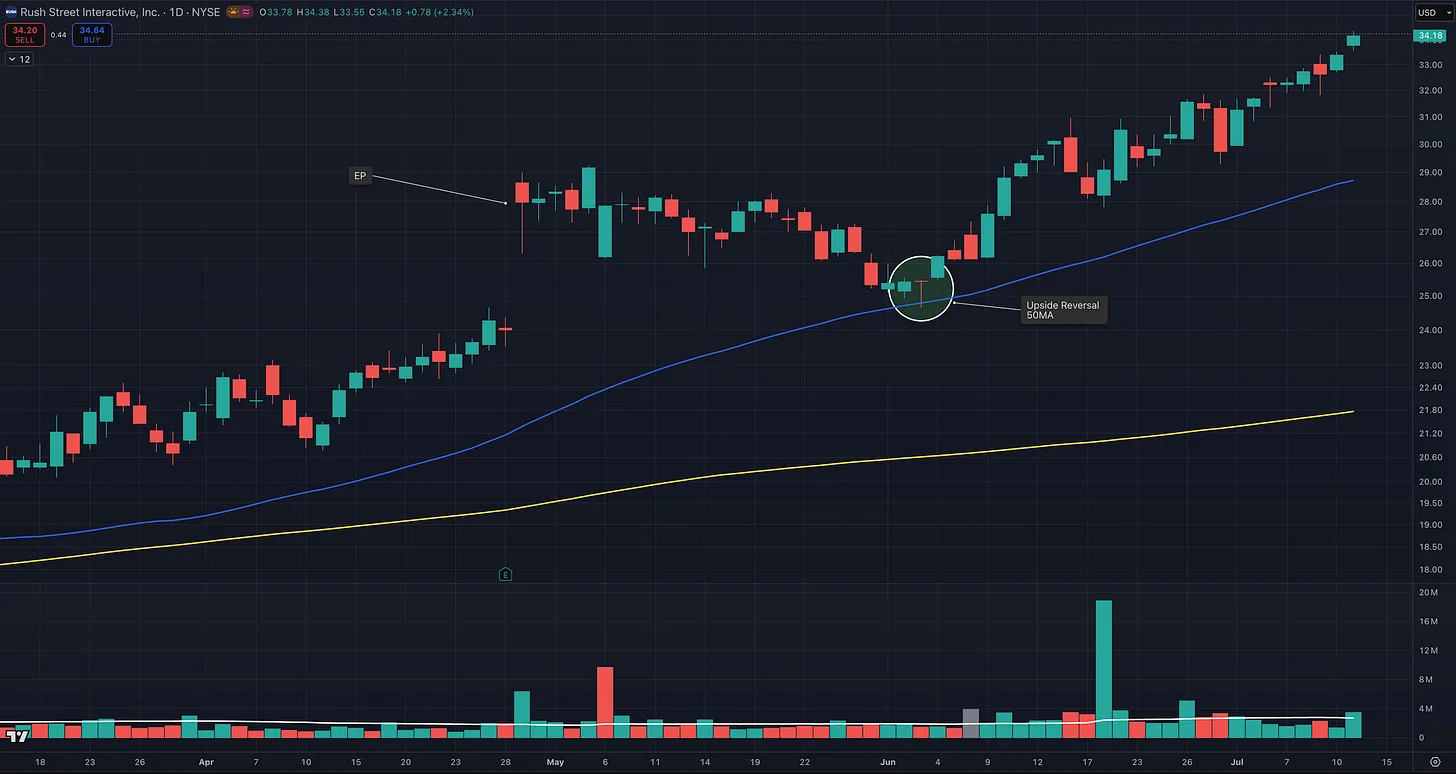
Healthy pullback and trend.
Why Strong Stocks Pull Back
Great stocks do not move in straight lines. They advance, pause, correct, and then attempt to move higher again. Those periods of weakness are not automatically evidence that the larger move is over.
Pullbacks occur for several reasons. Early buyers take profits, short-term momentum traders exit, the broader market pauses, or institutions allow the stock to retreat toward a price where they are willing to accumulate more shares. The result is a temporary imbalance in which supply overwhelms demand.
Institutions cannot build meaningful positions in a single afternoon. Their buying often takes place over weeks or months, which means they may use normal corrections to add shares. From the outside, the stock appears weak. In reality, ownership may simply be transferring from impatient holders to investors with a longer time horizon.
The best pullbacks often feel uncomfortable because they create enough fear to force weaker holders out of the stock. An orderly decline on lighter volume is easier to buy, but a sharp shakeout can be equally effective if it reaches meaningful support and recovers quickly.
The depth of the decline must be considered in relation to the stock’s normal volatility. A 9 percent intraday move may be extreme for a slow stock but close to one average true range for a volatile growth leader. Percentages should therefore be interpreted in context rather than treated as universal rules.
The Main Support Levels
Once a stock is in an established uptrend, several levels can provide support. The most useful are the 10-day moving average, the 20-day moving average, the 50-day moving average, and the top of a prior base or consolidation.
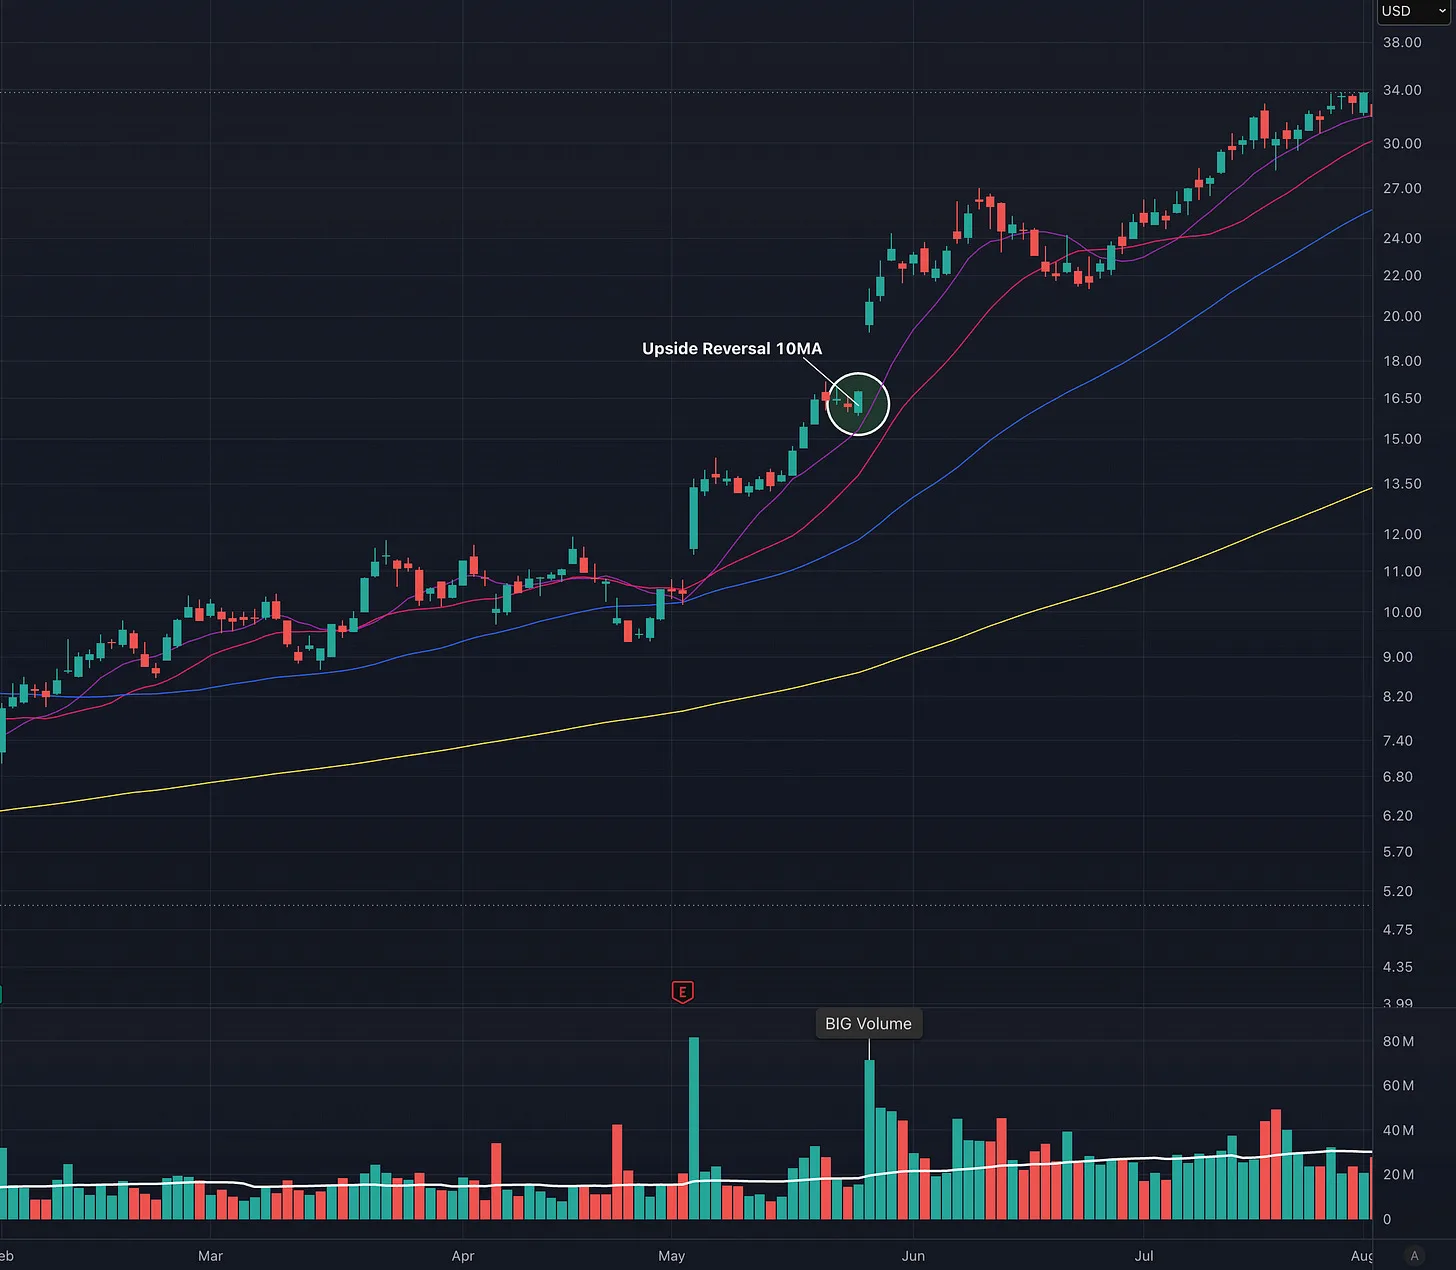
The 10-day moving average is usually close to the stock’s price. It is often more useful as a holding guide than as a major pullback entry. The strongest leaders can ride the 10-day line for weeks, repeatedly testing it without breaking the larger trend.
The 20-day moving average tends to create more meaningful entries because it sits farther below the price. Depending on the stock’s volatility and the strength of the prior advance, price may already be meaningfully below its high by the time it reaches the line, which can be enough to shake out short-term traders and create a favorable risk-reward setup.
The 50-day moving average is the classic institutional support level. Major winners often test it several times during a long advance, and the first pullback to the 50-day is frequently one of the most important opportunities in the move. In a growth leader, the stock may be 15 to 25 percent below its high by then, which creates enough fear to produce a serious shakeout.
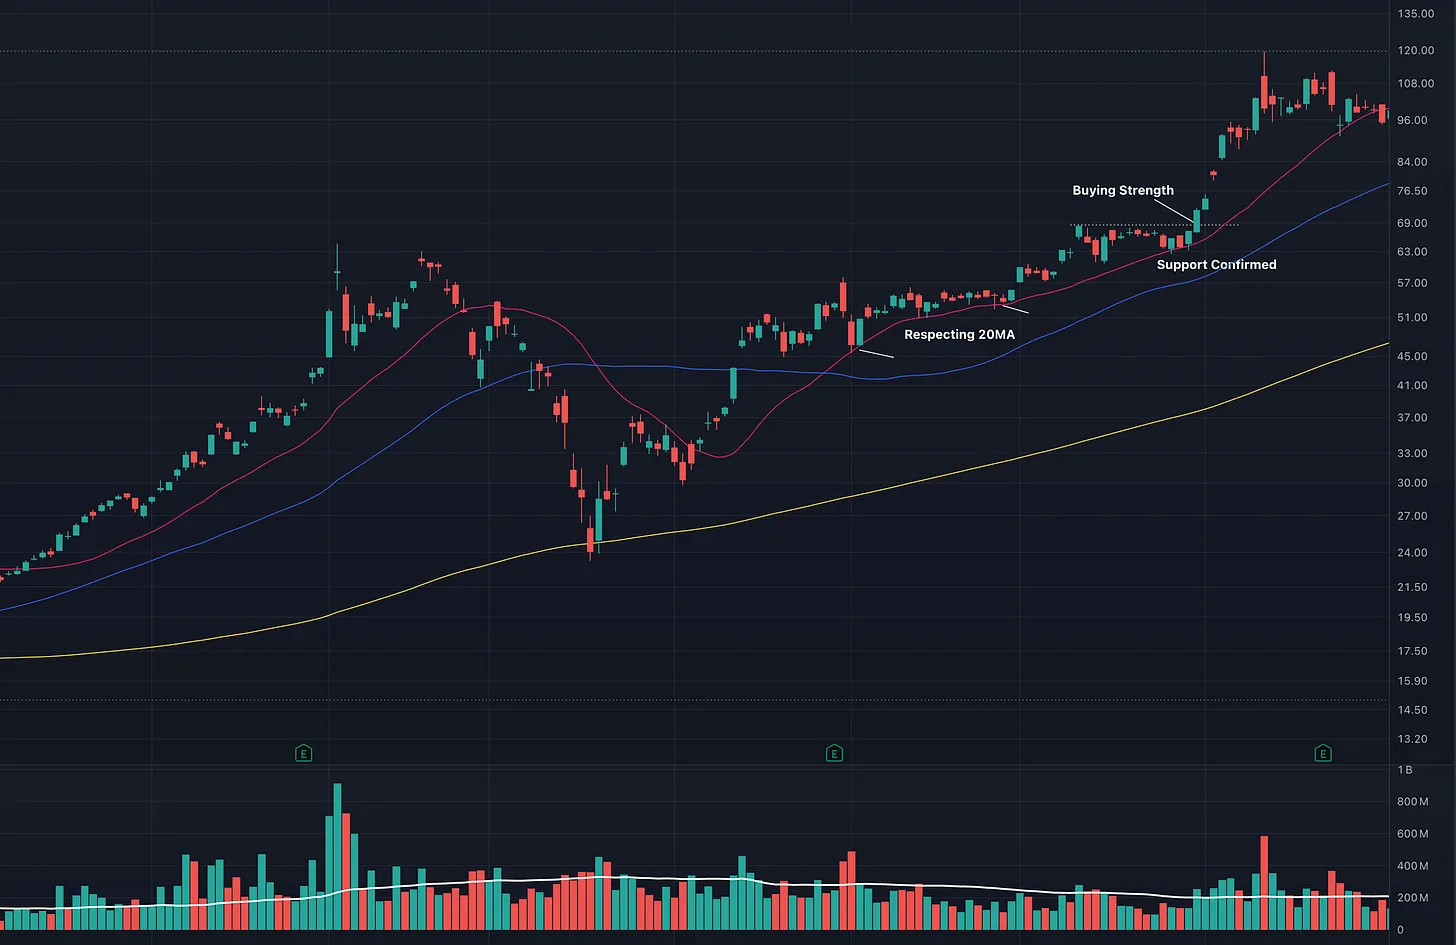
Prior resistance can also become support. When a stock breaks above the top of a base or consolidation, that old ceiling may become a floor during the next correction. The strongest setups often occur when the top of a prior base and a rising moving average are located in the same area.
The Four Ways to Buy a Pullback
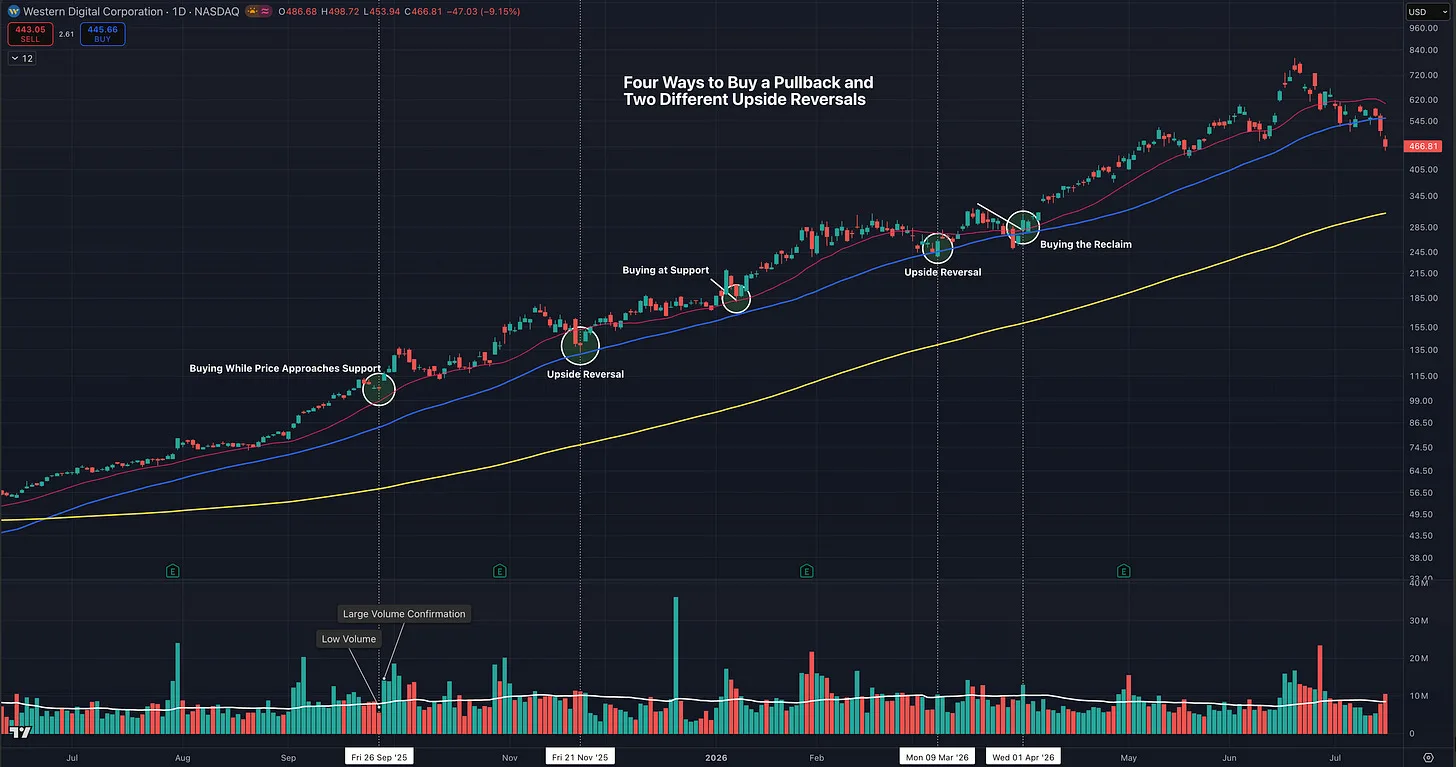
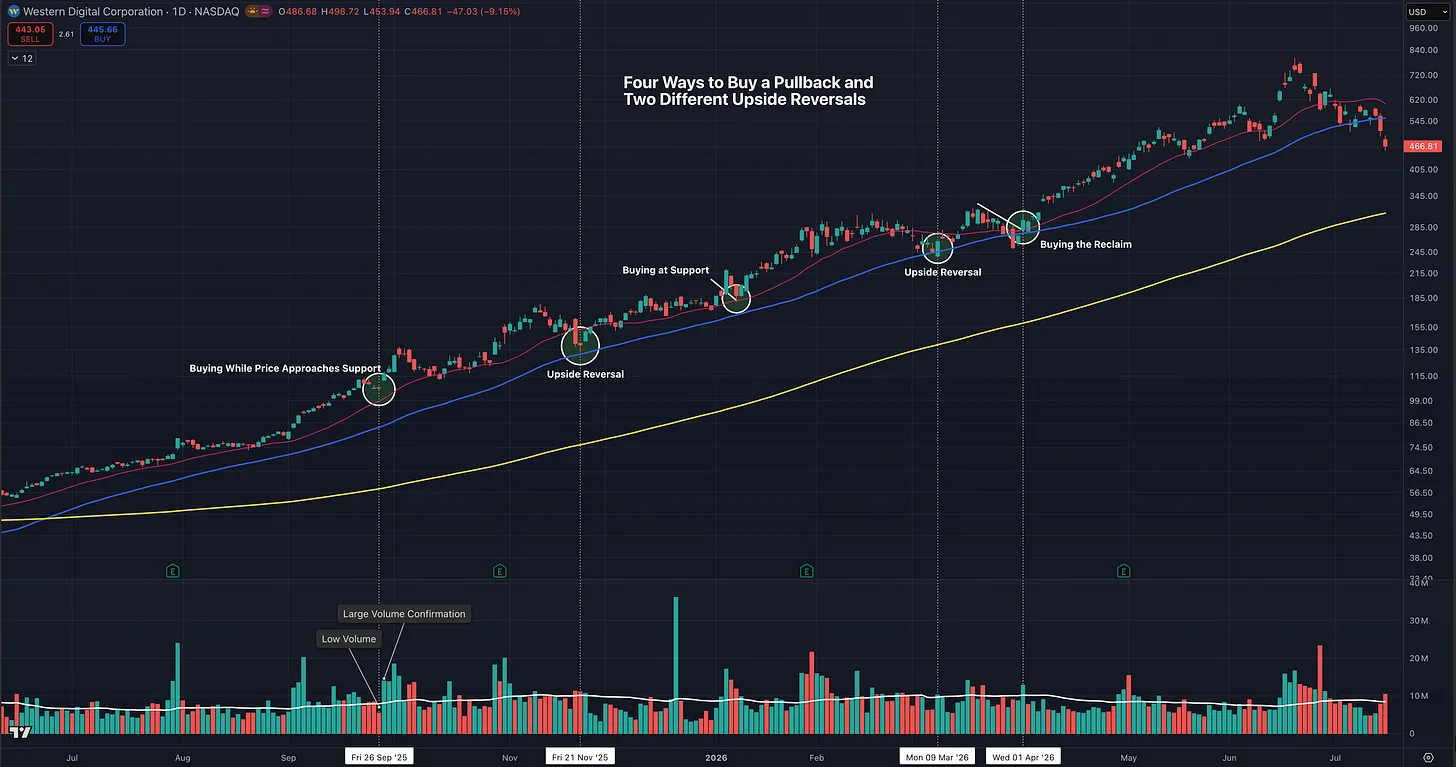
There are four practical ways to enter a pullback. A trader can begin buying while the stock is approaching support, buy directly at the support level, buy an upside reversal, or wait for a reclaim and additional confirmation. Each approach offers a different balance between entry price, risk, and proof that buyers are stepping in.
1. Buying While Price Approaches Support
Buying while the stock is still falling toward support is the most aggressive method. The trader believes a specific level is likely to hold and begins building a small position before the stock has shown clear evidence of a bounce. The main advantage is the potential for an excellent cost basis and the ability to participate if the stock moves quickly off support before providing a cleaner entry.
The disadvantage is that the stock has not yet confirmed anything. It may continue falling, fail at the anticipated support level, or force the trader to sit through additional volatility before the setup improves. A properly placed stop should prevent a small loss from becoming a large one, but the trade still carries a higher probability of failure because buyers have not yet demonstrated control. You may have a support area to use when defining risk, but the setup is usually stronger when that support is paired with a confirmed price low that provides a more precise line in the sand. This is my least-favorite entry method because I generally prefer to see some evidence that price is moving off support, reclaiming the intraday low, or pushing above the prior day’s close or high.
2. Buying Directly at Support
Buying directly at support is slightly more conservative. In this case, the stock has reached the level where demand should appear, such as the 20-day moving average, the 50-day moving average, the top of a prior base, or another clearly defined support area. The trader may place an order near that level and use a stop if price decisively violates the support zone. Buyers have still not proven that they will defend the level, but the trade is being entered at the location where the risk can be more clearly measured.
3. Buying the Upside Reversal
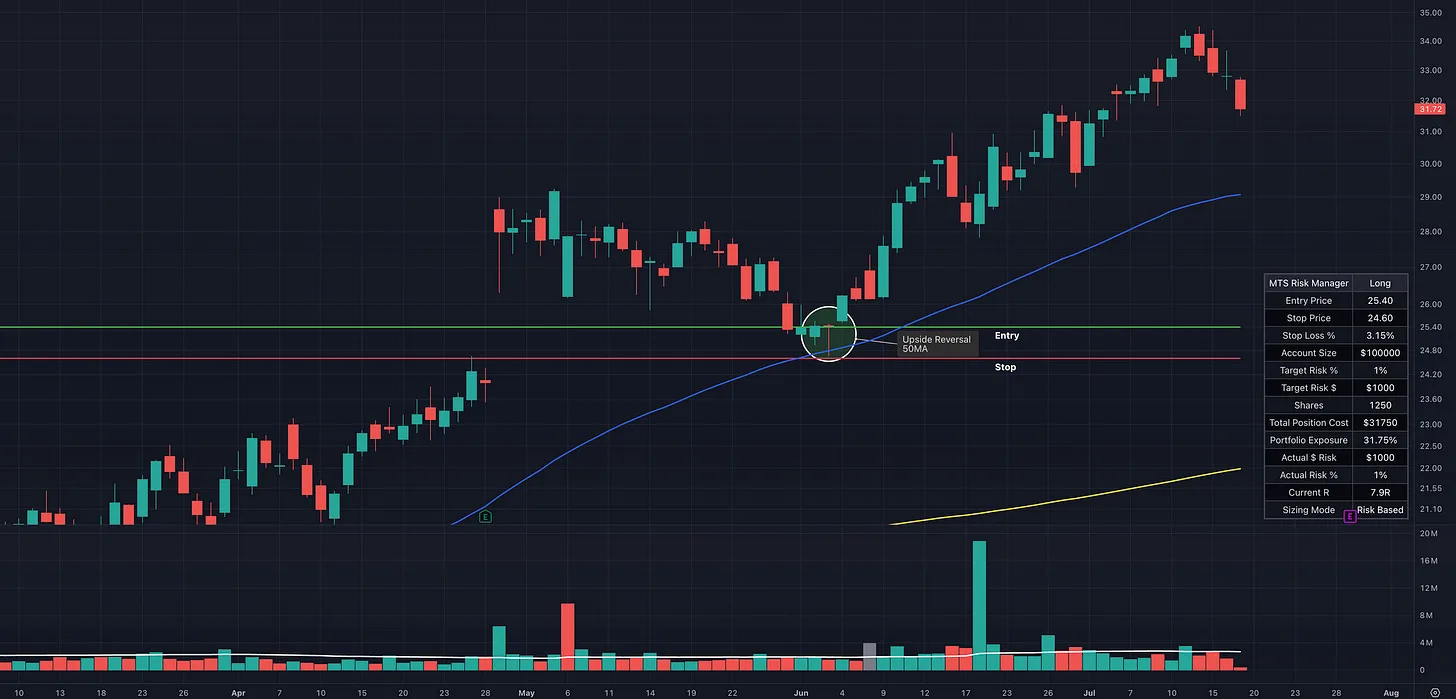
The third approach is to buy an upside reversal. Instead of anticipating support, the trader waits for evidence that sellers have lost control and buyers have stepped in. Price may touch or briefly undercut support, establish a low, and then rally sharply enough to close well off that low and near the upper portion of the daily range. This usually produces a slightly higher entry price, but it provides a much clearer signal that demand has appeared.
This is one of my favorite approaches because price is confirming the setup while also providing a clear line in the sand. The low of the reversal day, together with the support area, can be used to define risk. More active traders can also drop down to an intraday chart and watch the shift in real time. Time and Sales can help show buyers overwhelming sellers, Level II can provide additional context, and tick charts can make the change in order flow easier to visualize.
4. Buying the Reclaim or Follow-Through
The fourth approach is to wait for additional confirmation. The trader may buy when the stock reclaims the moving average, moves above the reversal-day high, clears the prior day’s high, or produces strong follow-through during the next session. This method offers more proof that the pullback has ended, but it usually requires paying a higher price.
I use this approach frequently, especially when the initial upside reversal does not close above the prior day’s high or fully reclaim the support level. In those situations, the next day’s strength can provide the confirmation that was missing from the original reversal.
Experienced traders may combine all four methods, while others may specialize in only one or two. As with nearly everything in trading, each approach has advantages and disadvantages. The best method is the one that fits your personality, allows you to define risk clearly, and matches the type of price action the market is currently rewarding.
Four pullback entries.
What an Upside Reversal Actually Is
The term “upside reversal” is often used too loosely. Some traders call any green candle after a decline a reversal. Others require the stock to close above the previous day’s high. The best way to understand reversal days is to view them as a spectrum of quality.
At a minimum, an upside reversal occurs when a stock trades materially lower during the session and then closes well off the low. Sellers control the stock early, but buyers step in and change the character of the day. The long lower wick shows that lower prices were rejected.
A stronger reversal closes in the upper third of the daily range. A better version also closes above the opening price, which turns the candle green. The highest-quality reversal reclaims support, closes above the prior day’s high, occurs on expanding volume, and receives immediate follow-through during the next session.
Not every valid reversal will satisfy all of those conditions. A stock can gap below its 50-day line, fall sharply, and then rally to close near the high while still finishing red for the day. That is not a perfect reversal, but it still shows meaningful supporting action.
The location is often more important than the color of the candle. An imperfect reversal at the first test of a rising 50-day moving average may be more significant than a beautiful green candle that occurs in the middle of nowhere. A reversal signal should always be evaluated in relation to the support level being tested.
Volume adds another layer of confirmation. A reversal on heavy volume suggests that large buyers absorbed meaningful supply. A reversal on average or light volume can still work, but it provides less evidence of institutional demand and may require stronger follow-through.
When to Buy the Reversal Day
A trader should not buy simply because a stock gaps beneath support. The purpose of waiting for a reversal is to let the stock establish a low and then prove that buyers are stepping in.
The cleanest reversal entry usually occurs late in the session. By that point, the stock has already made the low, rallied substantially from it, and shown that the recovery is holding into the close. A trader who buys too early is still guessing that support will hold.
An experienced trader may begin buying sooner if the stock sharply undercuts support, attracts volume, and immediately begins reclaiming the level. That approach can improve the entry price, but it also increases the risk that the apparent bounce will fail before the close.
The low of the reversal day becomes the primary line in the sand. The entire thesis is based on the idea that buyers rejected that price. If the stock later breaks the low and fails to recover quickly, the supporting action has been invalidated.
A reversal can occasionally undercut its low during the next session and reverse again. Some volatile leaders produce a second shakeout before moving higher. A trader may allow limited flexibility if the stock quickly recovers, but a continued decline should not be rationalized as normal action.
The Reclaim and Confirmation Entry
A moving-average reclaim is not the same as the initial reversal. A stock can reverse sharply from the low and still close below the 50-day moving average. Buyers have rejected the lowest prices, but they have not yet repaired the technical damage.
The reclaim occurs when the stock moves back above the moving average. It may happen late on the reversal day or during the following session. The reclaim provides confirmation that the break below support may have been a shakeout rather than the beginning of a larger decline.
A trader who buys the reversal is purchasing the change in intraday control. A trader who buys the reclaim is purchasing proof that the stock has recovered the lost level. The reversal entry usually offers a lower price. The reclaim entry usually offers a higher probability.
A practical approach is to divide the trade. The trader can buy a partial position near the close of the reversal day and reserve additional capital for the reclaim. This reduces the chance of missing the move without requiring a full commitment before the stock confirms.
The stop on a confirmation entry can be managed in several ways. A tighter stop can be placed below the low of the confirmation day or just beneath the reclaimed moving average. A wider structural stop can be placed below the original reversal-day low.
The wider stop gives the stock more room for a normal retest, but it requires a smaller position. The tighter stop allows for greater size, but it also increases the chance of being shaken out by ordinary volatility. Stop distance and position size must always be considered together.
Another option is to use a staggered stop. For example, you could sell half the position if price breaks the confirmation-day low, then sell the remaining half if it breaks the original reversal-day low. This allows you to reduce risk early while still giving part of the position enough room for a normal retest.
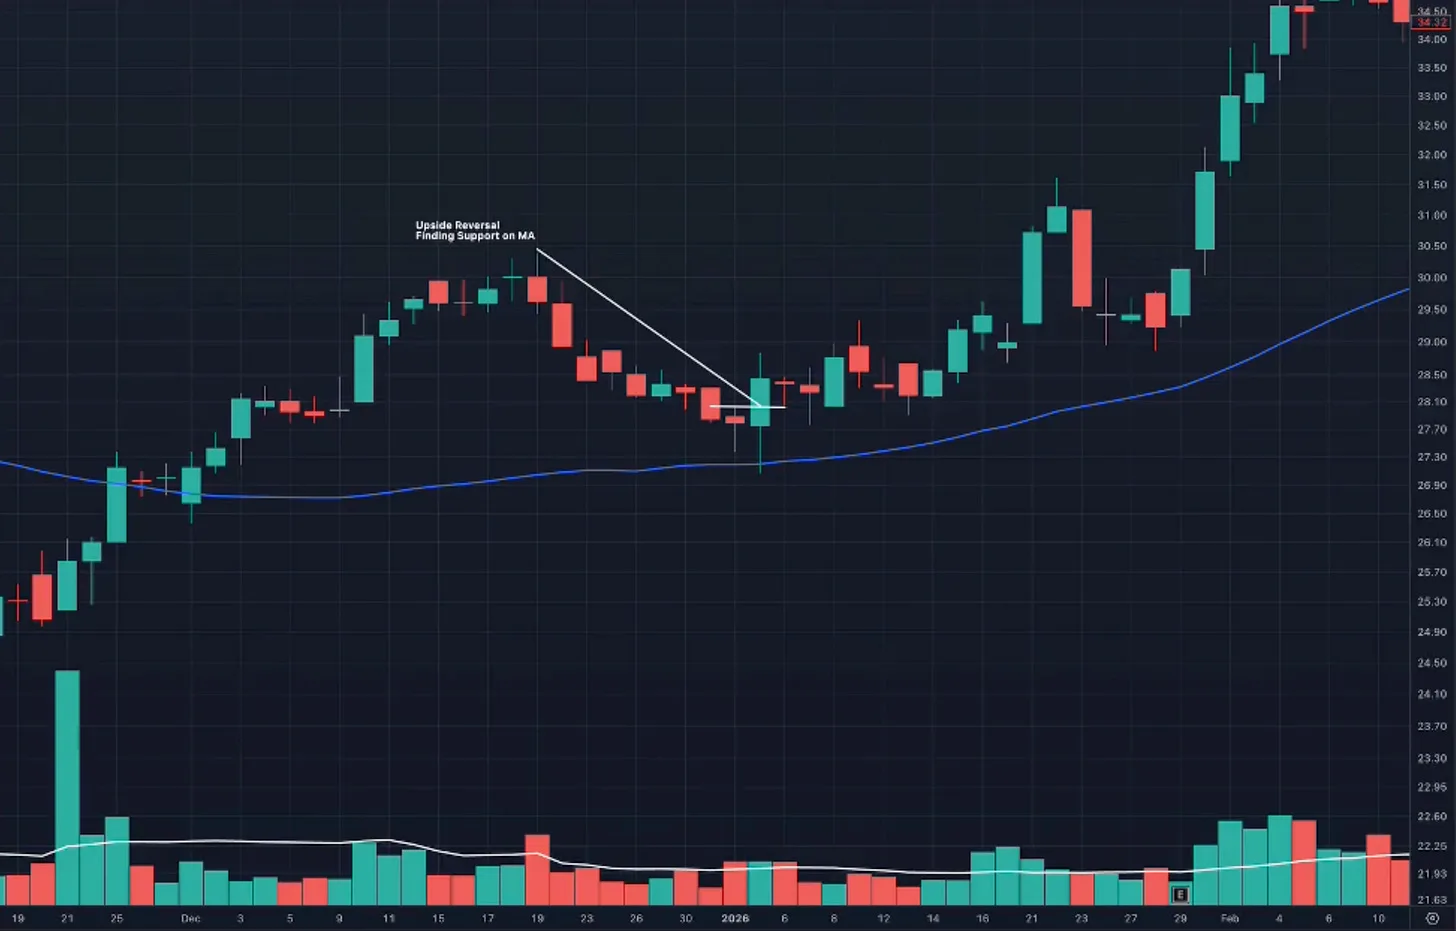
Upside reversal at the 10-day moving average.
Tight price action confirms support before a move to new highs.
Position Sizing and Building the Position
Position size should be determined by the distance between the entry and the logical stop. If the stop is close to the entry, the position can be larger while maintaining the same total account risk. If the stop is wider, the position must be smaller. The objective is to keep the dollars at risk consistent, regardless of the stock’s volatility or how attractive the setup appears.
It is important to distinguish between emotional averaging down and a planned scale-in. Emotional averaging occurs when a trader adds to a losing position simply because the stock has declined. The additional purchases were not part of the original plan, the trader may continue moving the stop lower, and the position often grows as the trade becomes less successful. The decision is being driven by hope, frustration, or a desire to improve the average cost rather than by objective price confirmation.
A planned scale-in is different because the purchase levels, maximum position size, stop, and total account risk are established before the trade begins. Some pullback traders may intentionally start with a small position as price approaches support and add at predetermined levels. This is more disciplined than emotional averaging down because the trader is following a defined plan rather than reacting impulsively.
However, even a planned scale-in still involves adding shares while price is moving against the initial position. That is where it conflicts with how I apply Paul Tudor Jones’s warning: “Don’t ever average losers.” From my perspective, planning the additional purchases in advance does not change the fact that the trader is increasing exposure before the stock has proven that support will hold.
That is not the approach I prefer. I want to see evidence that buyers are stepping in before committing capital. That confirmation may come through an upside reversal, a reclaim of the moving average, a move above the prior day’s high, or strong follow-through during the next session.
A position can then be built as the stock proves itself. For example, an initial purchase may be made on the upside reversal, followed by an additional purchase when price reclaims the moving average or clears the reversal-day high. In this case, the trader is adding as the setup confirms and the stock moves in the intended direction, rather than adding simply because the price has declined further.
Position size can be adjusted as the trade develops and as overall portfolio exposure changes. A trader may begin with a smaller position, then increase size as the stock confirms and capital becomes available from other positions. Each additional purchase should still be evaluated against the current stop, total dollars at risk, and overall portfolio exposure. A technically attractive setup can still cause unnecessary damage when size is increased without considering how much risk has already been added.
Position Sizing
The First Pullback to the 50-Day
The first pullback to the 50-day moving average deserves special attention because many great leaders successfully defend that line at least once during their primary advance. The stock may have risen rapidly after the breakout, become extended above the 10-day and 20-day lines, and then corrected sharply enough to frighten most holders.
By the time price reaches the 50-day, the stock may be 15 to 25 percent below its high. That is often enough to flush out late breakout buyers and short-term traders. Institutions that missed the original move may use the decline to establish positions, while existing holders may add shares.
The setup is strongest when the 50-day line is rising and the stock has not repeatedly tested it. A first test is generally more attractive than a third or fourth test because the support level has not yet been weakened by repeated selling.
Later tests can still work, but each visit should be evaluated more cautiously. A stock that repeatedly returns to the 50-day frequently may be losing momentum. If the stock eventually breaks the line on heavy volume, closes near the low, and fails to recover quickly, the pullback thesis has changed.
A genuine shakeout should produce a reasonably fast response. The stock does not need to move directly to new highs, but it should reclaim support, close strongly, or hold tightly near the top of the reversal range. If price continues lower, the trader should stop treating the decline as normal.
Common Mistakes
The first mistake is buying too early. A trader sees a stock decline 8 or 10 percent and assumes the pullback is already substantial. The stock then continues another 10 percent toward the actual support level. Patience is essential because meaningful pullbacks can unfold over several sessions or continue developing for several weeks.
The second mistake is buying without identifying support. A lower price is not a setup. The trader must know why demand should appear in that area and where the position will be sold if the level fails.
The third mistake is assuming every lower wick is an upside reversal. The closing location, support level, volume, prior range, and next-day action all matter. A weak intraday bounce in the middle of a downtrend is not the same as a sharp rejection of the first 50-day test in a market leader.
The fourth mistake is using conviction to ignore technical failure. A great company can still have a broken chart. If the stock breaks the reversal low, closes decisively below support, and continues lower, discipline must override the story.
The fifth mistake is treating every market environment the same. Pullback buying works best when the market is healthy and leading stocks are respecting support. When reversals repeatedly fail and 50-day lines are being broken across the market, the strategy should be reduced or suspended.
A Simple Framework for Evaluating Any Pullback
The first question is whether the general market is healthy. If the market is weak, the odds of support holding are reduced.
The second question is whether the stock remains in a defined uptrend. Higher highs, higher lows, and a rising 50-day moving average provide the basic structure.
The third question is where support should appear. Before considering an entry, the trader should identify the level where buyers are expected to step in, such as the 20-day moving average, the 50-day moving average, a prior pivot, the top of a base, or another technically meaningful area. The trader can then evaluate whether the stock actually respects that level and shows evidence of support.
The fourth question is how much confirmation is required. The trader can anticipate support, buy the level, wait for an upside reversal, or wait for the reclaim.
The fifth question is where the trade is wrong. The stop may be below support, below the reversal low, below the confirmation-day low, or based on a decisive close beneath the level.
The final question is how many shares can be owned without exceeding the account’s risk limit. The technical stop should determine the position size, not the other way around.
“The position size on a trade is determined by the stop, and the stop is determined on a technical basis.” -Bruce Kovner
Conclusion
Remember: “The trend is your friend, except at the end when it bends.”
— Ed Seykota
Eventually, every stock will stop finding support and its advance will end. Until that happens, however, constructive pullbacks can provide excellent opportunities to participate in a continuing uptrend.
Buying pullbacks is not about purchasing weakness indiscriminately. It is about buying temporary corrections in leading stocks whose primary trends remain healthy. The best setups occur when the broader market is supportive, the company has strong growth fundamentals and institutional sponsorship, price is approaching a meaningful technical level, and the trader can clearly define the risk before entering.
Pullbacks provide additional opportunities to enter a stock after missing the original base breakout. This matters because true market leaders can continue advancing for months or even years, producing several actionable setups along the way. Pullbacks can also offer existing shareholders a lower-risk way to add to winning positions as the stock continues to prove itself.
Different stocks often respect different areas of support, and the most relevant moving average may also depend on the trader’s timeframe. Shorter-term swing traders may focus more closely on the 10-day and 20-day moving averages, while position traders may give greater importance to the 50-day line and the broader trend.
An exceptionally powerful leader may repeatedly find support at the 10-day moving average. A stock advancing at a steadier pace may offer tactical entries near the 20-day line, while the first meaningful pullback to the 50-day moving average can provide one of the most important opportunities within a major advance. Prior resistance, earlier pivot points, and the top of a base can also become support, especially when they align with a rising moving average.
There are several valid ways to enter a pullback. Buying as price approaches support offers the lowest entry price, but it also provides the least proof that support will hold. Buying an upside reversal offers evidence that buyers have stepped in and regained control. Waiting for price to reclaim a key level provides greater confirmation, but it requires accepting a higher entry price.
No entry method eliminates uncertainty. The trader must decide how much price advantage to sacrifice in exchange for additional proof, then size the position according to the distance between the entry and the logical stop. A wide reversal day may be technically attractive, but if the reversal low is far below the closing price, the position must be smaller to keep total account risk consistent.
Discipline must always take priority over conviction. A pullback remains an opportunity only while the larger trend is intact and buyers continue to defend meaningful support. Once that support fails and the stock cannot recover it, the trader should respect the evidence, exit the position, and wait for a better setup.
Great stocks will always experience pullbacks, but that does not mean you should buy every decline. The goal is to recognize the select pullbacks in which the market environment, stock quality, trend, support level, reversal behavior, and risk all align.
One final challenge: while writing this article, I will admit that I did not dig through all my model books to include every great historical example. Take this as a challenge to perform some additional chart work of your own. Study the different types of pullbacks discussed in this article across both recent market leaders and the great winning stocks of the past.
That extra hands-on chart review is what will make these concepts truly stick.
More in Strategy & Tactics
All Strategy & Tactics articles →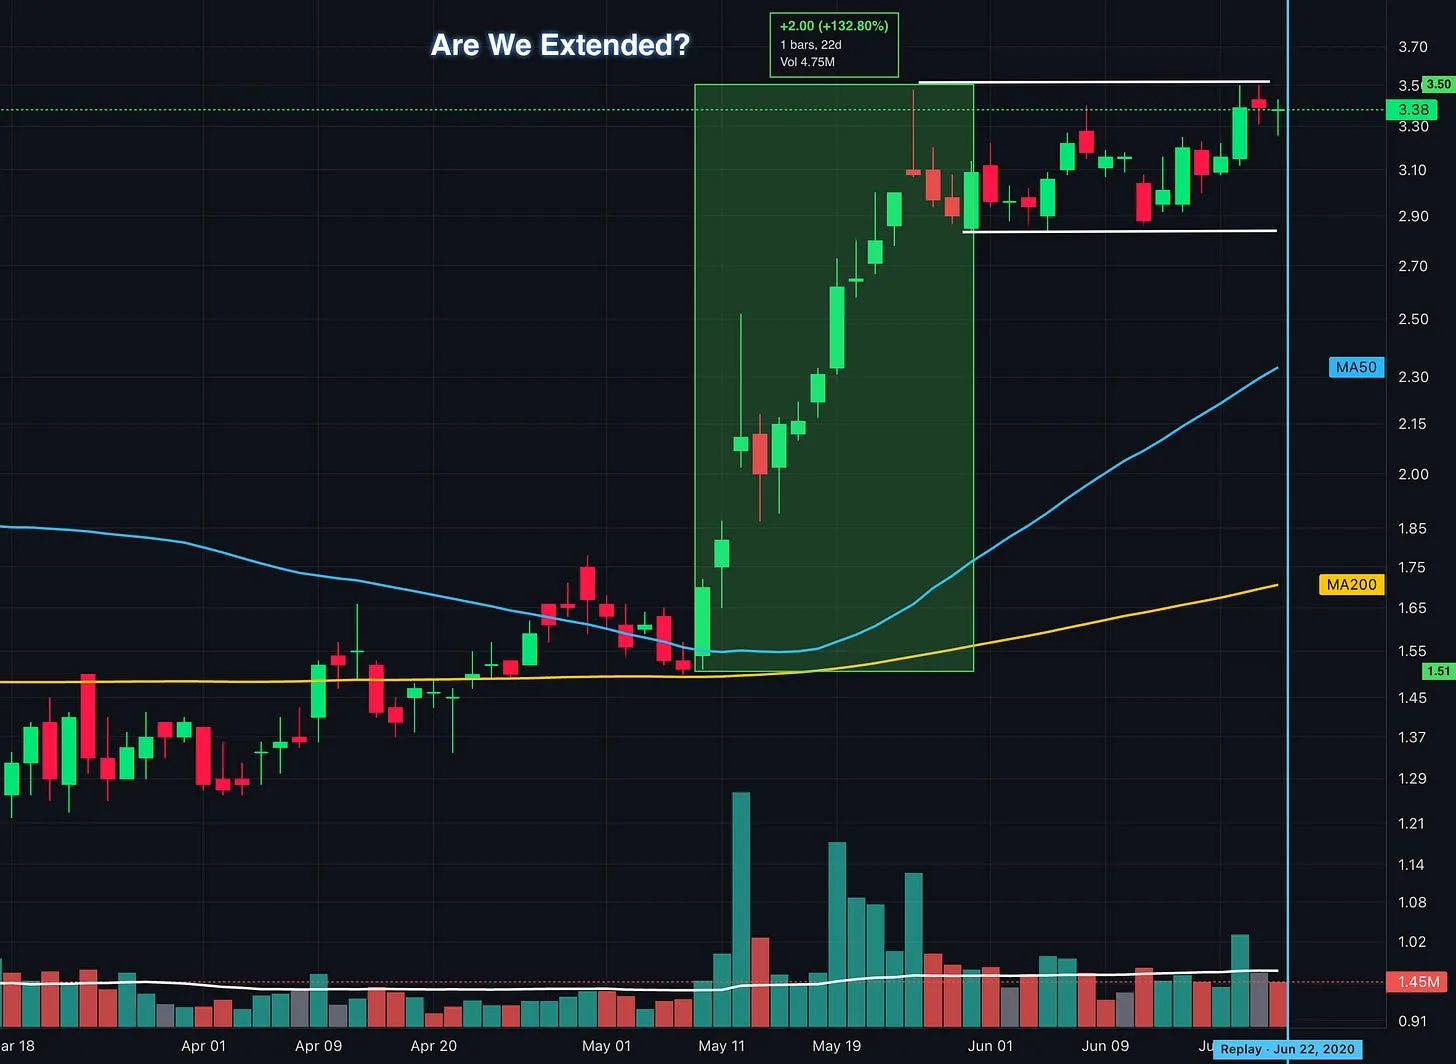
Oct 8, 2026 · Strategy & Tactics
Up 100% and Still Buyable? What Traders Get Wrong About Extended Stocks
How to identify proper buy points, avoid chasing stock breakouts, and manage entry risk using lessons from William O’Neil, Mark Minervini, David Ryan, and Dan Zanger.
- Momentum Trading
- VCP
- position trading
- Growth Stock Trading
- David Ryan
- Flag Pattern
- chart patterns
- Cup and Handle
Sep 27, 2026 · Strategy & Tactics
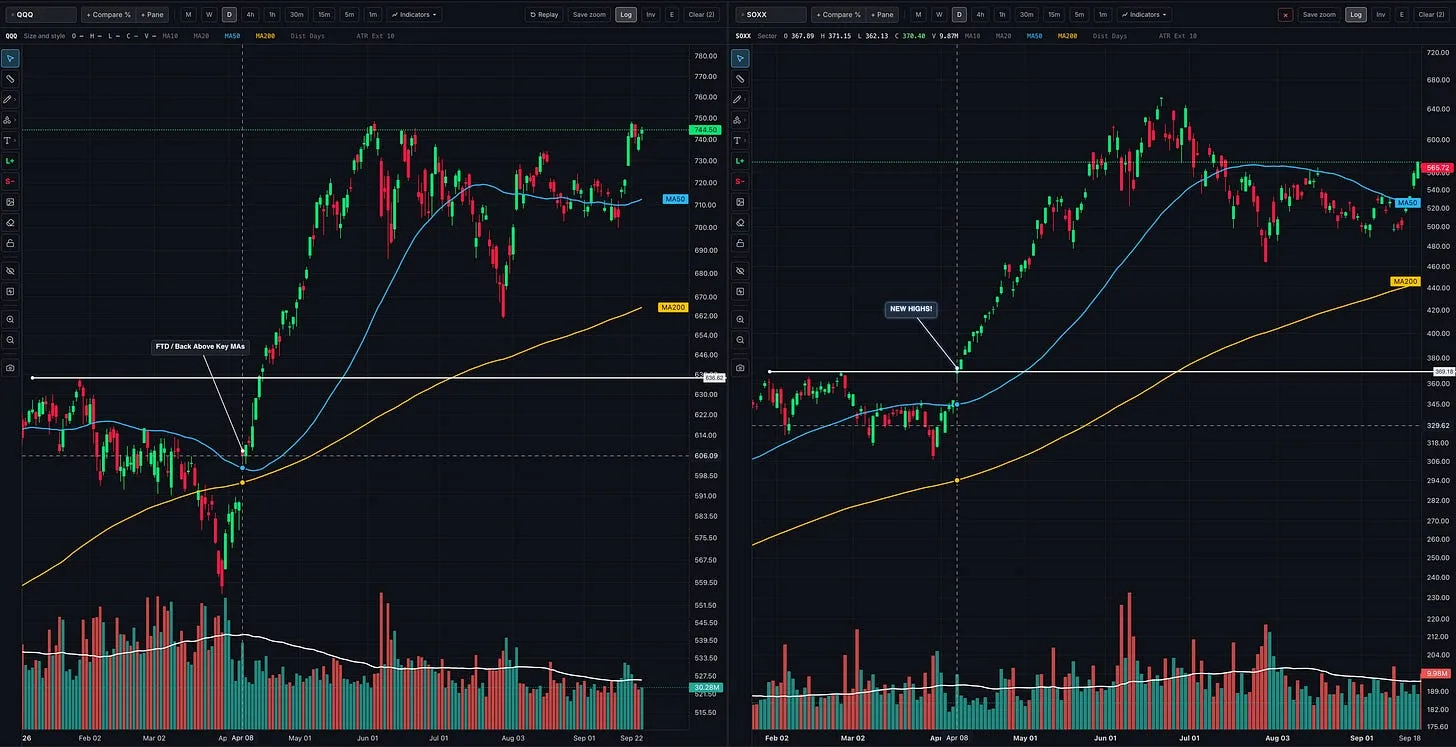
Should You Follow Leading Stocks or Wait for Market Confirmation?
How to read the market, industry groups, and individual stocks together so you can recognize opportunities, build exposure, and respond when conditions change
- growth stocks
- CANSLIM
- Trading
- position trading
- Stan Weinstein
- William O'Neil
- Momentum Trading Strategy
- Trade stocks
Sep 25, 2026 · Strategy & Tactics
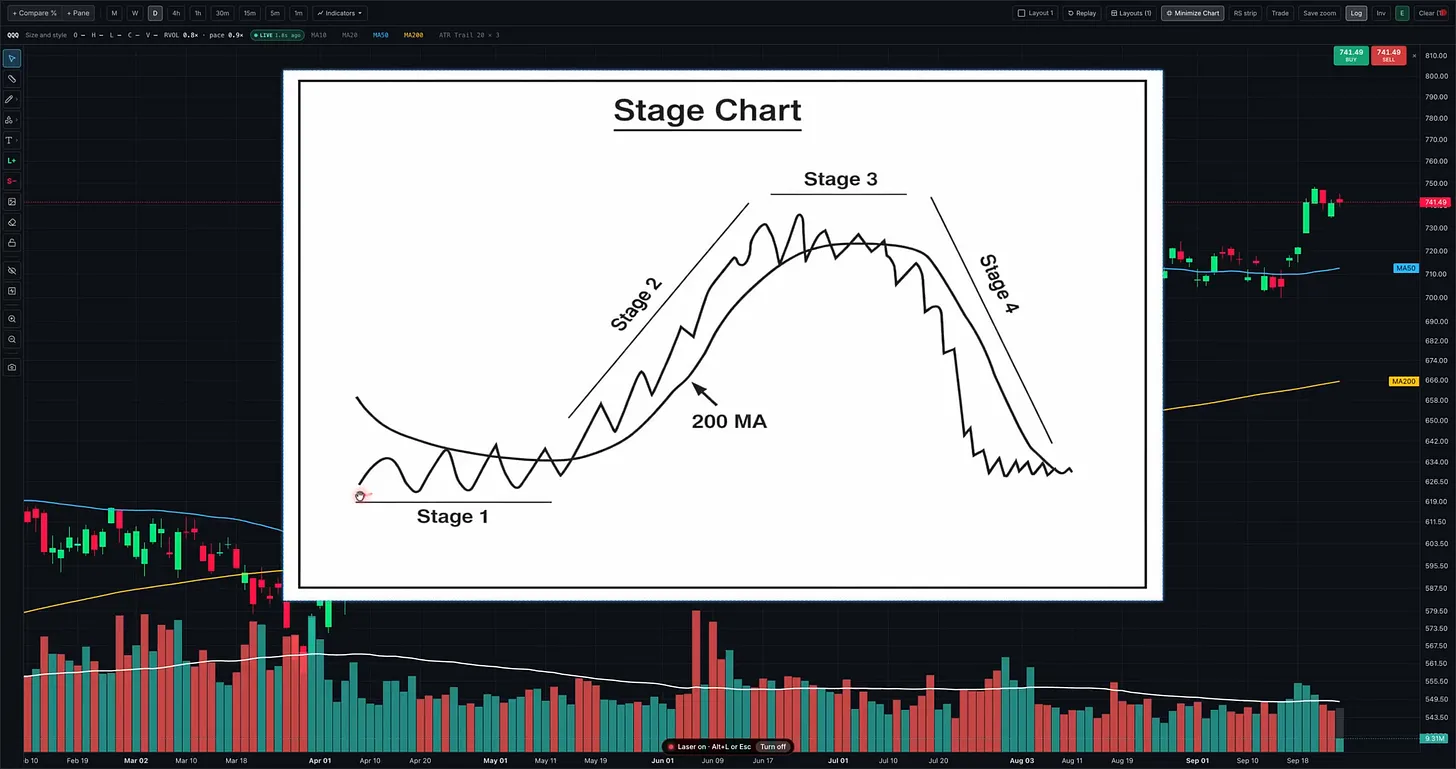
Stage Analysis: How to Spot Stage 3 in Real Time
Recognize a developing Stage 3 using Stan Weinstein’s framework, with real chart examples, warning signs, and lessons for protecting your gains
- Momentum Trading
- Nasdaq
- technical analysis
- CANSLIM
- position trading
- Stan Weinstein
- QQQ
- Find True Market Leaders