
Trading articles/19 for 19. But Don’t Buy the Headline.
Oct 31, 2026 · Momentum Trading Strategy
19 for 19. But Don’t Buy the Headline.
What 19 midterm elections reveal about the S&P 500, and why higher later does not mean higher tomorrow.
Originally published on Substack.
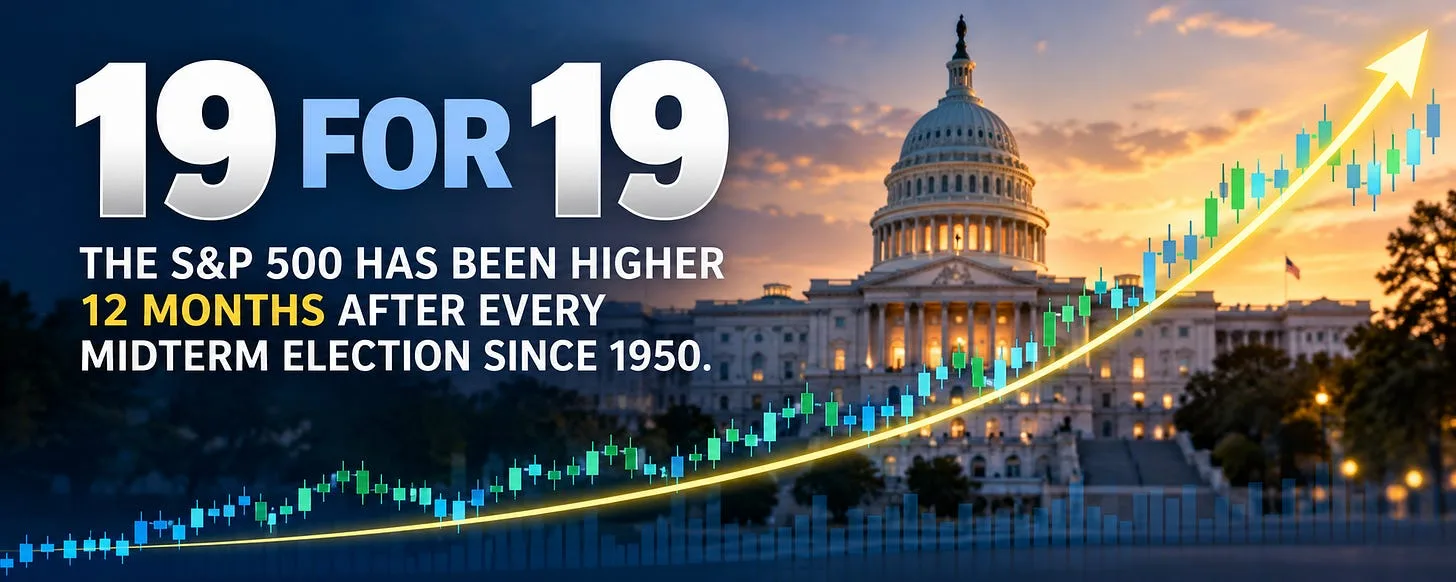
With midterm elections on Tuesday, here’s an interesting market fact.
Now, yes, it’s not like me to post random, somewhat useless market facts, but I thought I’d share this one anyway, just for fun. Don’t worry, I haven’t replaced my process.
The takeaway is to be prepared for a potentially better market, not to buy simply because an election is over. The market still has to confirm the turn.
With that out of the way, look at this.
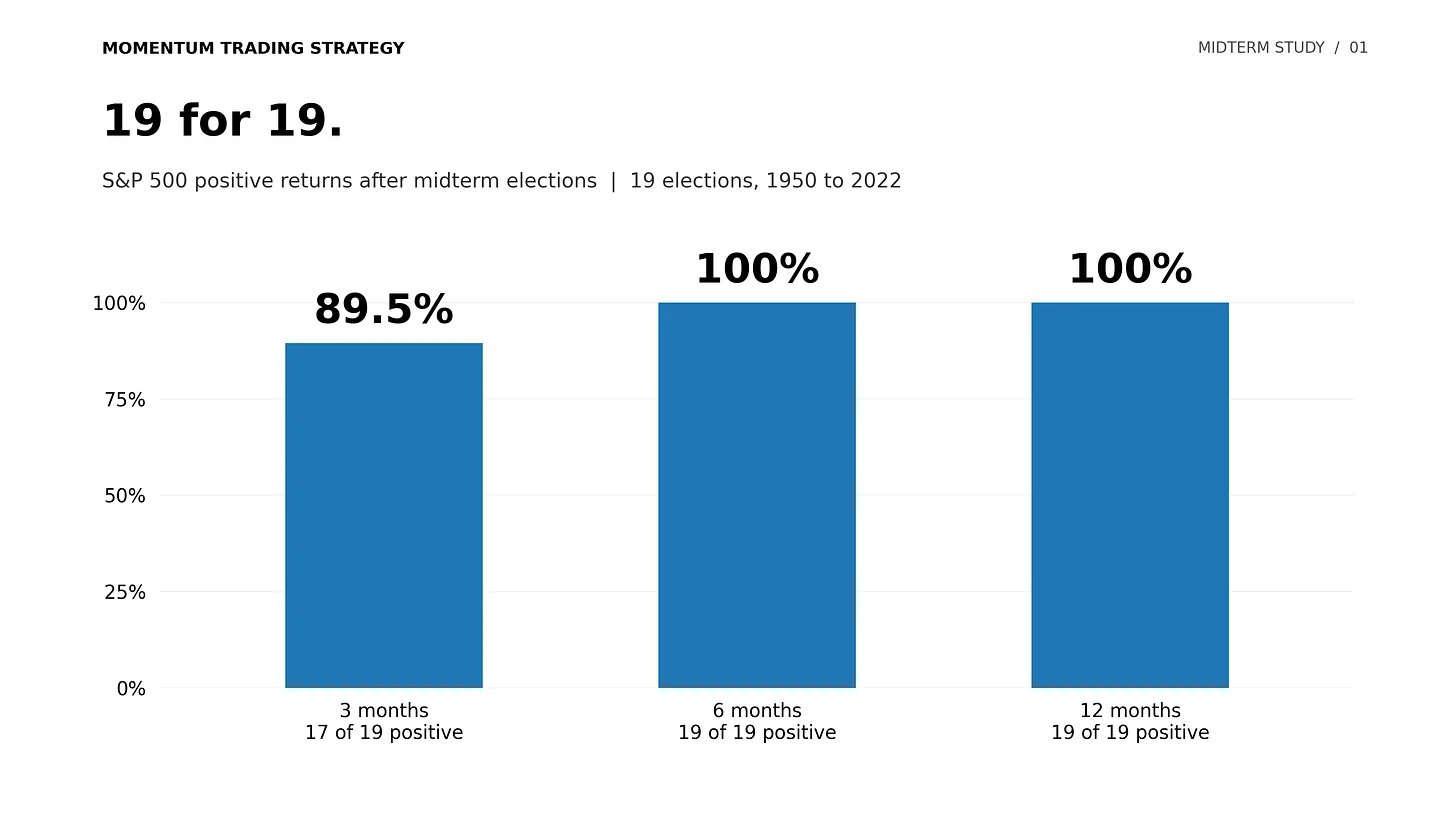
Across the 19 midterm elections from 1950 through 2022, the S&P 500 was higher twelve months later every single time.
19 elections. 19 positive outcomes. A 100% historical record.
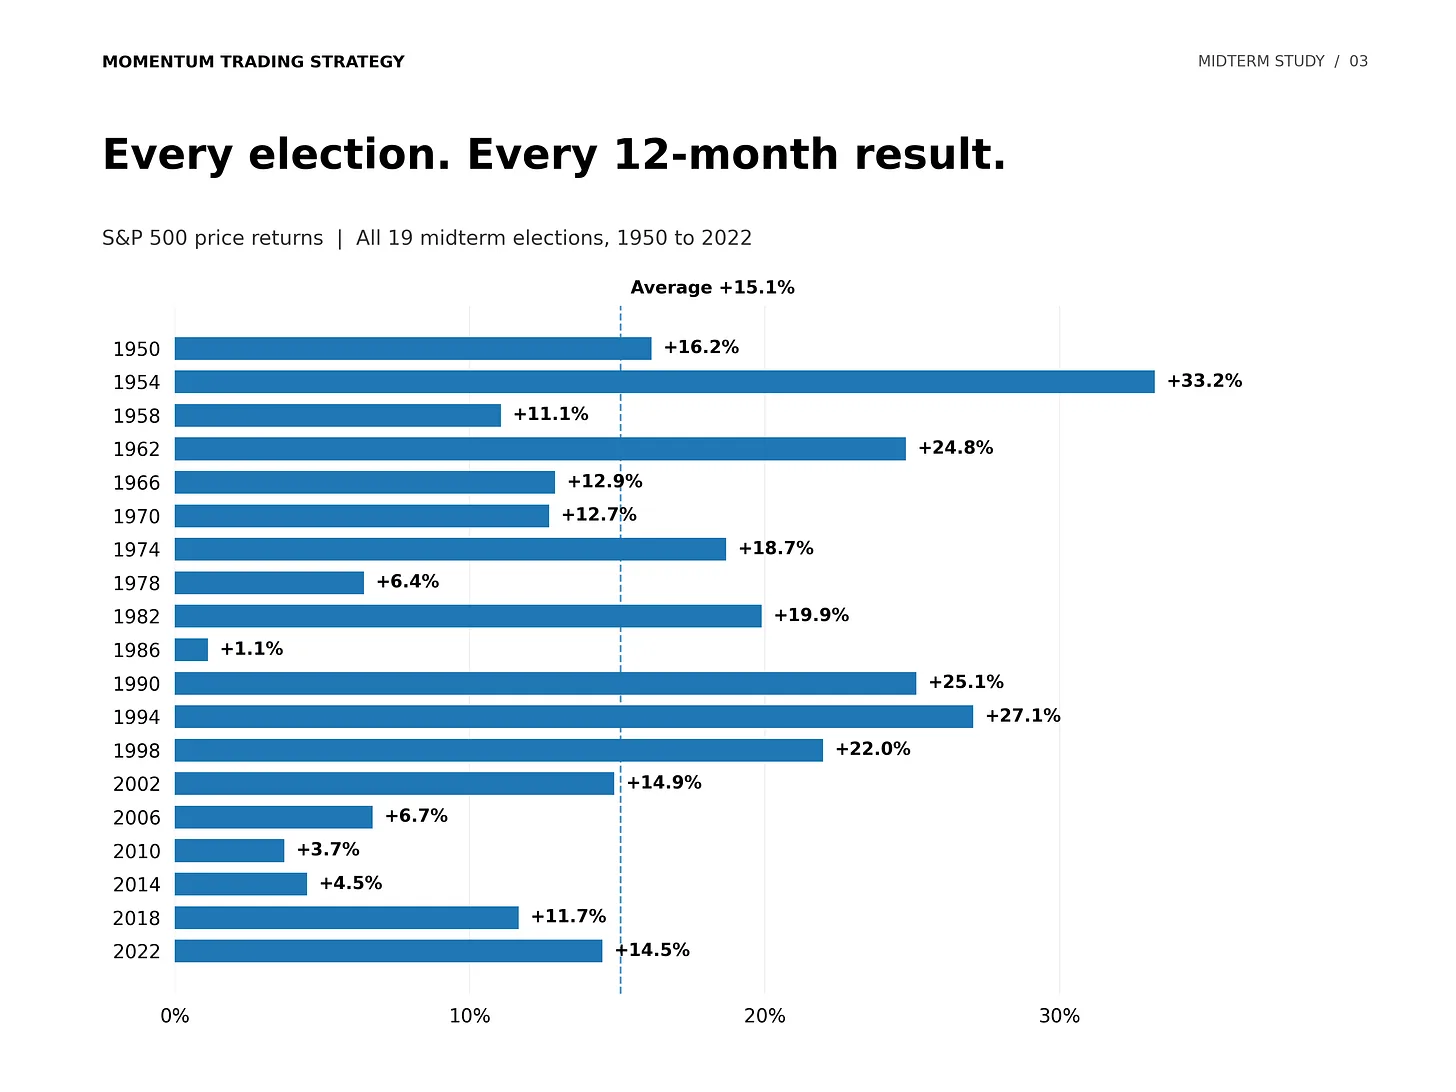
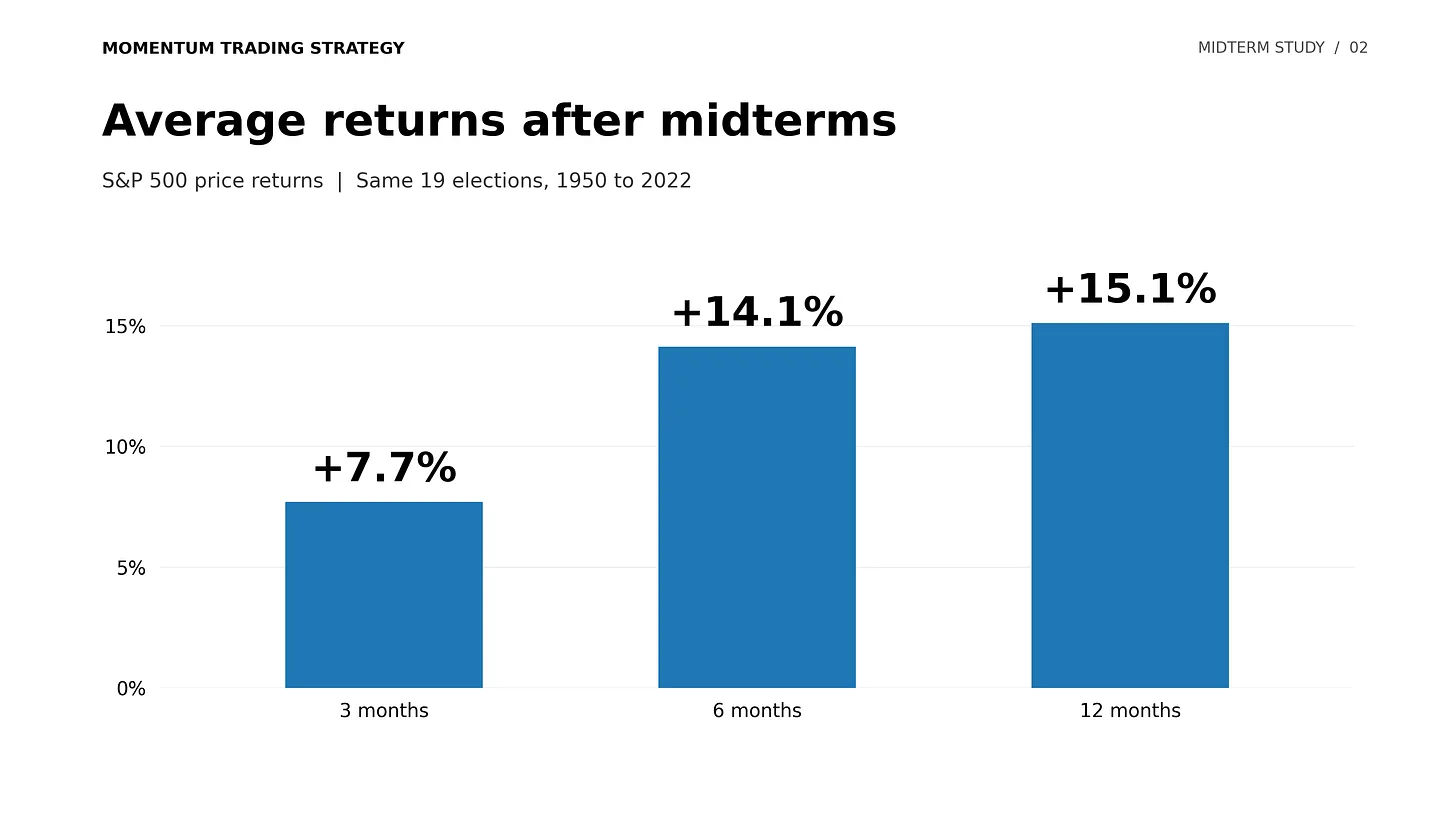
I checked the daily price history using the same 19 elections for all three periods, measuring from the last available close on or before Election Day to three, six, and twelve calendar months afterward:
- 3 months later: Higher 17 of 19 times (89.5%), with an average price return of +7.7%.
- 6 months later: Higher 19 of 19 times (100%), with an average price return of +14.1%.
- 12 months later: Higher 19 of 19 times (100%), with an average price return of +15.1%.
Those returns exclude dividends and a 100% historical record is not a 100% probability of what happens next.
But there’s another detail that matters just as much.
Before anyone sees “19 for 19” and decides to buy the index as soon as the election is over, look at 2018.
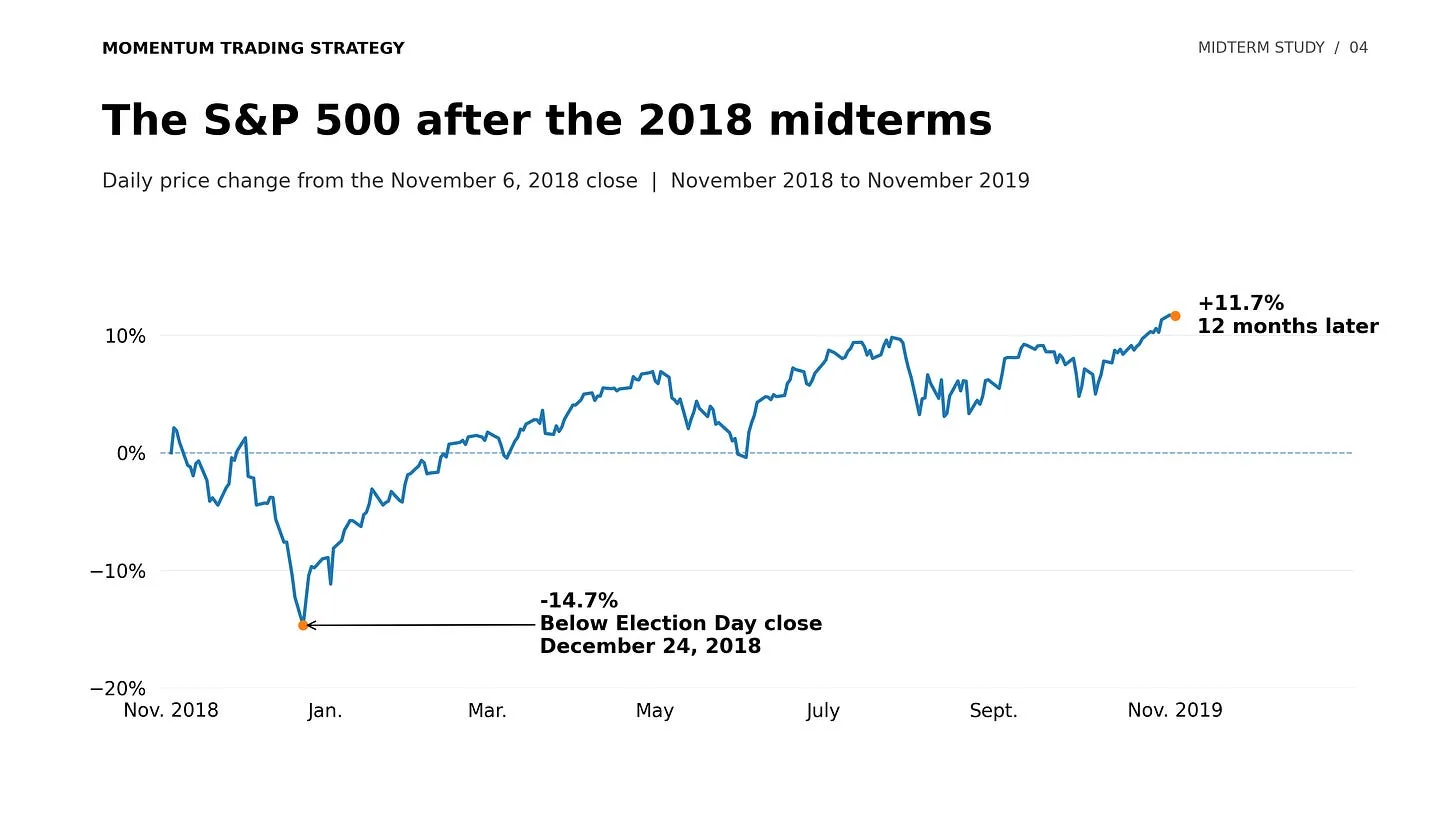
The S&P 500 finished 11.7% higher twelve months after that election. Another win for the historical record.
But along the way, it fell 14.7% below its Election Day closing price, reaching its low on December 24, 2018.
That’s almost 15% in the wrong direction before eventually delivering the positive result that looks so reassuring in the statistics.
Higher twelve months later does not mean higher tomorrow.
That is why this is context for me, not a buy or sell signal. I’m not going to ignore deteriorating price action because a historical statistic says things should improve.
I still want to see a confirmed market turn, evidence of institutional buying, and quality stocks emerging from constructive bases.
But if conditions begin to ripen, you can bet I’ll be ready.
I’ll be watching MTS Velocity for the stocks and industry groups showing relative strength, and for individual stocks tightening up and positioning themselves as potential new leaders.
I can prepare for that opportunity without putting capital at risk before my signals appear.
History gives me a reason to pay attention. The price action still has to give me a reason to act.
More in Market Commentary
All Market Commentary articles →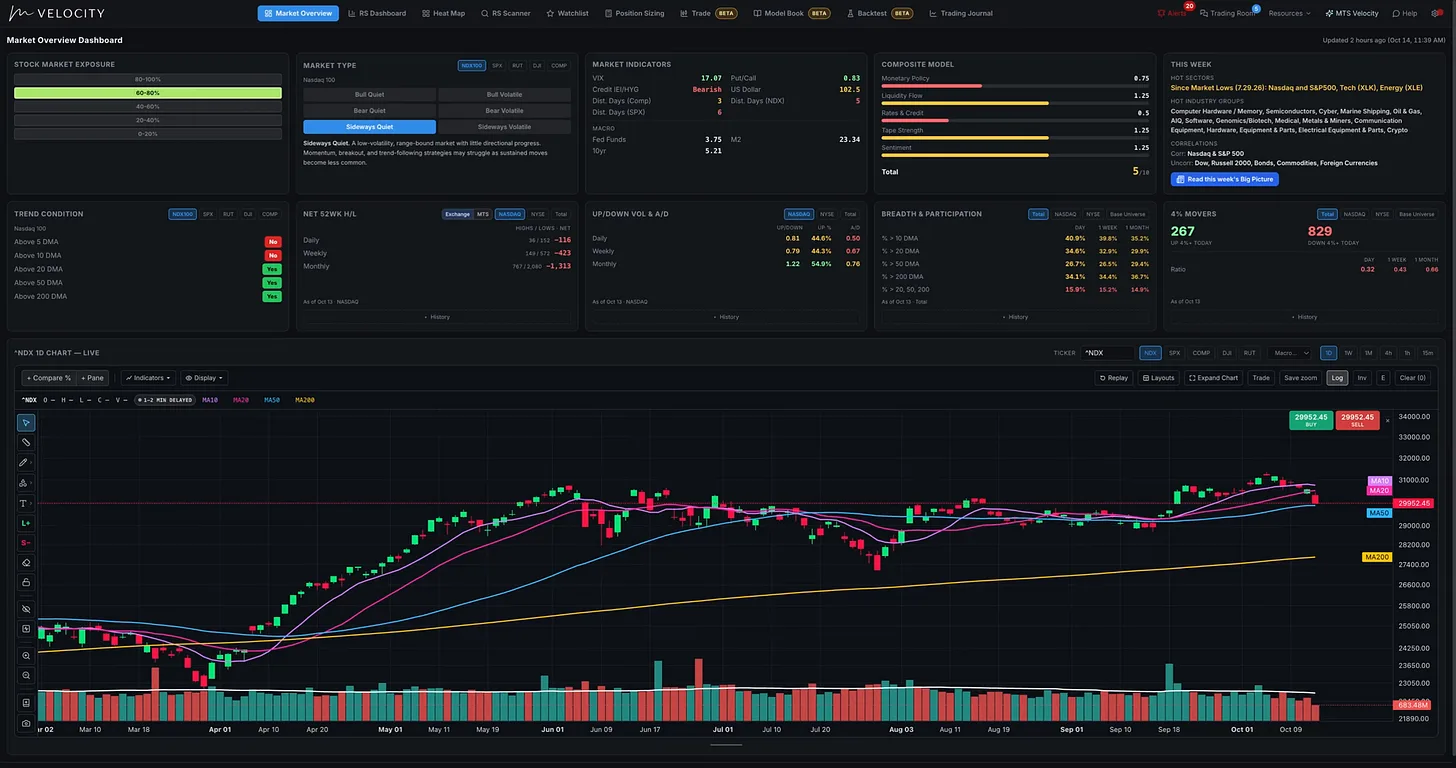
Oct 14, 2026 · Market Commentary
Stock Market Warning Signs: Why I’m Getting Defensive
Weak breadth, rising rates, failed breakouts, and increasing distribution are telling growth and momentum traders to protect capital.
Aug 14, 2026 · Market Commentary
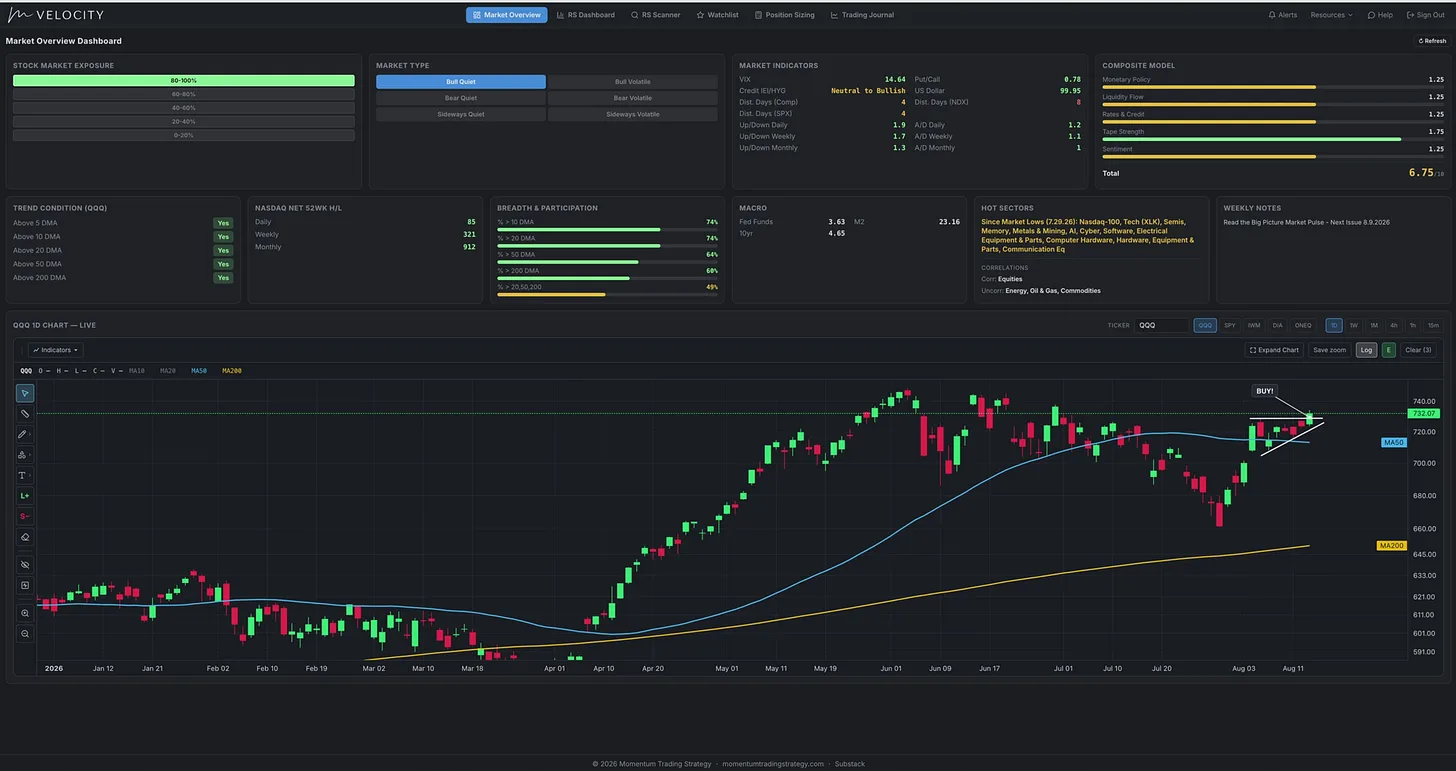
This Market Keeps Getting Stronger: 10 Stocks in 10 Different Industry Groups
Breadth is expanding, growth is leading again, and strength is showing up across the market. Here are 10 stocks that have my attention right now.
- Momentum Trading
- Investing
- CANSLIM
- Trading
- position trading
- stock trading
- Growth Investing
- Market Analysis
Dec 28, 2025 · Market Commentary
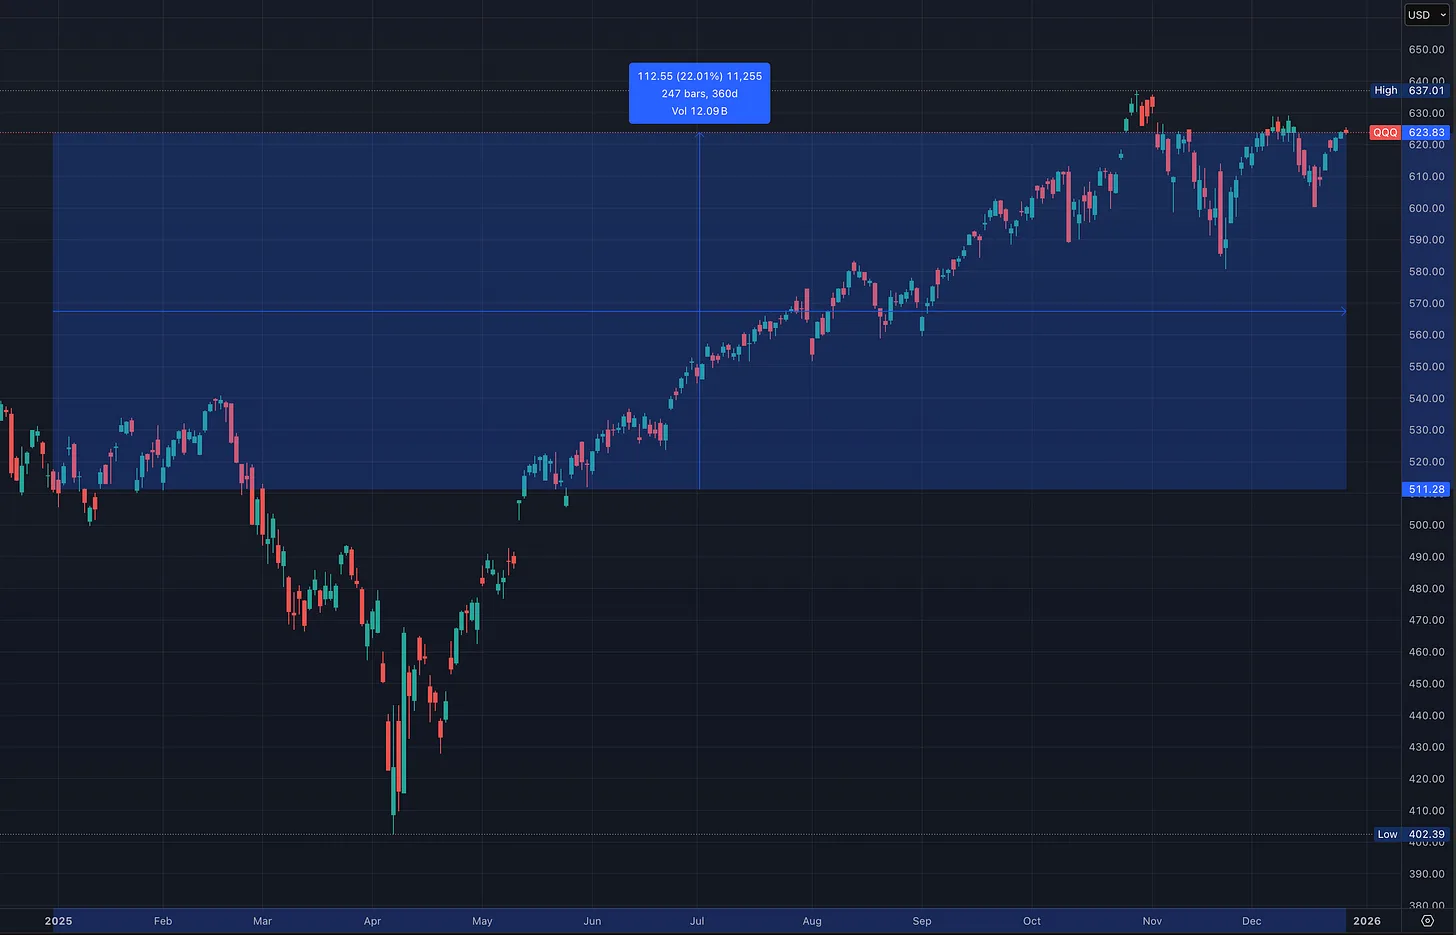
The Wall of Worry: How 2025 Proved That Bull Markets Rise Through Fear and Why Tape Reading Still Wins
What the Tape Revealed While the Headlines Got It Wrong
- Reading the Tape
- Investing
- Trading
- position trading
- stock trading
- Growth Investing
- Stock Market
- 2025 Market Analysis