
Trading articles/Stan Weinstein’s Stage Analysis: The Complete Guide to Understanding Market Structure
Nov 1, 2025 · Momentum Trading Strategy
Stan Weinstein’s Stage Analysis: The Complete Guide to Understanding Market Structure
How to Identify Each Stage of the Market and Trade in Sync with Institutional Money
Originally published on Substack.
Introduction: Why Stage Analysis Still Works
“Your job isn’t to predict the market, it’s to understand its stage.” — Stan Weinstein
In the world of trading, few frameworks have stood the test of time like Stan Weinstein’s Stage Analysis, introduced in his 1988 classic Secrets for Profiting in Bull and Bear Markets.
While countless new systems, algorithms, and indicators have come and gone, Weinstein’s model endures because it’s not about prediction, it’s about structure.
It focuses on where the market is, not where you think it’s going.
At its core, Stage Analysis helps traders identify the current phase of an asset’s life cycle and act in alignment with it.
Weinstein demonstrated that every stock, index, and market, from blue-chip giants to emerging sectors, moves through four repeating stages driven by psychology and institutional behavior.
Success, he argued, doesn’t come from forecasting tops or bottoms, but from recognizing the stage and trading with the prevailing trend.
The Foundation: Market Structure and the Four Stages
Stan Weinstein built his trading philosophy on a timeless observation:
every market, stock, and asset moves through a repeating structural cycle.
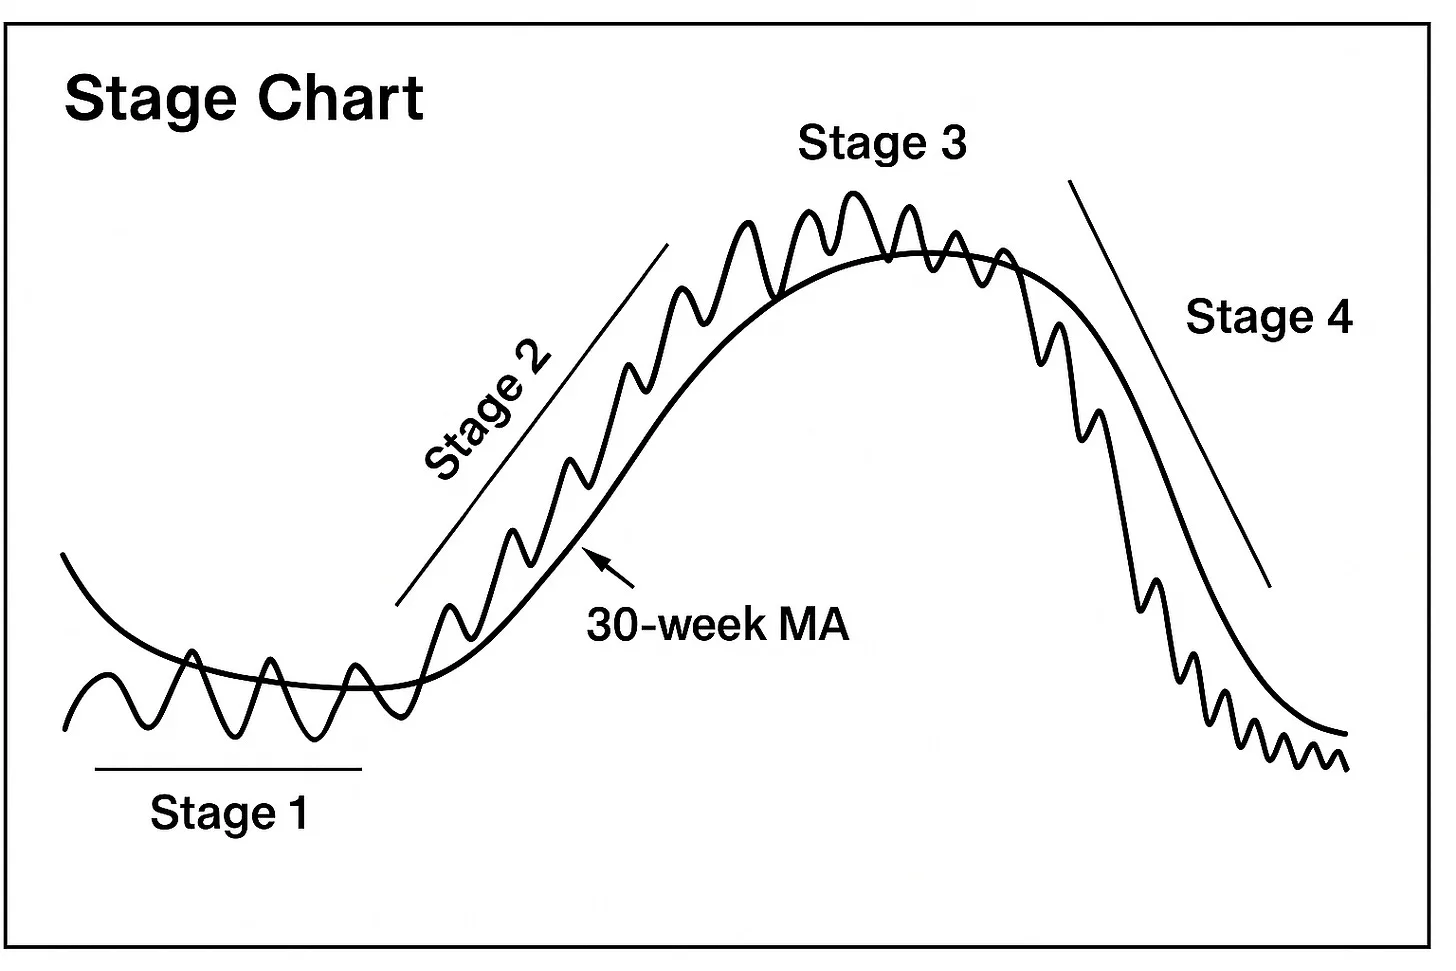
He divided this behavior into four distinct stages, each defined by the relationship between price action, volume, and the trend of a long-term moving average, traditionally the 30-week moving average.
In recent years, Weinstein has noted that he often uses the 200-day moving average instead, since it represents roughly the same time horizon but is more commonly tracked by traders and institutions. Both serve the same purpose: to visually reveal whether an asset is under accumulation, advancing, distributing, or declining.
Together, these three elements provide a simple yet powerful market compass:
- Price action shows the story of supply and demand.
- Volume reveals professional participation.
- The long-term moving average defines the true direction of trend and stage.
Used properly, they expose the underlying strength or weakness of any market, and show you exactly where you are in the cycle.
Below is the full breakdown of Weinstein’s four market stages.
Stage 1 – Accumulation (Basing Phase)
After a prolonged decline, an asset eventually reaches a point where selling pressure exhausts and prices begin to stabilize. This is the quiet rebuilding phase, when pessimism is high, volume is low, and institutional investors start quietly accumulating positions while the general public has long lost interest.
Key Characteristics
- Price stops making lower lows and begins to move sideways in a well-defined range.
- The 30-week moving average (or its modern equivalent, the 200-day MA) flattens after a downtrend, signaling that the decline has likely run its course.
- Volume contracts, showing that sellers have largely disappeared.
- Relative strength (RS) versus the broader market stops falling, often showing subtle improvement before price confirms it.
Investor Psychology
Stage 1 is dominated by fear, frustration, and apathy. The media narrative is negative, and few investors are paying attention. Yet this is often when smart money begins to accumulate, building positions while sentiment remains bleak. Most traders miss this phase because it feels uncomfortable to buy when the chart still looks dead.
Trading Strategy
Weinstein advised patience during Stage 1. Traders should focus on identifying early basing structures and wait for confirmation before acting.
The official transition to Stage 2 occurs when:
- Price breaks above resistance,
- The 30-week (or 200-day) moving average turns upward, and
- Volume expands meaningfully on the breakout.
That combination signals that institutional demand is back, and a new uptrend is underway.
“The public loses interest just when opportunity returns.”
— Stan Weinstein
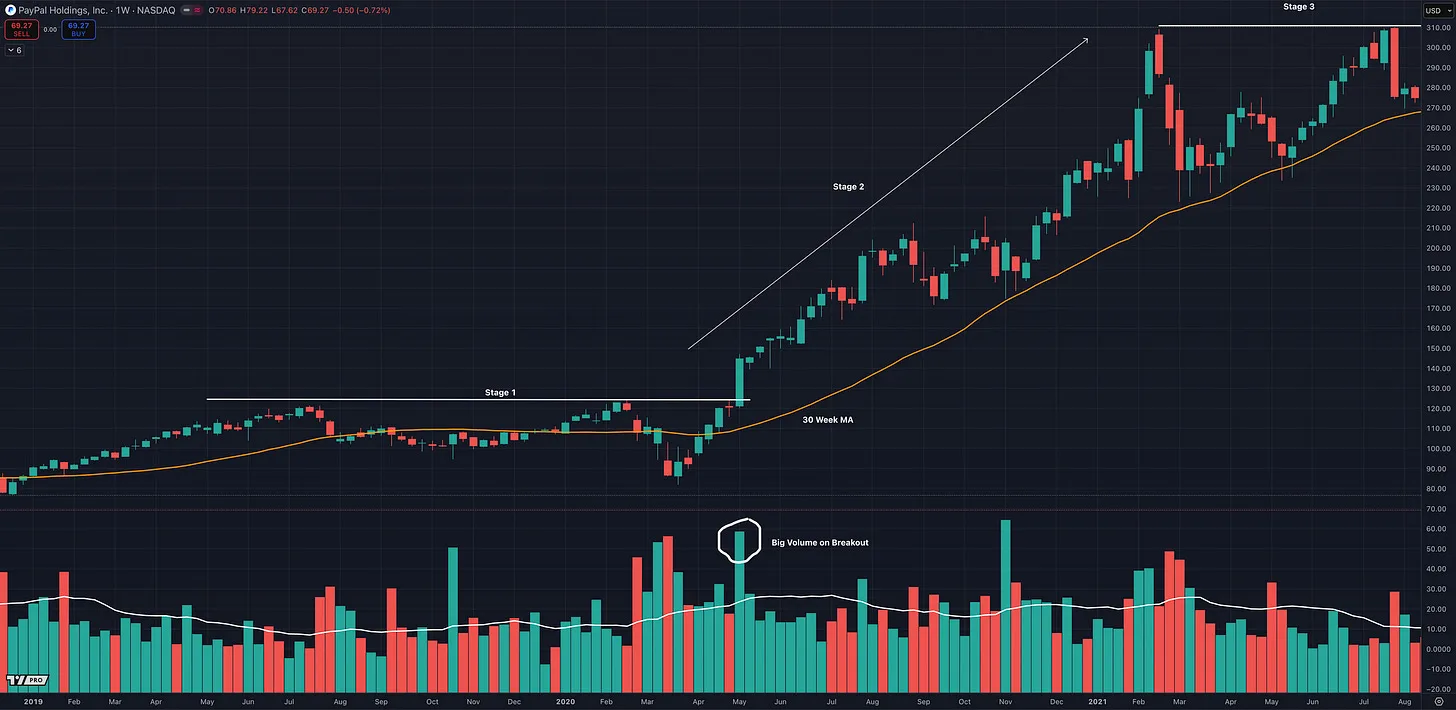
Example: PayPal (PYPL) weekly chart showing a classic Stage 1 base transitioning into Stage 2.
Note the surge in volume and the 30-week moving average turning upward as price breaks out of resistance, textbook Weinstein confirmation.
Stage 2 – Advancing Phase (Uptrend)
Stage 2 is where the real profits are made.
It begins when an asset breaks out from its Stage 1 base, surging above a rising long-term moving average, traditionally the 30-week MA, though Weinstein now often uses the 200-day MA for broader accessibility.
This breakout confirms that demand has returned and that institutional money is driving the trend upward.
Key Characteristics
- Price consistently holds above the rising moving average.
- The moving average itself slopes upward, confirming a strong uptrend.
- Volume expands during rallies and contracts during pullbacks.
- The asset shows clear relative strength versus the market index.
Investor Psychology
Confidence builds as the trend matures. Early skepticism slowly gives way to greater participation, even though the media narrative may remain cautious or bearish in the early part of the advance. As price continues higher, analysts begin upgrading ratings, sentiment improves, and the public eventually takes notice. Stage 2 feels more comfortable as the trend becomes obvious, but that comfort is also what attracts latecomers near the end of the move.
Trading Strategy
This is where professionals and trend followers thrive. Weinstein emphasized focusing on leading stocks in leading sectors, not laggards trying to catch up.
Key tactics include:
- Buying breakouts from solid Stage 1 bases on expanding volume.
- Adding to positions on constructive pullbacks near the rising moving average.
- Avoiding sideways or choppy names showing relative weakness.
The objective isn’t to buy the bottom, it’s to enter early in Stage 2 and ride the trend as long as price and structure remain intact.
“Buy right and sit tight.”
— Stan Weinstein
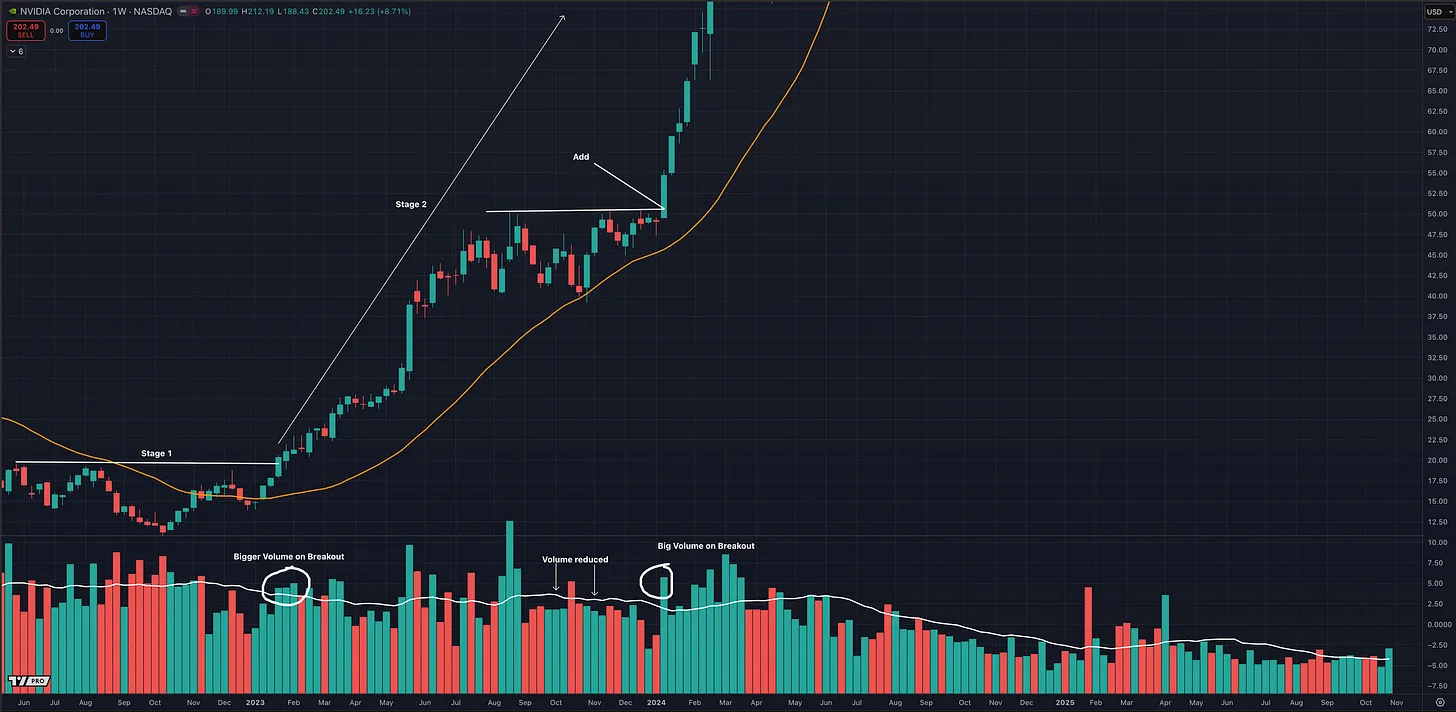
Example: NVIDIA (NVDA) weekly chart illustrating a textbook Stage 2 advance.
Note the surge in volume on the initial breakout, the upward-sloping 30-week moving average, and how price respects the trend line through multiple secondary bases — ideal conditions for adding to a winning position.
Stage 3 – Distribution (Topping Phase)
Every bull run eventually reaches exhaustion. Stage 3 marks the subtle transition from strength to weakness, the point where enthusiasm hides underlying deterioration.
This is often the most deceptive part of the entire market cycle: prices may still look healthy, but the character of the trend has changed.
Key Characteristics
- The long-term moving average flattens, showing that momentum has stalled.
- Price begins to oscillate around the moving average rather than trend cleanly above it.
- Volume expands on down weeks and shrinks on rallies, a clear sign of professional distribution.
- Breakouts fail or fade quickly; relative strength versus the market turns lower.
Investor Psychology
Euphoria reigns. The crowd is fully invested, headlines remain bullish, and analysts project endless upside. But beneath the surface, institutions and insiders are quietly unloading their holdings to late entrants. Confidence and greed mask the early warning signs, and what feels like a “healthy consolidation” is often the first stage of decline.
Trading Strategy
Stage 3 is the time to protect gains, not initiate new positions. Weinstein warned that many traders mistake the sideways action of distribution for a chance to “buy the dip,” when in reality it’s the market rolling over.
Key tactics:
- Tighten stops and take partial profits on extended positions.
- Reduce exposure as volatility rises and the moving average loses slope.
- Rotate to cash or stronger Stage 2 names still in uptrends.
When the long-term moving average turns decisively downward and price begins making lower lows while staying below the moving average, the evidence is clear the uptrend has ended.
Selling pressure dominates, and institutional distribution gives way to liquidation.
A break below key support on heavy volume confirms that the market has entered Stage 4 – the Decline Phase.
“Most investors give back their profits not because they missed the top, but because they refused to recognize that the top was forming.” — Stan Weinstein
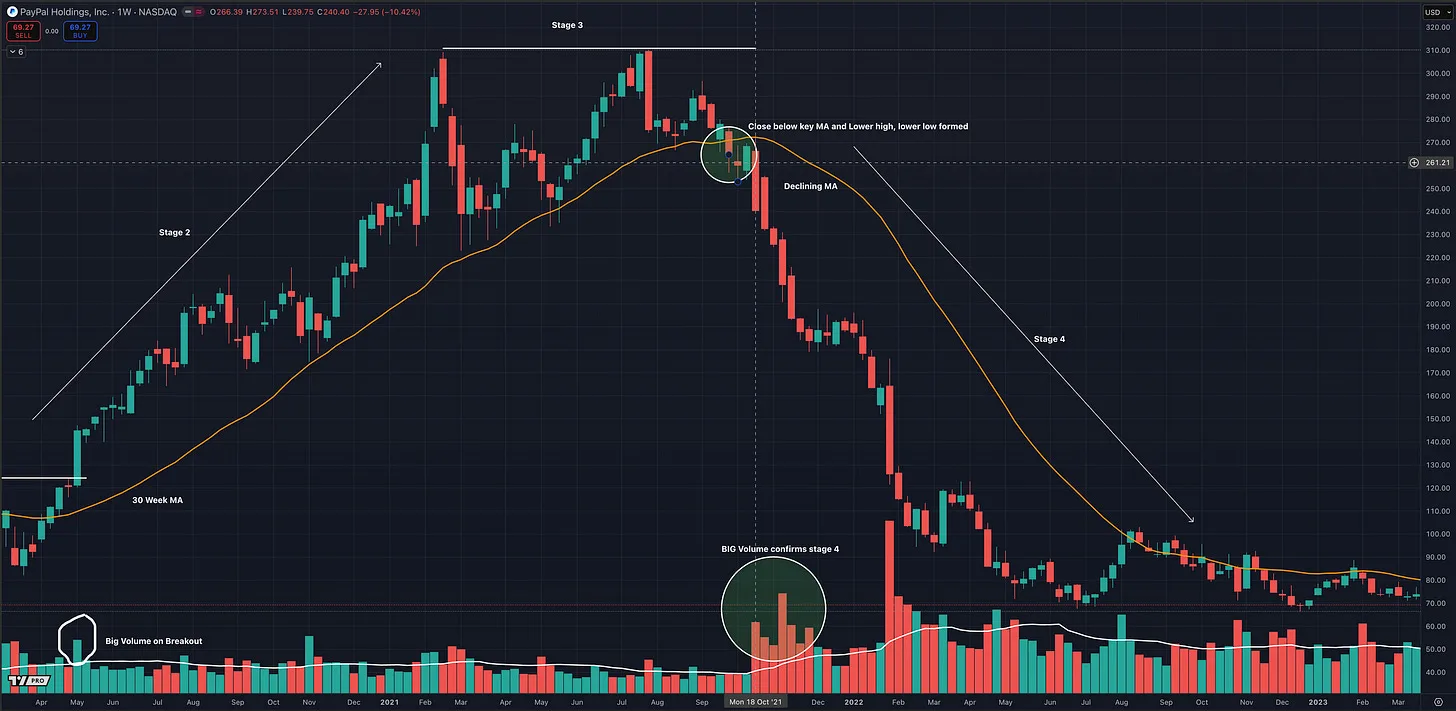
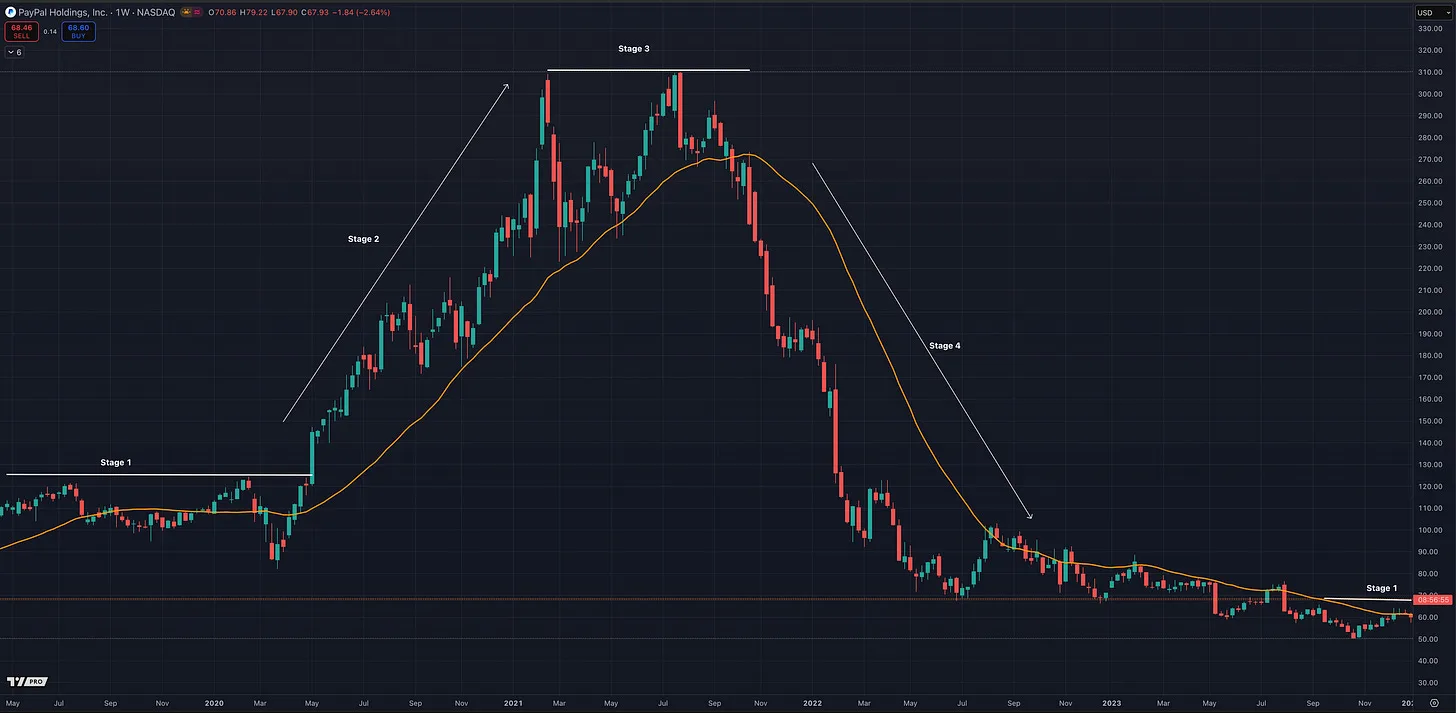
Example: PayPal (PYPL) weekly chart showing the transition from Stage 3 to Stage 4.
Price closes below the long-term moving average, forms lower highs and lower lows, and volume expands sharply on the breakdown — classic signs of institutional liquidation confirming the decline phase.
Stage 4 – Decline (Downtrend)
Stage 4 marks the transition from complacency to capitulation, the bear phase of the market cycle. It begins with a decisive breakdown from the Stage 3 distribution range, confirmed when price closes below the long-term moving average and fails to recover. The once-rising trend now turns downward, and rallies become opportunities for sellers to exit, not buyers to enter.
Key Characteristics
- Price remains below a declining 30-week or 200-day moving average.
- Each rally fails near resistance, often at or just under the moving average.
- Volume surges on declines and dries up during rebounds, classic signs of distribution and liquidation.
- Relative strength plunges, confirming broad weakness versus the market.
Investor Psychology
Stage 4 is driven by denial, fear, and eventually panic. Retail investors hold onto losses, convinced the market will “bounce back,” while professionals continue to sell into every rally. As the decline accelerates, optimism collapses and headlines turn dire.
By the time fear turns to apathy, most participants have capitulated, and ironically, that’s when the seeds of the next Stage 1 base begin to form.
Trading Strategy
Weinstein’s advice during Stage 4 was simple:
“Avoid buying weakness.”
He urged traders to protect capital and remain defensive. For most investors, that means staying in cash until a new base emerges. For advanced traders, shorting rallies back to resistance or using inverse instruments can be effective, but only when done with strict risk control. Stage 4 continues until selling pressure is fully exhausted, volume contracts, and the moving average begins to flatten, the first signal that a new accumulation phase may soon begin.
“The market is never wrong, opinions are.”
— Stan Weinstein
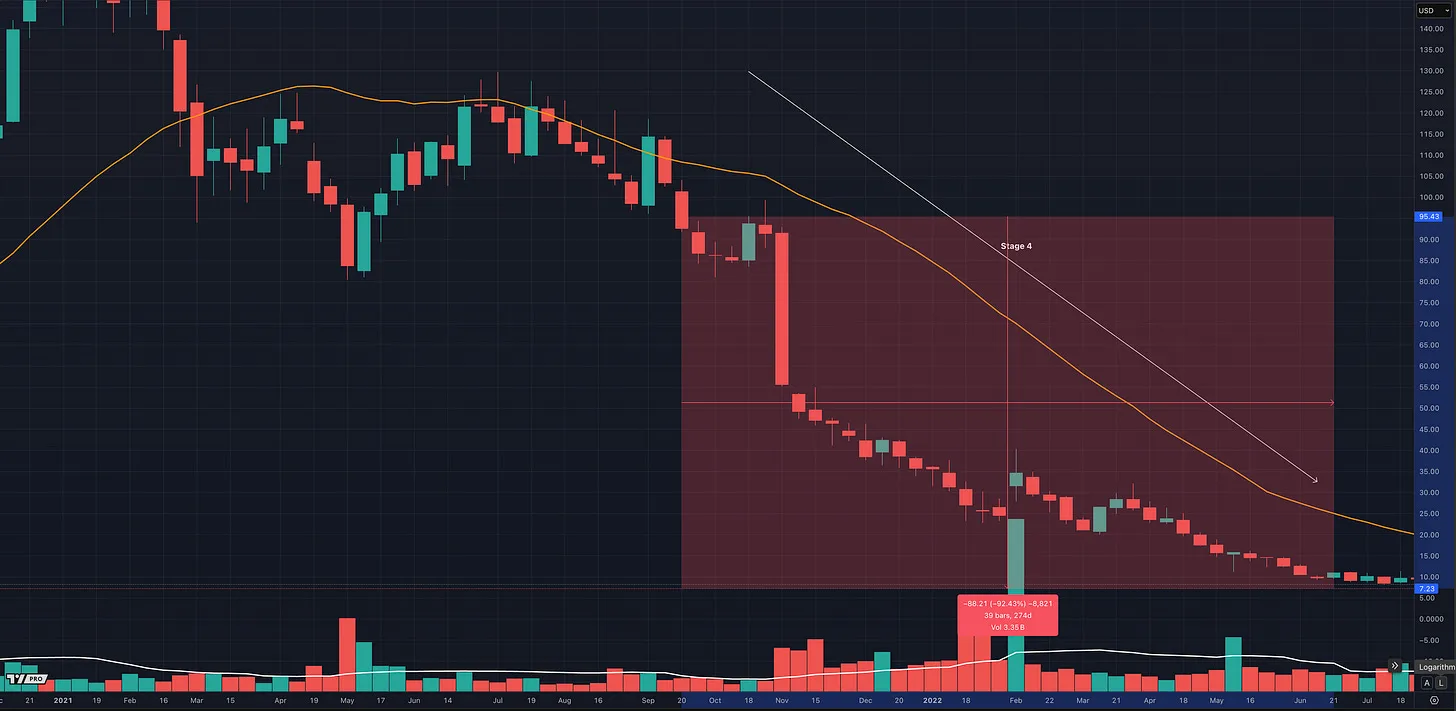
Visual Cue: The Cost of Ignoring Stage 4 Signals
This Peloton (PTON) weekly chart perfectly captures the danger of ignoring Stage 4 breakdowns. Even traders who exited “late” — after price had already fallen below the 30-week moving average, with a declining MA, lower highs, and lower lows, still avoided an additional 90% collapse.
The lesson is simple yet profound:
The goal isn’t to sell at the top, it’s to recognize when the structure has turned against you.
Stage 4 losses are brutal because hope lingers long after the technical damage is done.
By following Weinstein’s rule, respecting the direction of the long-term moving average, traders can step aside early and preserve both capital and confidence.
The Role of the 30-Week Moving Average
One of Stan Weinstein’s most enduring contributions to technical analysis was his use of the 30-week moving average (MA) as a simple, objective tool for identifying market stages.
Before Weinstein, traders often relied heavily on pattern recognition, interpreting head-and-shoulders, triangles, or “gut feel.” Weinstein stripped all that down to a single guiding principle: the slope and relationship of price to the long-term moving average reveal everything you need to know about the market’s health.
The 30-week moving average acts like a trend thermometer, giving traders a quick way to see whether an asset is strong, weak, or transitioning between phases.
How the Moving Average Defines Market Stages
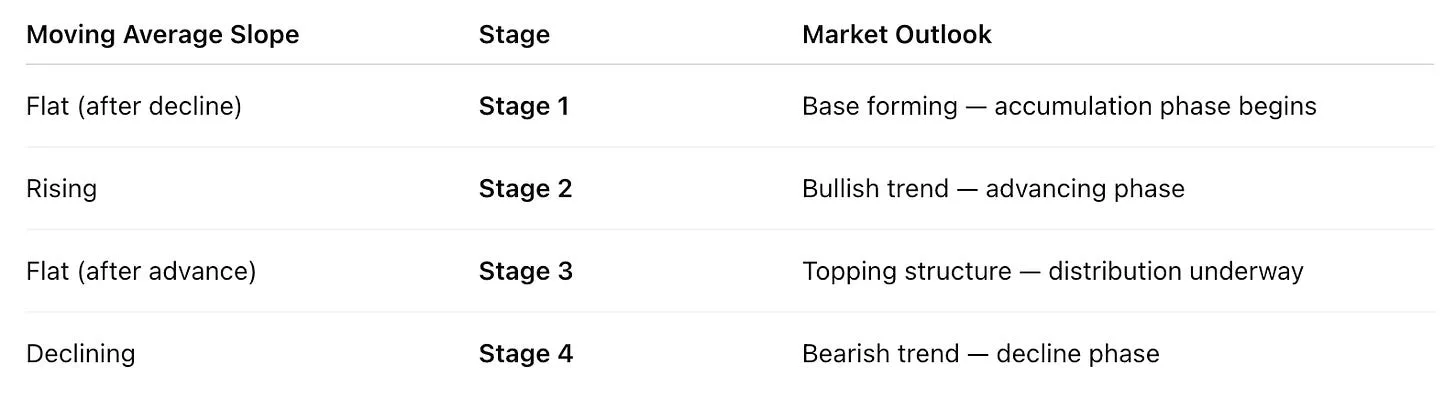
This visual simplicity was powerful. With one glance, traders could assess the direction of the trend and determine the appropriate strategy for that phase: buy, hold, or stand aside.
Why the 30-Week (or 200-Day) Average Works
Weinstein’s original stage analysis was built around the 30-week moving average on weekly charts, which helped smooth out short-term noise and identify the dominant trend. The 200-day moving average is not the exact daily equivalent of the 30-week average. It is closer to a 40-week moving average, but many traders and institutions watch it for the same reason: it provides a widely recognized reference point for long-term trend direction.
The key idea is timeless:
- When price is above a rising long-term average, the path of least resistance is up.
- When price is below a falling average, the trend is down.
There’s no need for prediction, the market itself tells you when conditions change.
The Trader’s Compass
Weinstein referred to this moving average as the trader’s compass, the one line that keeps you oriented in any market environment. It filters out emotional noise and news-driven volatility, giving a clear, unbiased signal of the market’s true direction.
When you trade in harmony with the slope of the moving average, you align yourself with the dominant trend, and that, Weinstein taught, is the only place where consistent profits are made.
Volume and Relative Strength: Confirming the Stage
While price structure and the moving average define a market’s stage, Stan Weinstein emphasized that price alone is never enough. To truly confirm a stage transition and to avoid false breakouts, traders must also analyze volume and relative strength (RS).
Together, these two metrics expose whether an uptrend is being driven by real institutional demand or merely by short-term speculation.
Volume: The Footprints of Smart Money
Weinstein treated volume as the market’s voice, the visible evidence of professional buying and selling.
- Expanding volume on breakouts confirms that institutional players are involved. These surges typically mark the start of a new Stage 2 advance.
- Contracting volume during consolidations signals healthy digestion of prior gains, the market catching its breath before another leg higher.
- Conversely, rising volume on down weeks during Stage 3 and Stage 4 indicates heavy distribution and liquidation smart money exiting while the crowd is still optimistic.
Volume tells traders whether a price move has conviction. Without it, even a technically perfect breakout can fail.
Relative Strength (RS): The Leadership Indicator
Weinstein paired volume analysis with Relative Strength (RS) — a measure of how a stock performs compared to a major market index such as the S&P 500 or NASDAQ.
An upward-trending RS line signals outperformance, the defining trait of true leadership during Stage 2 advances. When the RS line flattens or turns lower, it’s often the first clue that momentum is fading and that Stage 3 distribution may be near.
However, the RS concept extends beyond the line itself. Modern tools such as William O’Neil’s IBD Relative Strength Rating and the Momentum Trading Strategy Relative Strength Stock Screener quantify leadership, ranking stocks on a scale of 1 to 99 based on their price performance over the prior 12 months.
An RS Rating of 90 or higher places a stock in the top 10% of the market, a powerful sign that it’s being accumulated by institutions. When that high RS rating aligns with bullish chart structure, strong price-volume action, and a rising long-term moving average, it gives traders a rare degree of conviction that they’re participating in a genuine Stage 2 leader.
Both Weinstein and O’Neil emphasized the same timeless principle:
True market leadership leaves footprints in both price and relative performance.
It’s not enough to rise with the market, great stocks outperform it.
Working Together: Price + Volume + Relative Strength
When analyzed together, price, volume, and relative strength form a three-dimensional view of market behavior , the complete picture of supply, demand, and leadership.
- Price defines the structure, the stage of the market and the direction of trend.
- Volume validates the strength of participation, revealing whether institutions are actively accumulating or distributing.
- Relative Strength (RS) identifies leadership and underlying momentum, showing whether a stock is outperforming or lagging the broader market.
Weinstein believed this combination gave traders a decisive edge. It helped separate healthy trends supported by real demand from weak rallies likely to fail.
A setup became truly compelling only when all three factors aligned: price above a rising long-term moving average, expanding volume, and strengthening relative strength.
“It’s not about prediction; it’s about confirmation. When price, volume, and relative strength agree, the market is telling you the truth.” — Stan Weinstein
Practical Application: Using Stage Analysis
Stan Weinstein’s genius was in creating a system that anyone could apply with discipline and clarity. Stage Analysis removes guesswork by giving traders a repeatable process built around structure, not prediction.
Here’s how to put it into practice in real markets:
- Identify the stage on the weekly chart using price structure and the 30-week (or 200-day) moving average.
- Is the moving average flat, rising, or declining?
- Is price above or below it?
- These two clues reveal the current stage instantly.
- Use daily charts to refine entries and exits.
- The weekly chart shows the big picture; the daily chart helps you time precise breakouts, pullbacks, or exit signals.
- Trade in harmony with the stage.
- Buy in Stage 2 when price breaks out above resistance with volume confirmation.
- Hold as long as the structure remains intact.
- Exit or short in Stage 4, once price breaks support and the moving average turns down.
- Rotate capital efficiently.
- Move funds from weakening Stage 3 names into fresh Stage 2 breakouts.
- Avoid or short laggards stuck in Stage 4 declines.
Weinstein also emphasized analyzing sectors and major indexes, a stock in Stage 2 within a leading sector often performs far better than an isolated leader in a weak group. This broader perspective ensures you’re trading with market momentum, not against it, aligning your setups with the strongest themes and institutional flows.
This simple framework gives traders a powerful edge: no guessing, no chasing, just structural alignment. By trading in sync with the market’s rhythm, you act alongside institutional money, not against it.
Why Stage Analysis Endures
Stan Weinstein’s Stage Analysis remains timeless because it’s built on market logic, not market prediction. It continues to work across decades, asset classes, and market conditions because it reflects something that never changes, human psychology.
The cycle of fear, hope, greed, and denial repeats endlessly, and Stage Analysis maps that emotional rhythm with remarkable clarity.
Its enduring power lies in its simplicity. Price, volume, and a single long-term moving average, that’s all you need to see the market as it truly is. While tools and technologies evolve, the structure of market behavior does not.
As Weinstein often reminded his readers:
“The market doesn’t change, only the players do.”
More than thirty years after Secrets for Profiting in Bull and Bear Markets was first published, Stage Analysis remains one of the most effective ways to stay aligned with the trend, avoid major losses, and participate in the strongest phases of opportunity.
It’s not about prediction, it’s about recognition. Once you learn to recognize the stages, you’ll never look at a chart the same way again.
Conclusion: The Power of Structure
Stan Weinstein’s Stage Analysis gave traders a framework that cuts through the noise.
It doesn’t try to predict tops or bottoms, it tells you where you are now and what actions fit that phase.
The beauty of this framework is its flexibility. Stage Analysis can be combined with almost any approach, from fundamental investing to momentum or swing trading.
When you pair Weinstein’s structural roadmap with strong fundamentals such as accelerating sales growth, rising earnings per share, and expanding return on equity, you gain powerful confirmation that both the story and the structure align.
A stock breaking out into Stage 2 with institutional volume, rising relative strength, and improving fundamentals offers the highest probability of sustained performance.
This alignment of technical, structural, and fundamental evidence is where conviction begins to replace guesswork.
If you learn to recognize these four stages and discipline yourself to trade in sync with them, you’ll stop fighting the market and start moving with it.
This framework allows you to swim with the current instead of against it.
More in Legendary Traders
All Legendary Traders articles →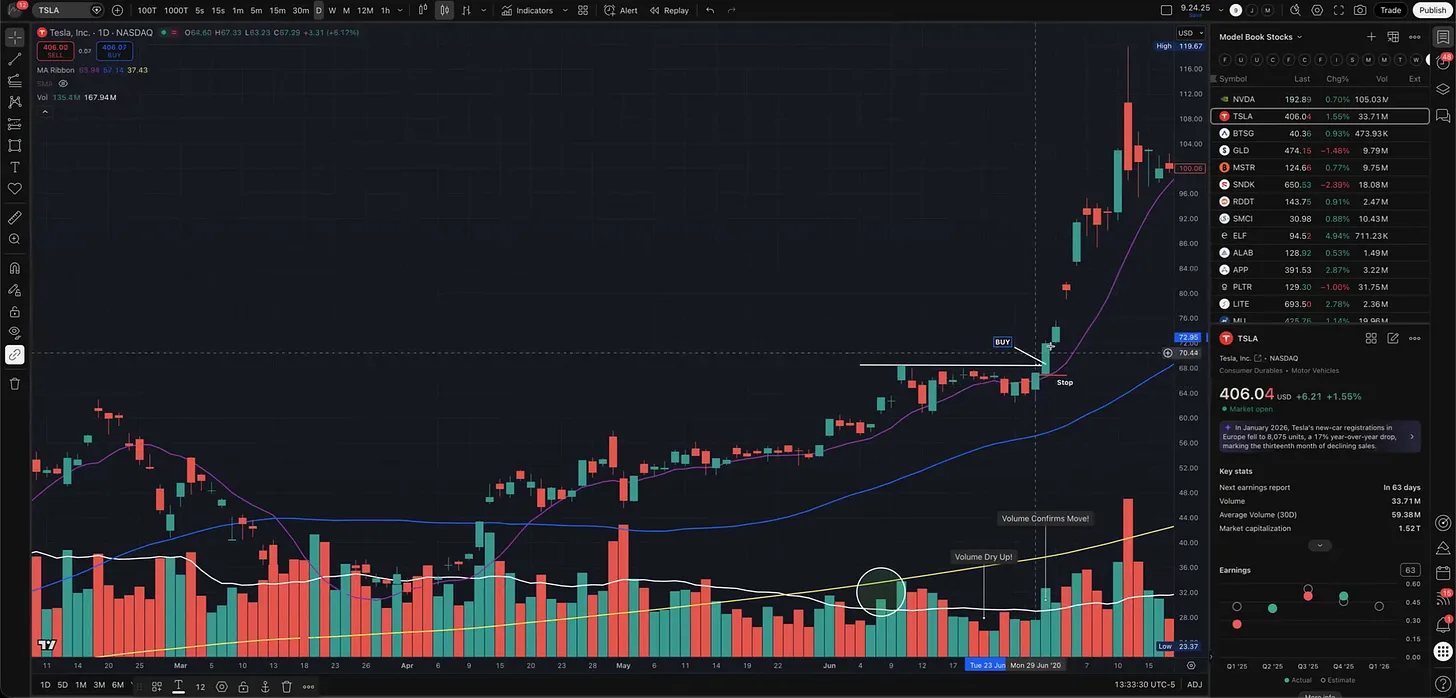
Sep 17, 2026 · Legendary Traders
4 Legendary Traders. 4 Breakout Entry Tactics.
A chart-by-chart breakdown of Minervini’s VCP, O’Neil’s cup with handle, Darvas’s box breakout, and Kullamägi’s opening range breakout.
- how to make money in stocks
- IBD
- Momentum Trading
- VCP
- technical analysis
- CANSLIM
- Trading Setups
- position trading
Sep 6, 2026 · Legendary Traders
Market Wizard David Ryan: How He Made 1,379% in Three Years
Inside the growth-stock approach of William O’Neil’s protégé and three-time U.S. Investing Champion, from precise entries to holding major winners.
- IBD
- fundamental analysis
- Learn Trading
- technical analysis
- position trading
- David Ryan
- Market Wizard
- CAN SLIM
Aug 29, 2026 · Legendary Traders
Why the Market’s Biggest Winning Stocks Rarely Move Alone
Lessons from Nicolas Darvas, William O’Neil, and Mark Minervini on using industry-group strength and relative strength to find new market leaders without getting whipsawed.
- growth stocks
- CANSLIM
- position trading
- David Ryan
- stock trading
- Kristjan Kullamägi
- Nicolas Darvas
- industry groups