Momentum Trading Strategy

Notes

Short lessons on momentum trading, every day.

Every note from Substack, in one place: risk, setups, leading stocks, market conditions and the mindset behind them. Search them, browse by topic, or filter by stock.

Showing 281–300 of 1222 notes

View on Substack ↗

Stop Missing the Move!

Finding the right stocks is only half the battle.

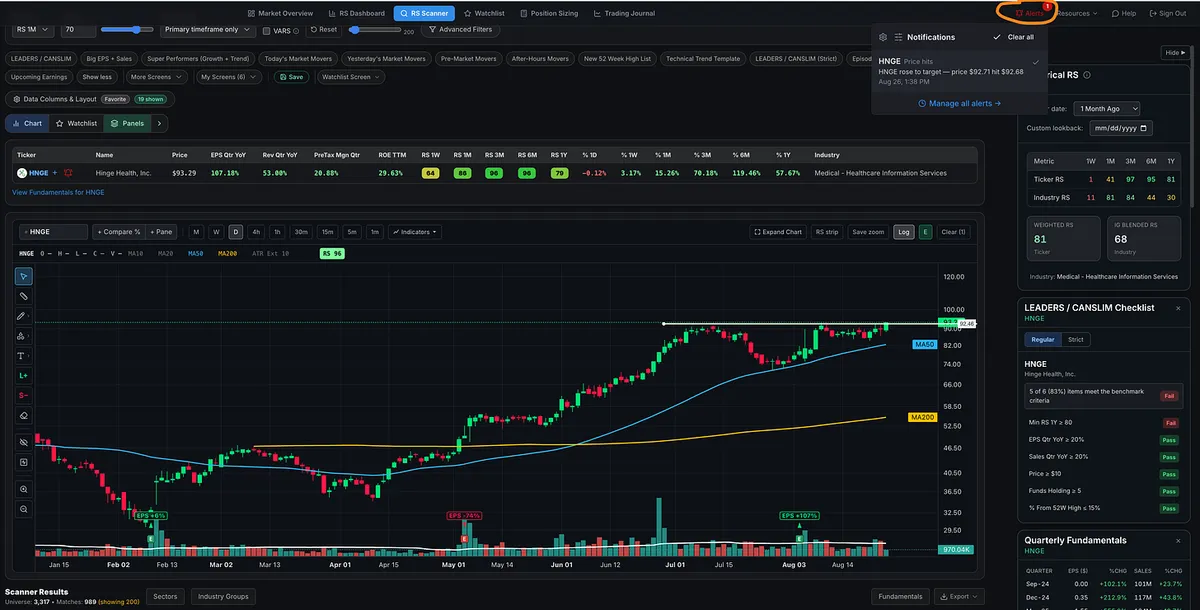
You also need alerts built into your screening process.

If a stock makes your watchlist because it has:

  • Strong Relative Strength

  • Strong earnings and sales

  • A leading industry group

…but hasn’t set up yet with a low-risk, high-reward entry, set the alert before it gets there or as it gets closer.

Because the market doesn’t care if you’re working, driving, at lunch, or looking at another chart.

Some of the best stocks can go from “not ready yet” to “actionable” very quickly.

And there’s nothing worse than opening the chart later and thinking:

“Damn. I missed the move.”

Your job isn’t to stare at 100 charts all day.

Your job is to build a process that tells you when the stocks that matter are becoming actionable.

Screen → Watchlist → Alert → Execute.

Then combine that process with the right order types, such as buy-stop orders, so you don’t have to be staring at the screen when the trigger occurs.

This is exactly why I built the watchlist inside our software around three stages:

Watch → Near Pivot → Actionable

With alerts built directly into the process.

This is one of the biggest mistakes I see newer traders make.

They do the work to find the right stock, but because they don’t have a process for tracking it, they either miss the move entirely or chase it after the stock is already extended.

Finding great stocks matters.

Being ready when they become actionable matters too.

View on Substack ↗

Missed CGAU’s First 65% Move? You Still Had Another Chance.

One of the biggest mistakes traders make is abandoning a winning stock simply because they missed its first breakout.

CGAU is a perfect example.

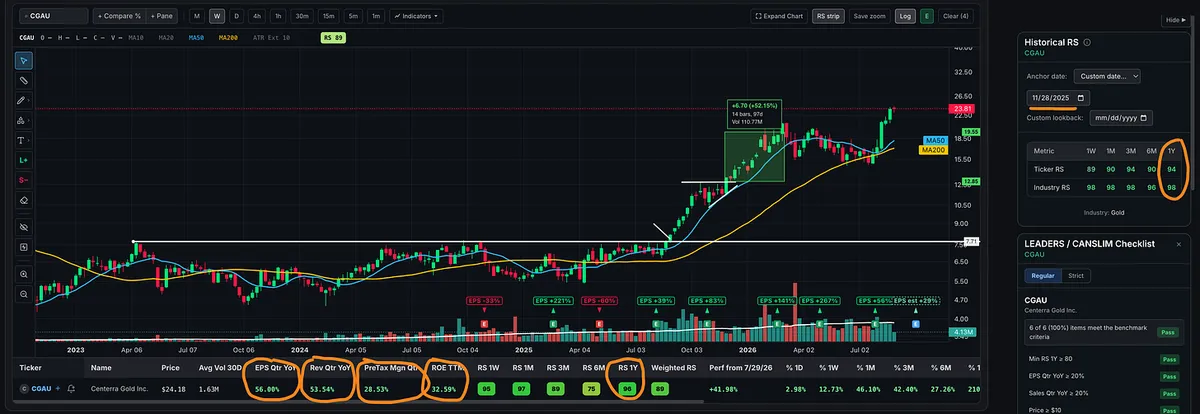
The stock spent years building a large base. As it moved up the right side, price began tightening before finally breaking out during the week of August 29, 2025.

It then ran higher for eight consecutive weeks, gaining approximately 65%.

Missed it?

You didn’t need to chase.

CGAU then moved sideways and tightened for roughly six weeks. The lows continued rising, Relative Strength remained extremely strong, and the stock eventually broke through its prior high during the week of November 28.

That second breakout produced another gain of approximately 50%.

Sometimes the second setup can be even more attractive because the stock has already proven itself:

✅ A powerful initial move on volume

✅ Strong Relative Strength

✅ Big earnings and sales growth

✅ Expanding margins and strong ROE

✅ Increasing institutional ownership

✅ Strength across the metals and mining group

CGAU has recently been appearing on our MTS Velocity stock screens again as metals and mining continue to outperform, something we’ve also been covering in the Big Picture Market Pulse.

Big winners rarely move straight up.

They break out. They advance. They rest and tighten. Then they often offer another opportunity.

Missing the first breakout doesn’t mean you missed the entire move.

View on Substack ↗

We Didn’t Find CDNA After the Breakout. We Were Watching It Before. 👀

On August 6, I shared a list of medical, pharmaceutical, biotech, and healthcare stocks we were watching inside the MTS Community.

CDNA was on it.

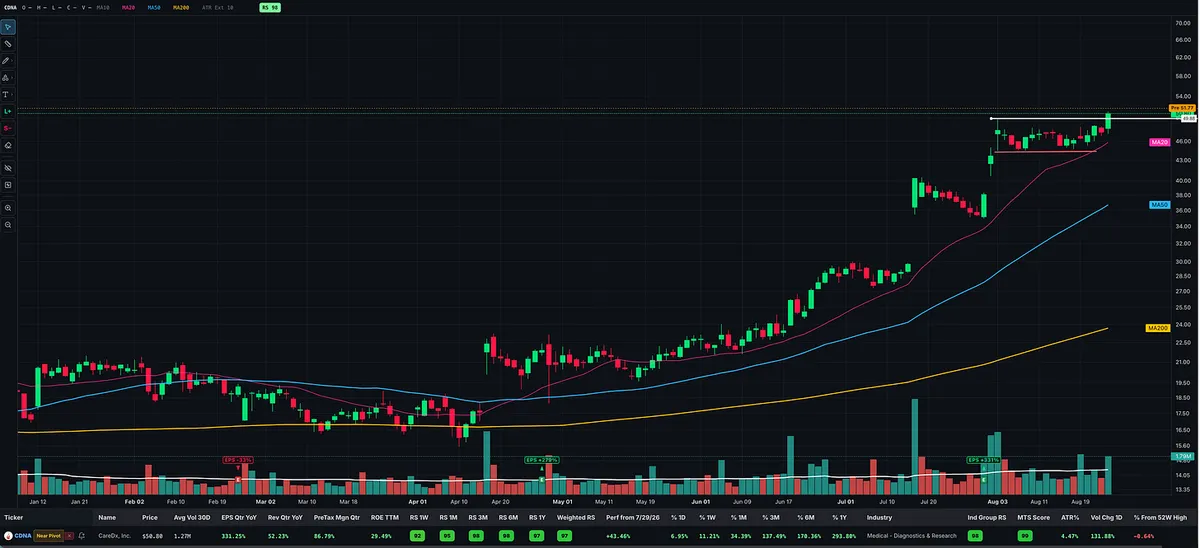
We originally spotted the stock using the MTS Velocity screener, and the numbers made it difficult to ignore:

• EPS growth: +331%

• Sales growth: +52%

• Pretax margin: 86.8%

• ROE: 29.5%

• Relative Strength: 98

• Industry Group RS: 98

After its earnings run, CDNA pulled back constructively on much lower volume.

Then volume began returning on August 19.

Yesterday, it broke out.

Now it’s continuing higher in pre-market trading. 🚀

While much of the market remained focused on the same AI stocks that had stopped leading, relative strength was pointing toward healthcare and biotech.

Most people notice a stock after the breakout candle appears.

The real work happens before it.

MTS Velocity found the stock. The MTS Trading Room tracked the setup. Price and volume confirmed the opportunity.

Screen. Study. Prepare. Then let the stock prove you right.

View on Substack ↗

I Screened the Entire Market Using MTS Velocity. HNGE Survived. 👀

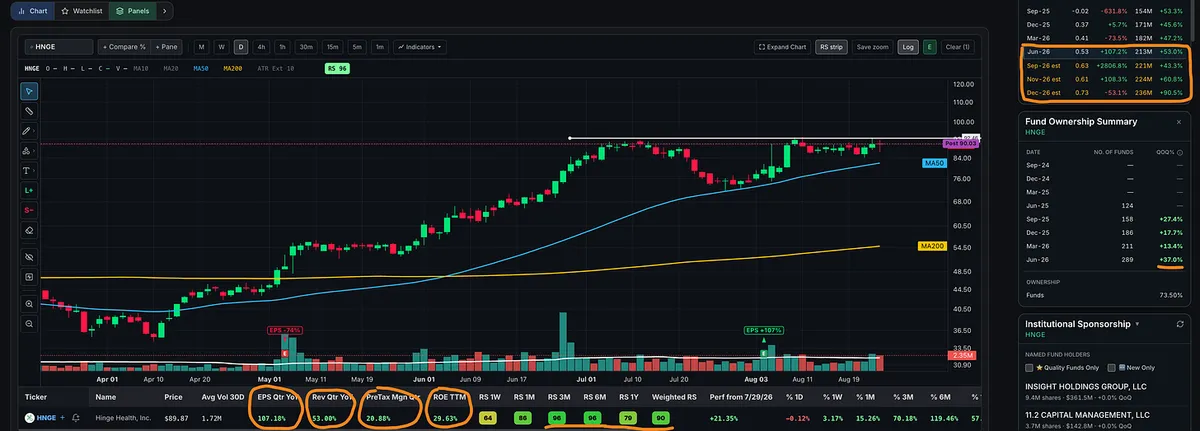
One of the stocks that made it through:

HNGE

• EPS growth: +107%

• Sales growth: +53%

• Pretax margin: 20.9%

• ROE: 29.6%

• High Relative Strength

• Funds owning shares: 124 → 289 in one year

And now the stock is tightening near its highs above rising 50-day and 200-day moving averages.

Thousands of stocks. One screen. Hello, HNGE. 👀

View on Substack ↗

This May Be the Most Important Trading Article I’ve Ever Written. It May Also Be the Least Popular.

I would not be surprised if this article gets fewer likes, comments, and reads than almost anything else I publish.

That is also part of the problem.

Everyone wants the setup, the stock, the screen, the entry, or the next big market call. Far fewer traders are willing to do the harder work of understanding themselves, building a process they can actually follow, and confronting the behaviors that quietly destroy otherwise profitable systems.

Richard Dennis, Paul Tudor Jones, Ed Seykota, Larry Hite, and Van Tharp all understood this in different ways.

If you are serious about succeeding in trading for the long run, I think this is one of the most important things you can understand.

Read it here:https://tradingmomentum.substack.com/p/why-most-traders-fail-even-with-a

ArticleWhy Most Traders Fail Even With a Winning System: The Edge Almost Everyone Ignores
View on Substack ↗

Most Traders Press the Gas at Exactly the Wrong Time

I see this cycle play out over and over again.

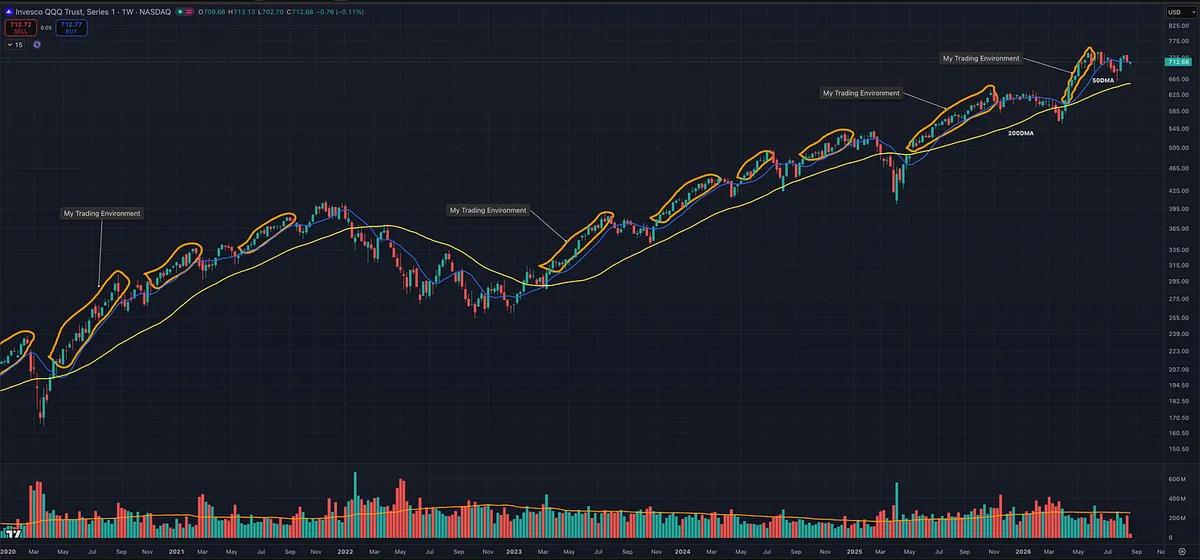
The circled areas on this chart show the environments when traders should be pressing the gas.

The market is in a clean uptrend. Week after week, it is making higher highs and higher lows. Price is at all-time highs and above both the 50-day and 200-day simple moving averages. This is a weekly chart with the daily moving averages plotted.

Yet this is when many beginners hesitate.

They miss the move, are afraid to enter, or simply lack the experience to recognize when the odds are in their favor.

Then the environment changes.

Price action becomes more difficult, and suddenly they are desperately searching for stocks and forcing activity. They are trying to make up for the move they already missed.

Eventually, the difficult period wears them out. Many traders are at that point right now.

Then the next uptrend begins.

They are too frustrated, exhausted, or afraid to capitalize on it. Their confidence and excitement only return after the move has already progressed, usually near the end.

Then the entire cycle repeats.

Pressing the gas does not mean abandoning risk management. It means progressively increasing exposure when the market is rewarding you and pulling back when it is not.

Let the market environment determine your exposure, not boredom, fear, regret, or the need for activity.

View on Substack ↗

Most Traders Love the Wrong Part of Trading

One of the shortest answers in Market Wizards may also be one of the most important.

Ed Seykota was asked:

“What traits do you look for to identify the winning trader personality?”

His response:

“1. He/she loves to trade; and 2. He/she loves to win.”

Most people love the idea of trading.

The money. The freedom. The excitement.

Far fewer love the actual process: studying, preparing, managing risk, following rules, and constantly improving.

Winning traders love the game, but they also love winning enough to do what the game requires.

Simple answer. Brutally accurate.

View on Substack ↗

The Best Swing Trades Look Like This Before They Explode

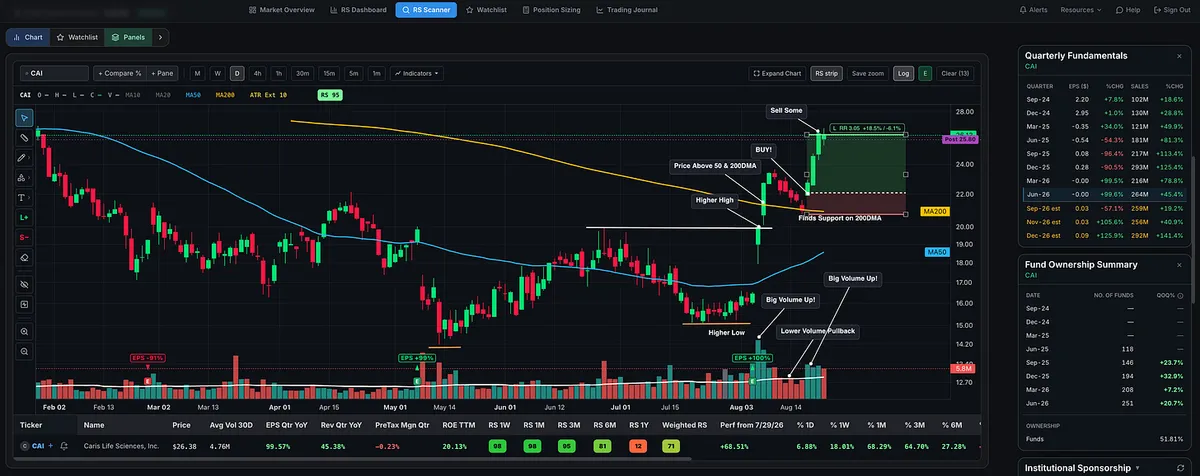
Study this chart.

CAI is a great example of what can happen when industry strength, price action, volume, fundamentals, and risk management all align to create a low-risk, high-reward swing-trading setup.

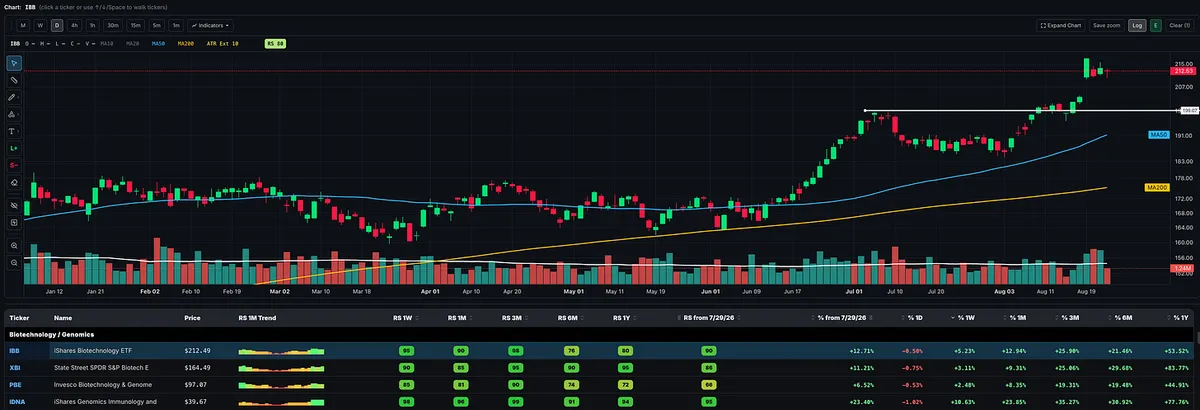
Biotech had a strong run in June. IBB then spent July building a base, formed a handle near its highs in August, and broke out to new highs.

While the industry group was confirming its strength, CAI was setting up.

  1. Character change: The stock established a higher low followed by a higher high. That higher high confirmed the higher low and signaled the character change I look for.

  2. Volume and growth fundamentals: Around earnings, volume expanded dramatically, quarterly sales grew 45%, and price moved back above both the 50-day and 200-day moving averages.

  3. Low-volume pullback: CAI pulled back on declining volume almost perfectly to the 200-day moving average and found support.

  4. Entry: The following day, it gapped higher on increasing volume, providing an entry near the open on August 19.

  5. Clearly defined risk: You could have placed a very tight stop below the low of the entry day. My preferred stop was below the higher low, the 200-day moving average, and the low of the pullback.

  6. Sell into strength: Once the stock reached a multiple of the initial risk, you could sell some into strength to help finance the trade, protect your principal, and give the remaining shares room to capture a potentially larger move.

That is what low risk really means.

It does not mean the trade cannot fail. It means you know exactly where you are wrong, while the characteristics of the setup offer significantly more potential reward than what you are risking.

Even the wider technical stop required less than 6% risk. Within only a few days, CAI had gained approximately 18%, or three times the initial risk. That created an ideal opportunity to sell some into strength while allowing the remaining position more room.

The fundamentals also supported the setup:

  • Sales growth of approximately 45%

  • ROE above 20%

  • The number of funds owning shares more than doubling over the past year

  • Improving forward estimates

  • One-month RS of 98

  • Three-month RS of 95

CAI does not fully meet my longer-term position-trading criteria, particularly because its one-year relative strength remains weak. But for a swing trade, it fits extremely well.

This is why traders like Kristjan Kullamägi focus on the market’s strongest performers over the previous one, three, or six months.

Strong industry group. Character change. Massive volume. A lower-volume pullback. Support at a key moving average. A clear entry and clearly defined risk.

Study these characteristics.

View on Substack ↗

What Does a Confirmed Uptrend Look Like?

A strong move off the lows does not automatically mean a new uptrend has begun.

When I’m looking for confirmation that a stock has transitioned into a Stage 2 uptrend, I want to see a few things:

• Price above the 50-day and 200-day moving averages

• The 50-day above the 200-day

• Both moving averages flattening and trending higher

• A clear sequence of higher highs and higher lows

• Strong relative strength

• Strong volume on the advances and lighter volume on constructive pullbacks

Think of it like a staircase: higher high, higher low, higher high, higher low.

This is similar to the framework behind Mark Minervini’s Trend Template, which he uses to filter for stocks that have already established a confirmed Stage 2 uptrend.

But this is important:

A confirmed uptrend is not a buy signal. It’s a filter.

Once a stock is in the right trend, I still want to wait for a proper setup, something like a VCP, cup with handle, tight consolidation, flat base, or constructive pullback, that gives me a clearly defined entry and favorable risk-to-reward.

Trend first. Setup second. Entry third. Risk defined before the trade.

Let the stock prove the trend has changed and then wait for my opportunity.

For anyone using the MTS Velocity RS Scanner / Stock Screener, we also have the Trend Template built directly into the screener, making it easy to filter for stocks meeting those Stage 2 trend criteria.

View on Substack ↗

When Low Short-Term Relative Strength Is Actually Bullish (Most Traders Get This Wrong)

A lot of traders misunderstand what they’re seeing when they sort stocks by Relative Strength.

When a stock is ripping higher, you’ll usually see strong RS across nearly every timeframe: 1-year, 6-month, 3-month, 1-month, even 1-week.

But that’s also usually when everyone starts saying:

“It’s too extended.”

The more interesting opportunity can appear when a major leader finally starts to consolidate.

In this SNDK example, the stock still had elite longer-term Relative Strength, but its shorter-term RS started falling as price consolidated, found support, volume dried up, and higher lows began forming.

At first glance, that weaker short-term RS might look bearish.

But in the right context, it can be exactly the opposite.

It can be telling you that a powerful leader has finally stopped running long enough to build another potential buying opportunity.

That’s the part many traders miss.

But there’s a catch.

The exact same RS relationship can also appear when a former leader is actually breaking down.

If price loses important moving averages, fails to reclaim them, starts making lower lows, and the overall chart deteriorates, then falling short-term RS may be confirming that the stock’s leadership is ending.

Same Relative Strength readings. Completely different message.

That’s why I never use Relative Strength in isolation.

A screener can help me find the stock.

Price, volume, trend, and the chart tell me what the RS actually means.

This clip comes from a longer video where I walk through some of the exact stock screens I personally use inside MTS Velocity, including how I combine different Relative Strength timeframes, fundamentals, volume, trend, and market context to narrow thousands of stocks down to the names I actually want to study.

The full video and MTS Velocity Stock Screener are available to all paid subscribers.

Watch the video on Substack →
View on Substack ↗

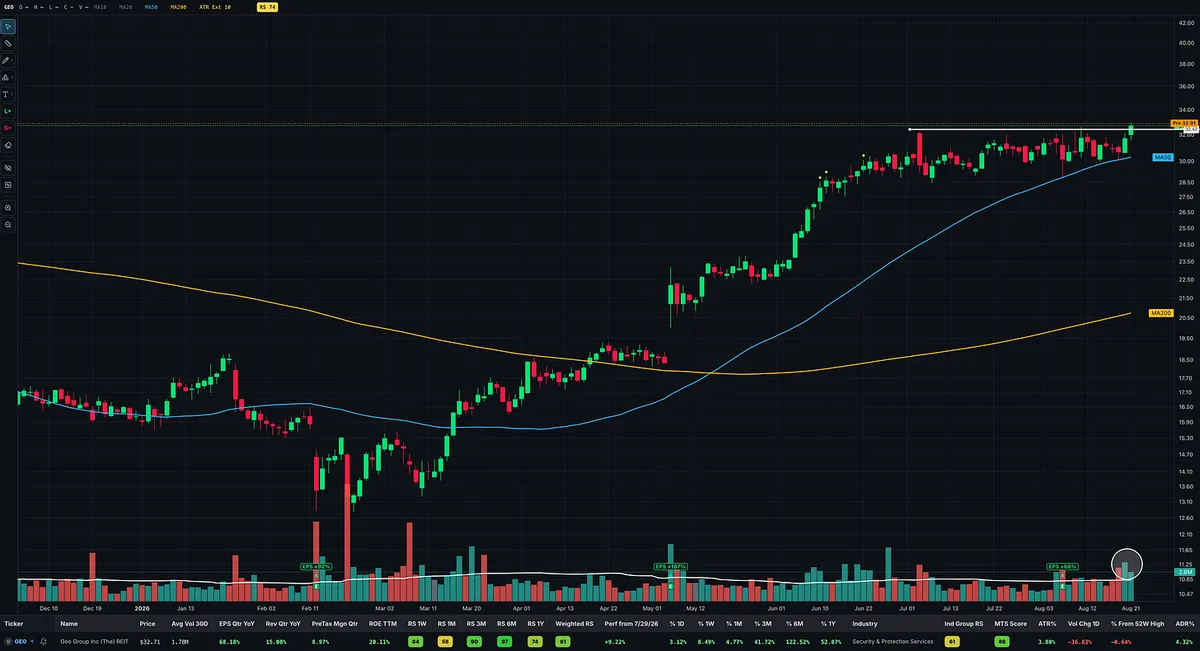
GEO 👀 Now THAT’S a Nice-Looking Flat Base Breakout

This is the type of setup I like to see.

GEO found support right around the rising 50-day moving average, spent several weeks tightening up near the highs, and is now pushing through the top of a clean flat base into new highs.

Even better, earnings are already out of the way, removing one major piece of event risk.

Nice support at the 50-day. Tight price action. Defined breakout level. New highs.

Nice setup.

View on Substack ↗

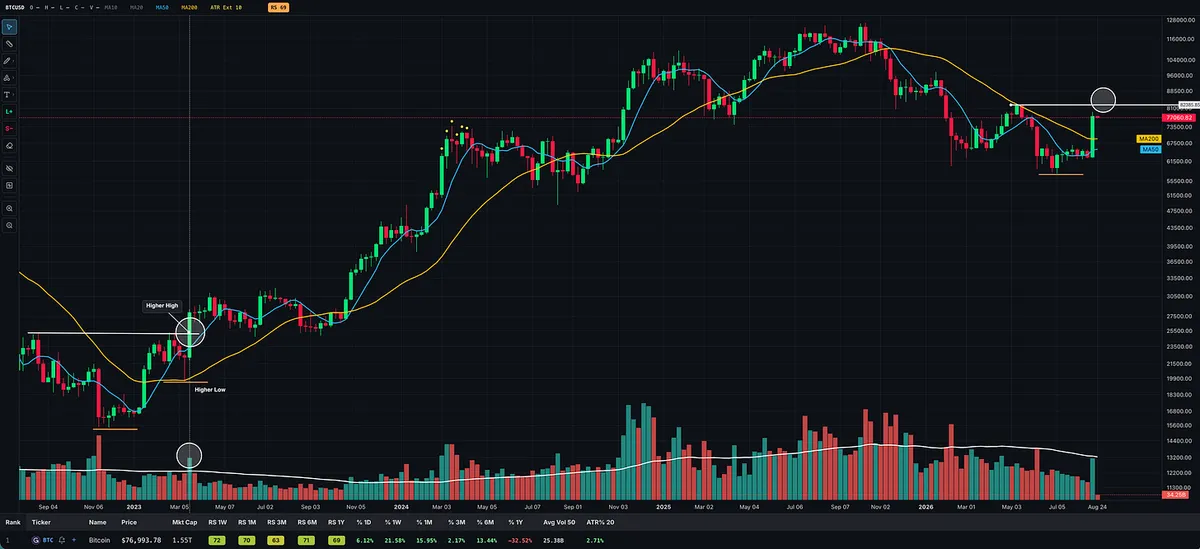
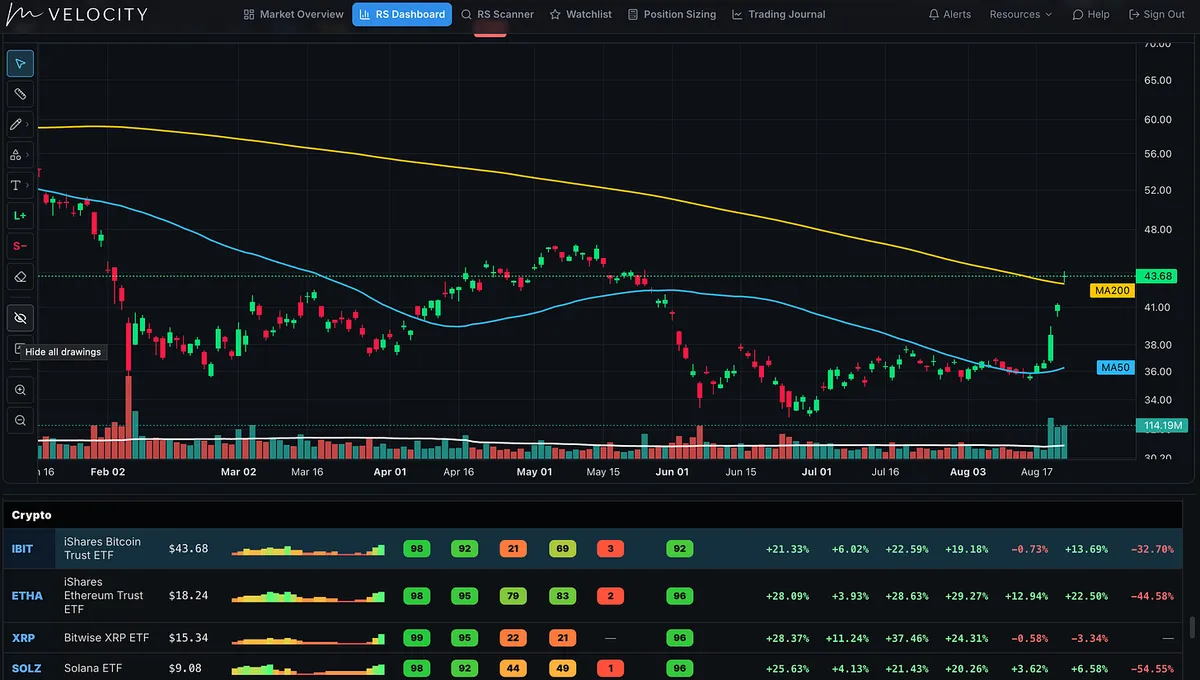
Look at Bitcoin and Crypto Go 👀🚀

BTC is working toward showing the kind of character change I’ve been waiting to see.

Price is now back above the 200-day moving average, something we haven’t seen since the topping process began last fall.

From here, I’d actually prefer to see a pullback and consolidation rather than price just running straight up. Ideally, BTC establishes a higher low, similar to what we saw in 2023, and then turns higher to break out to a new high.

That would also give the 50-day moving average time to rise back above the 200-day, while allowing the 200-day to flatten out and eventually start trending higher.

Higher high. Higher low.

Price above the 200-day.

50-day crossing back above the 200-day.

200-day turning higher.

That’s the character change I’m looking for.

Crypto is getting interesting again. 👀

$BTC

View on Substack ↗

Stop “Personalizing” a Proven Trading System Until You Understand What You’re Actually Doing

When you enter the markets, you really have two paths.

You can master a proven system, or you can become an inventor and build one yourself.

There is nothing wrong with either path.

The problem is when traders think they are doing the first while slowly drifting into the second.

Look at the lineage of growth-stock momentum trading.

William O’Neil influenced traders like David Ryan, Mark Minervini, and Dan Zanger. Then newer generations studied O’Neil while also learning from Minervini, Ryan, Zanger, and others.

Generation after generation, the core principles get passed down.

Each trader puts some of their own personality into it.

One trader tolerates a slightly larger drawdown. Another prefers tighter stops. One favors VCPs. Another gravitates toward cup-with-handle breakouts, flags, earnings gaps, or other setups. Their position sizing and trade management may differ around the edges.

But the meat and potatoes of the system remain intact.

This happens everywhere, not just in trading.

Most successful businesses did not invent an entirely new category from scratch.

They entered an existing market and executed better.

Maybe they built a stronger brand.

Maybe they offered better customer service.

Maybe they improved pricing, distribution, product quality, marketing, convenience, or the overall customer experience.

They did not necessarily reinvent the wheel.

They took something that already worked and found a way to execute it better or make it their own.

Then, every once in a while, someone truly invents something revolutionary.

That happens too.

But being an inventor is a completely different job.

Trading is no different.

If you want to invent your own methodology, great.

But understand what that actually requires.

Years of market observation.

Research.

Backtesting.

Forward testing.

Iteration.

Failures.

Data.

And enough evidence to determine whether your changes actually produce an edge. 

That is very different from learning a proven methodology and then changing rule after rule because something feels uncomfortable.

This is where I think many traders get into trouble.

They hear:

“You have to make the system fit your personality.” or "You have to develop your own system."

And that is true.

But there is a very fine line between personalizing a proven system and becoming an inventor.

You change the entry criteria.

Then the fundamental requirements.

Then the relative-strength requirements.

Then the market-timing rules.

Then the risk management.

Then the sell rules.

Then the setups.

Eventually, very little remains of the methodology you originally decided to learn.

At that point, you are no longer simply modeling a system that already works.

You are designing a new one.

And if you are going to enter the territory of an inventor, you need to apply the same level of research and rigor an inventor would.

Otherwise, you can end up in the worst possible place.

You are not mastering the proven system, but you are also not doing enough research to validate the new system you are creating.

You have neither.

Then when the results deteriorate, the conclusion becomes:

“O’Neil doesn’t work anymore.”

“Minervini’s system doesn’t work in today’s market.”

Maybe.

But first ask yourself a much harder question:

Are you even trading their system anymore?

There is nothing wrong with mastering.

There is nothing wrong with inventing.

Just understand which one you are doing.

Because sometimes the edge didn’t disappear.

You slowly changed the system until you changed the edge.

View on Substack ↗

Dan Zanger Studied the Same Playbook

Dan Zanger points directly to William O’Neil’s How to Make Money in Stocks as one of the books he studied repeatedly while learning to trade.

After years of reading it alongside other classic trading books and applying those lessons to real-time charts, Zanger said:

“Things started to gel for me.”

And when you look at what Zanger searches for, the overlap with O’Neil is obvious:

Leading stocks with high relative strength.

Strong price action.

Heavy volume.

Big earnings.

Strong sales growth.

Classic chart patterns.

But Zanger’s story also reinforces the part traders often overlook:

Knowledge means very little without discipline.

The principles have been around for decades.

As Zanger puts it, you need the “fortitude to stick to the rules.”

Knowing the system is one thing. Having the discipline to actually follow it is what makes the difference.

View on Substack ↗

“If I Screen for High RS, Won’t I Find the Stock After It’s Already Moved?”

This is one of the biggest questions I hear about Relative Strength.

A lot of traders assume that if they screen for stocks with high RS, they’ll be too late.

The thinking goes something like this:

“By the time a stock has a high RS Rating, hasn’t it already made the move? Won’t I miss the setup and breakout?”

But that is exactly what William O’Neil’s research showed was often NOT the case.

From the early 1950s through 2008, the average RS Rating of the best-performing stocks before their major run-ups was 87.

O’Neil went even further and said the really big moneymakers generally had RS Ratings of 90 or higher just before breaking out of their first or second base structure.

That’s the key.

Just before the breakout.

Not after the huge move.

Before it.

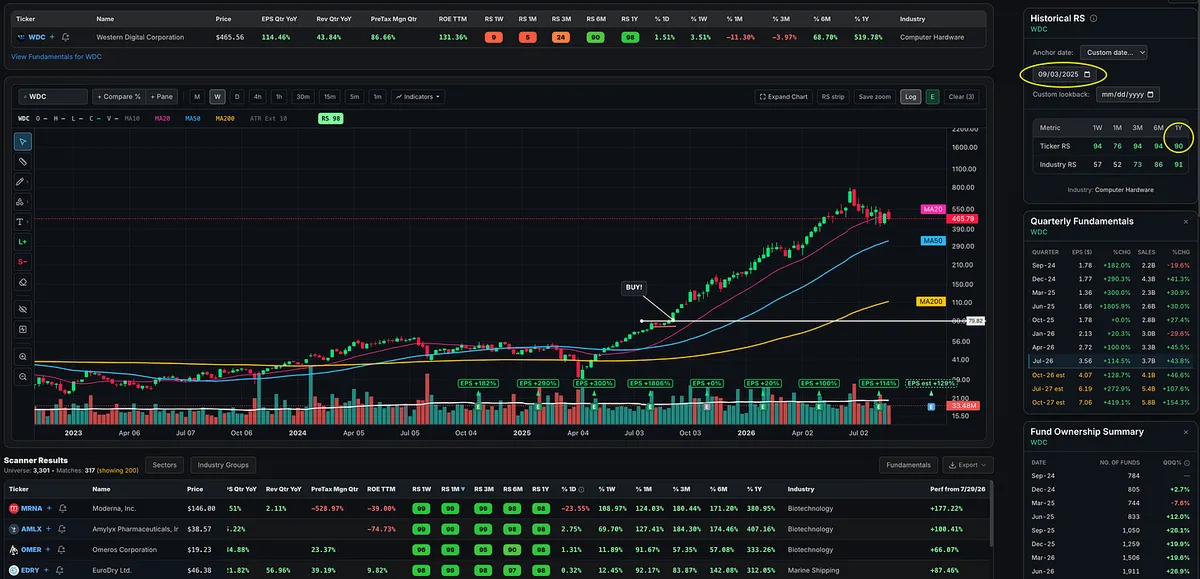
WDC is a great example.

Look at the setup in the chart.

WDC had already made a strong advance, then tightened up and formed a very attractive low-risk, high-reward setup.

Using the Historical RS feature in MTS Velocity, I can go back to that exact date and ask:

What was WDC’s one-year Relative Strength Rating before the breakout?

The answer:

90.

It already had a 90 RS Rating while the setup was sitting there.

Then WDC broke out and eventually advanced more than 800% from that area at its peak.

That is the distinction people sometimes miss.

WDC didn’t get a high RS Rating because of the 800% move.

It already had high RS before the 800% move happened.

That is exactly what O’Neil was talking about.

And remember, O’Neil’s RS Rating measures a stock’s price performance against the market over the previous 52 weeks, which is why the one-year RS is the standard measurement here.

My Relative Strength universe is also stricter because I only rank the stocks I’m actually willing to trade. That means WDC’s RS Rating would likely have been even higher in IBD or MarketSurge, which rank against a broader universe.

So a 90 RS inside MTS Velocity is already competing against a relatively strong, tradeable universe.

This is one of the reasons I built Historical RS.

Instead of debating whether high RS means you’re already too late, you can go back to virtually any major winner, set the date to the setup or breakout, and see for yourself.

What was the RS before the move?

WDC: 90.

Then came the 800%+ run.

That’s the point.

View on Substack ↗

The Market Movers Have Looked Very Different All Week

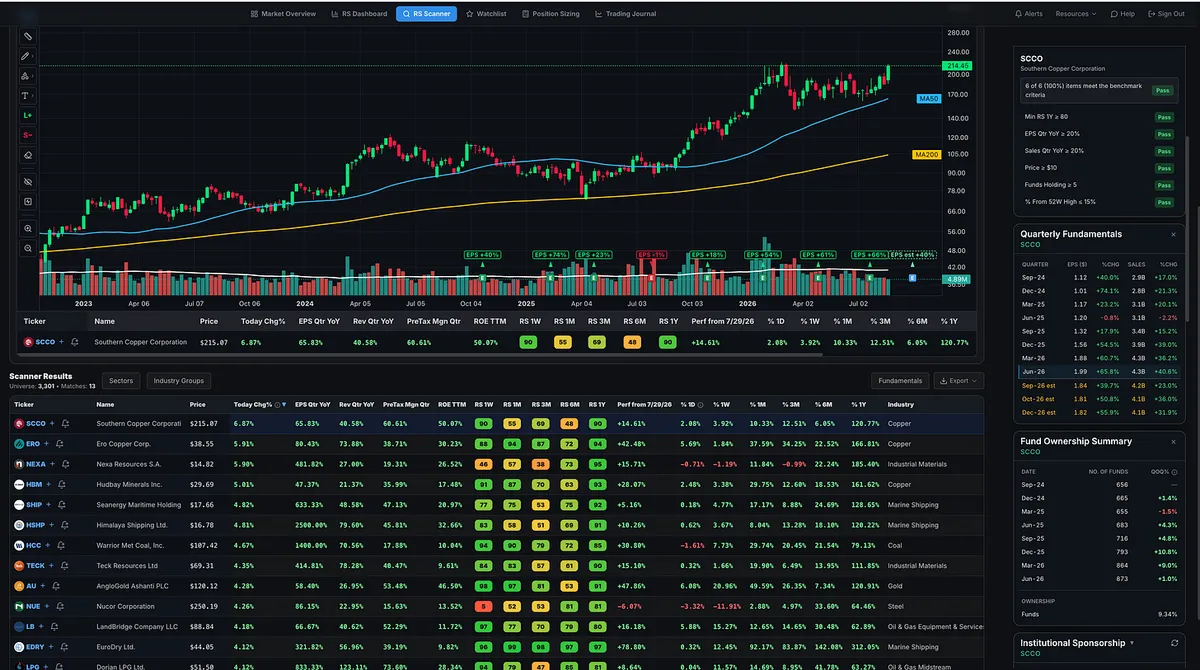
I’m looking at today’s biggest market movers, then running my growth scan and layering in the stocks with the biggest earnings and sales growth.

The picture looks very different from what we’ve become accustomed to seeing.

And it hasn’t just been today.

It’s been happening all week.

View on Substack ↗

The Best Way to Hold a Winner Longer? Sell Some of It.

That may sound backward, but it is one of the best lessons I learned from Mark Minervini after first learning the basics from William O’Neil.

In Trade Like a Stock Market Wizard and Think & Trade Like a Champion, Minervini explains how the priorities of a trade should change as it progresses:

  1. Limit the loss.

  2. Protect the break-even point.

  3. Protect the profit.

Once a stock advances multiples of your initial risk, one option is to sell part of the position and protect break-even on the remaining shares.

Minervini refers to this as a “free roll,” because the profit taken on the first portion can finance the risk on the rest of the trade.

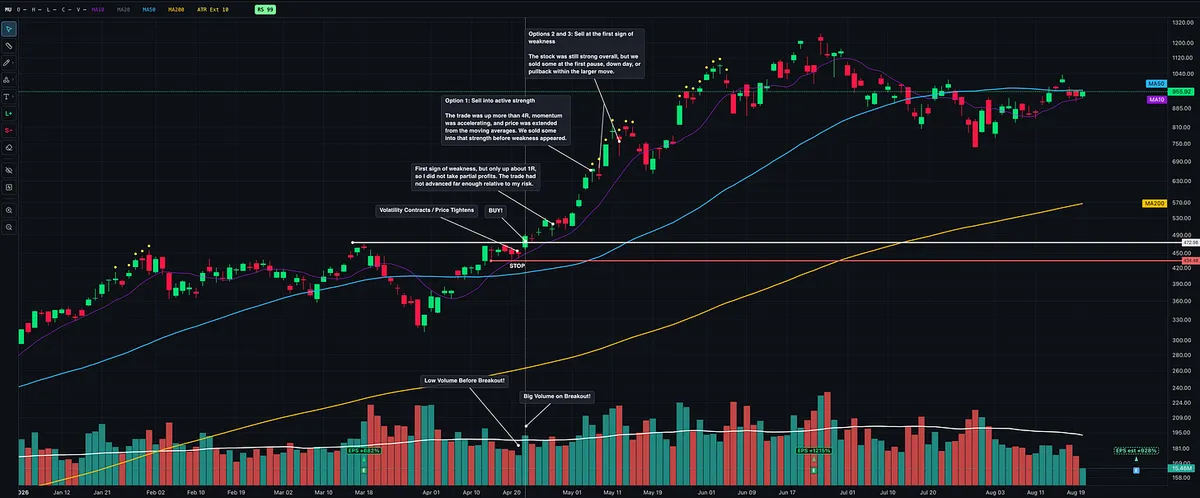
However, I do not automatically sell just because a stock reaches 2R or 3R. There are two ways I may take partial profits after a powerful advance.

The first is selling into active strength.

If a stock is advancing normally, or surges into a rapid move with powerful momentum, I may sell some while it is actively moving higher. I am not trying to guess the top. The stock will often continue rising after I sell some, and that is perfectly fine.

The second is selling at the first sign of weakness following a powerful advance.

If it is an exceptionally fast-moving stock and I am already up three times my risk or more, I may let it continue running as long as possible. Once the momentum begins to cool, I may sell some during the first down day, the beginning of the first pullback, or the first sideways consolidation.

In Minervini’s terminology, the first method is selling into strength and the second is selling into weakness. However, both involve taking profits while the stock remains in a position of strength overall. I am not waiting for a major breakdown or serious technical damage.

Plenty of extremely successful traders manage positions differently. Some focus more on adding to their winners and holding the entire position through deeper pullbacks. That works too.

But taking partial profits and then protecting break-even is what has worked best for me.

I like getting into a position where my original principal is protected and I am managing the remaining position with profits already locked in. Even if the stock comes all the way back to my stop, I can still walk away with a small winner.

But the small profit is not the biggest benefit.

The biggest benefit is the patience and clarity it gives me.

Once I have sold some and protected my break-even point, I am far less tempted to react to every small intraday move or normal daily pullback. Even if I entered using an intraday or daily chart, I can shift my attention to the weekly chart, filter out the noise, and give the larger trend room to develop.

That makes it much easier to stay with a true market leader long enough for it to become a major winner.

The key is not to move the stop to break-even too quickly. The trade must first earn that adjustment by producing a meaningful gain. Otherwise, you risk choking off a perfectly healthy position before it has enough room to work.

One final point: taking partial profits does not mean I never add to the position again.

If the stock continues working, makes higher highs and higher lows on the larger timeframe, and forms another constructive consolidation or base, I may add shares back as it turns higher or triggers another entry.

The profits already locked in can help finance the risk on those additional shares.

Minervini describes a similar technique as “Add and Reduce.” More broadly, many growth stock traders refer to this as trading around a core position.

Selling part of a position does not mean losing conviction in the stock. It means actively managing risk while preserving the opportunity for a much larger gain.

Sometimes selling a little sooner is exactly what allows you to hold the real winner much longer.

View on Substack ↗

ETON: A Growth Name I’m Watching for a Pullback

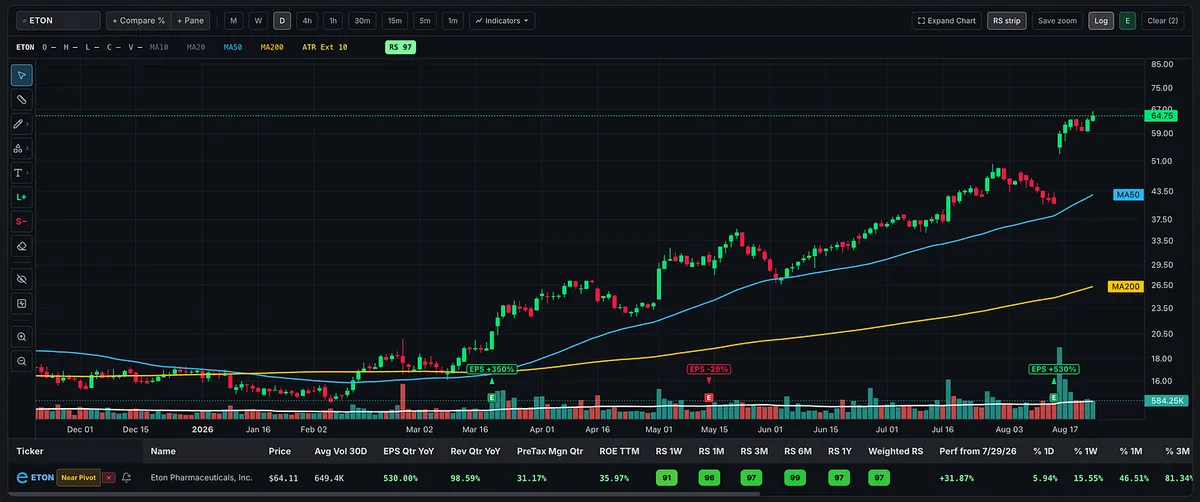
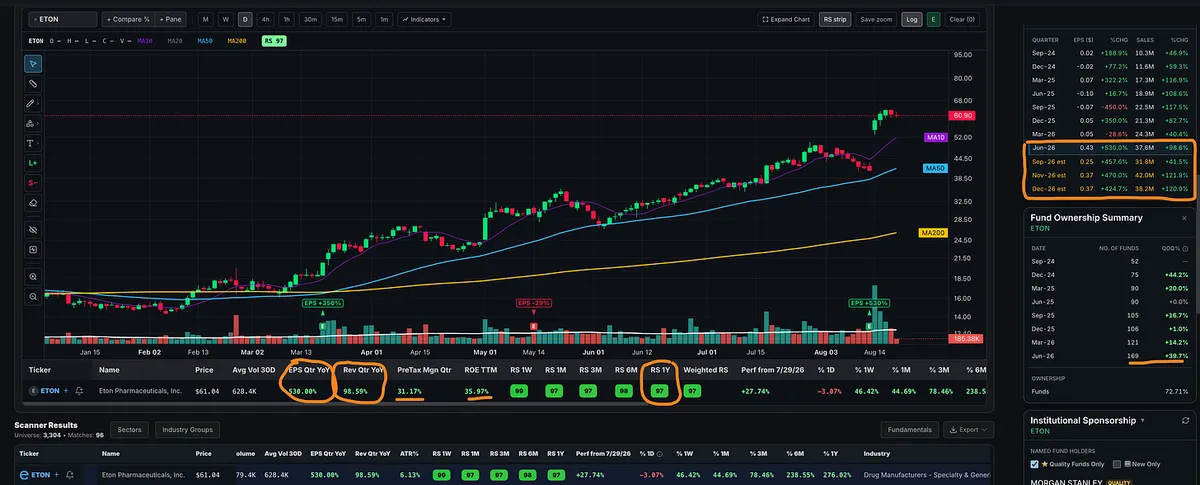
ETON is a name I’ll be watching closely to see if we get a nice, tight, orderly pullback that could create an attractive entry opportunity.

The stock had a huge gap-up after reporting triple-digit earnings growth, ran higher for several days, and now appears to be pulling back on lighter volume. That is exactly what I like to see following a powerful move.

The fundamentals are strong:

• Quarterly EPS growth: 530%

• Quarterly sales growth: 98%

• Pretax margin: 31%

• ROE: 35%

• Fund ownership increasing quarter over quarter

• 1yr Relative Strength Rating: 97

ETON has the fundamental growth characteristics we look for and has also been a strong performer coming off the July 29 lows.

This is a great CANSLIM name outside many of the AI-related areas that have recently started showing trouble again. Although many of those stocks made powerful moves off the July 29 lows, several have struggled to return to their previous highs. Many that did make it back have struggled to break out successfully.

Now I want to see if ETON can pull back on light volume with tight price action, potentially setting up a low-risk, high-reward entry opportunity.

View on Substack ↗

Before the Breakout: Why AUGO Was Already on My Radar

Strong group. Explosive fundamentals. Great price and volume.

Big move today in metals and miners.

One of the stocks I mentioned in the Big Picture two weeks ago was AUGO. Why did I mention it?

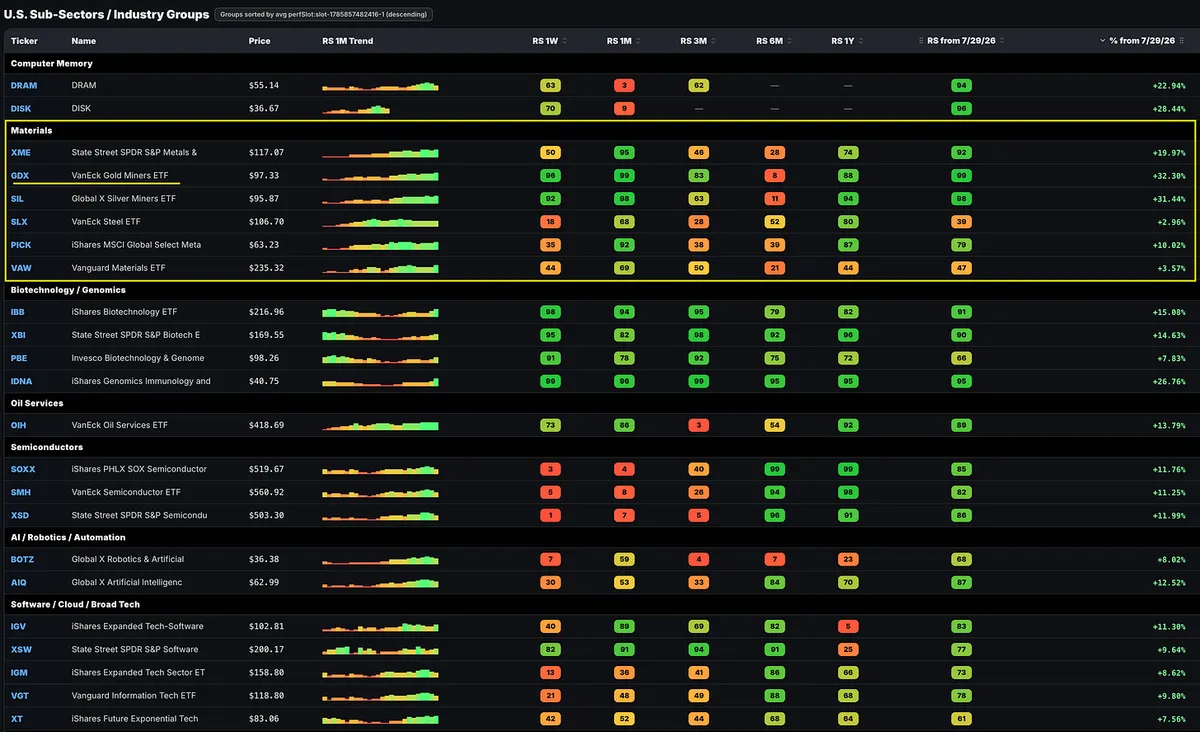
First, since the July 29 lows, we have seen strength in metals and miners, along with many of the groups that led in April and May.

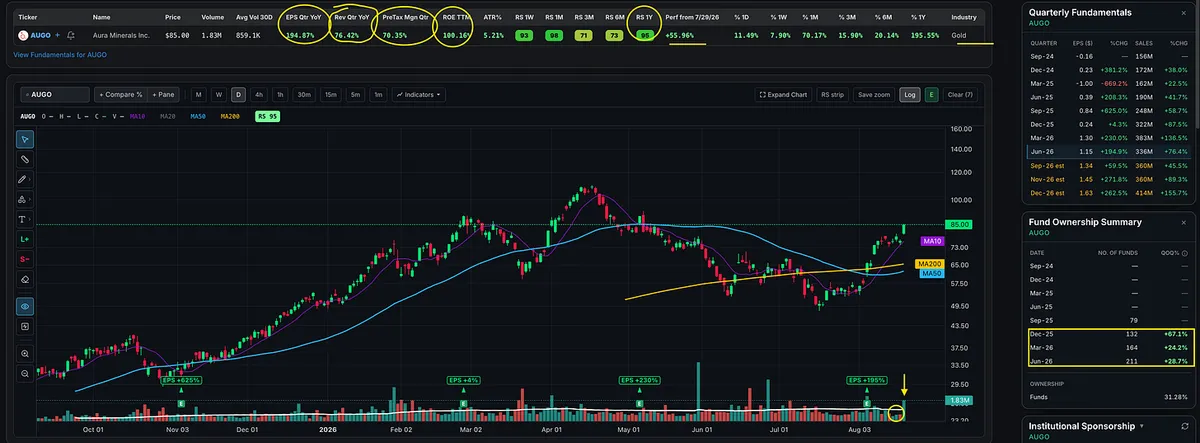
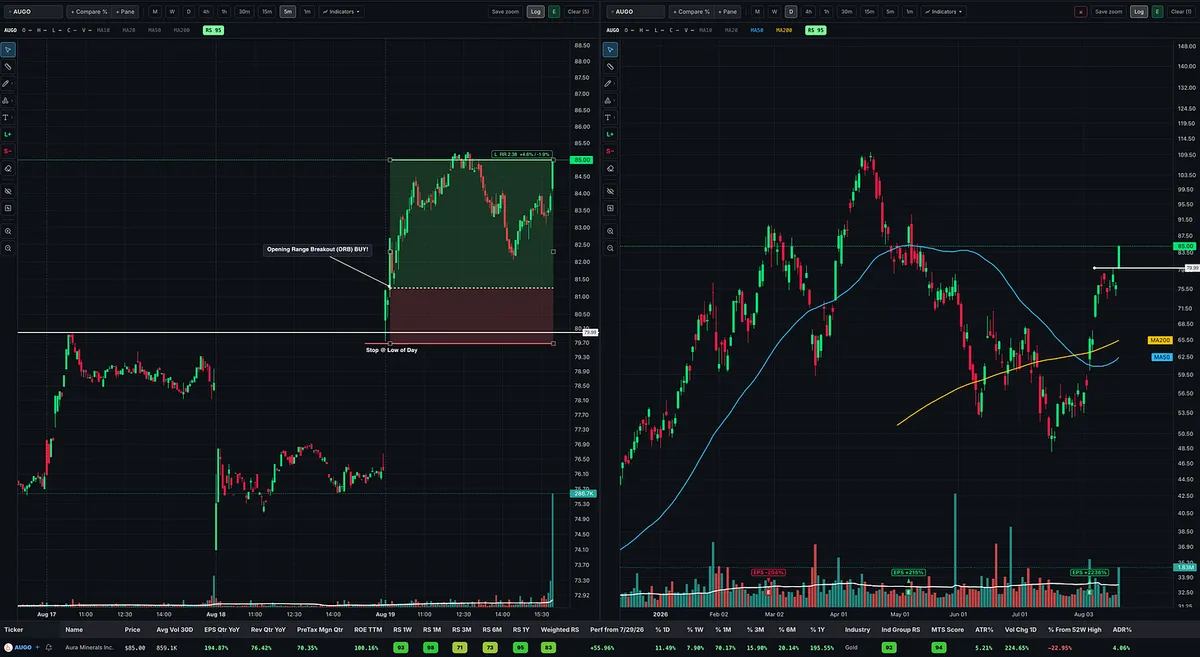
Next, AUGO had triple-digit earnings growth, double-digit sales growth, rapidly growing fund ownership, a one-year Relative Strength Rating of 95, and strong relative strength across the shorter time frames. It was also a name I was watching back in 2025 when metals and miners were performing extremely well.

Combine that with a powerful earnings gap above all its key moving averages, followed by a strong run higher and then a tight consolidation lasting a little over a week. Price found support at the 10-day moving average while volume dried up.

Today, volume rapidly came into the stock. AUGO cleared the consolidation high near $80 at the open and then triggered an opening range breakout around $81.22. Using the low of the day near $79.70 as the stop allowed the trade to be executed with less than 2% risk.

When a breakout through a prior high aligns with an opening range breakout, it can create a much higher-quality setup with a precise entry and tightly defined risk.

We identified a strong industry group within a supportive market environment. Then we found one of the strongest stocks in that group. We looked for great earnings and sales growth, excellent pretax margins and ROE, and textbook price and volume action.

The sequence was clear: a powerful move higher on heavy volume, volume drying up as price consolidated tightly, and then massive volume coming into the stock as it broke out today.

This is a great demonstration of how we use the MTS Velocity trading software to identify growth stock candidates and then apply the setups we teach in the MTS Course. These principles have been used by some of the world’s most successful growth and momentum traders, including William O’Neil, Mark Minervini, Dan Zanger, and Kristjan Kullamägi.