Momentum Trading Strategy

Notes

Chart Setups & Entries

When and where to buy a stock you have already found: chart patterns, buy points and entry tactics.

Showing 161–180 of 185 notes

View on Substack ↗

This Is What Institutional Accumulation Looks Like

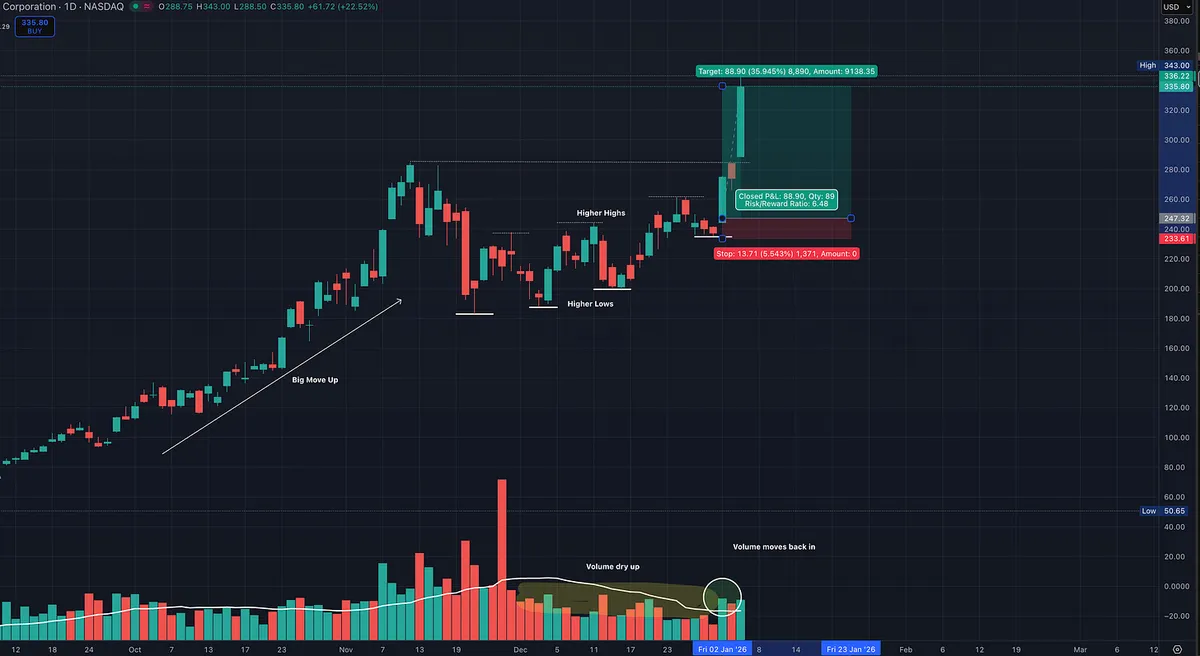
Here is a great example of a true leader digesting a major advance. Volume dries up as price tightens, forming higher lows and higher highs. Selling pressure fades while the structure strengthens.

As volume begins to move back in, demand returns ahead of the next powerful move higher.

SNDK also shows increasing fund ownership, confirming institutional accumulation. With a 99 Relative Strength rating, this is exactly the type of behavior you want to see in big winners before the next leg.

View on Substack ↗

You are right. Many times the volume only fully shows up at the breakout. That can mean either missing part of the move or feeling pressured to chase once it is already extended.

But there are a couple of ways to handle that without relying on FOMO.

One option is to anticipate the move during the quiet phase. When volume has dried up, price is tightening, and a higher low is forming, you can enter early with a stop just below that most recent low. If price breaks down, the setup is simply invalid and you can always re enter later. Your risk stays clearly defined.

The second approach is exactly what David Ryan describes. He does not wait for the massive breakout bar. He looks for volume to begin turning back up after it has already dried up, often on the first push off a higher low. That initial increase in demand is frequently the real signal. Entering there lets you participate before the obvious breakout, with much better risk to reward.

Nothing works one hundred percent of the time. But combining price structure, such as higher lows and tightening ranges, with volume behavior, drying up and then re expanding, consistently improves both your timing and your odds.

I will add some examples directly to the post above to show how this played out in real time.

The key is choosing the approach that best fits your risk tolerance and trading style.

Quoting Mak.yusuf
View on Substack ↗

William O’Neil on Why Volume Tells the Truth

William O’Neil explained volume in the simplest and most practical way possible:

“The volume in a stock is a measure of supply and demand. When a stock is beginning to move into new high ground, volume should increase by at least 50 percent over the average daily volume in recent months. High volume at a key point is an extraordinarily valuable tipoff that a stock is ready to move. Volume can also be used in a reverse manner. When prices enter a consolidation after an advance, volume should dry up very substantially. In other words, there should be very little selling coming into the market. During a consolidation, declining volume is generally constructive.”

This is one of the most misunderstood concepts in trading.

Volume isn’t noise. It’s participation. It tells you whether institutions are involved or standing aside.

When a stock breaks into new highs on heavy volume, it signals aggressive demand. Large buyers are willing to pay higher prices and they are doing it in size.

But just as important is what happens after the advance.

When a leading stock pauses and volume contracts, that’s not weakness. That’s a lack of selling pressure. Strong hands are holding shares. Weak hands are already gone.

That combination, strong volume on the way up and quiet volume during consolidation, is how healthy trends build.

Price shows you what is happening. Volume helps explain why.

And when both align at the right time, the market is often giving you a very clear message.

View on Substack ↗

My Favorite Trade Setup: Big Momentum, Tight Contraction, Asymmetric Risk

Most traders chase breakouts. I wait for something else.

First, a big momentum move.

Then price tightens and contracts.

Volume dries up as sellers disappear.

Then price breaks out with volume confirming the move.

That is where asymmetric risk shows up.

Small, defined downside. Open-ended upside.

I just published a full post breaking this setup down step by step, including:

  • What I look for to validate it

  • Where I enter

  • Where my stop goes and why

  • When I pass and do nothing

This works on weekly charts, intraday charts, and even short scalping timeframes.

Same behavior. Every market. Every cycle.

👉 Read the full breakdown here https://tradingmomentum.substack.com/p/my-favorite-trade-setup-big-momentum

ArticleMy Favorite Trade Setup: Big Momentum, Tight Contraction, Asymmetric Risk
View on Substack ↗

Why Markets Move the Same Way on Every Timeframe

Trading is fractal, just like nature. The same patterns that exist on daily and weekly charts also appear on 30-minute, 15-minute, 5-minute, and even 1-minute, 15-second, and 5-second charts.

Yesterday, the Nasdaq gave a textbook example.

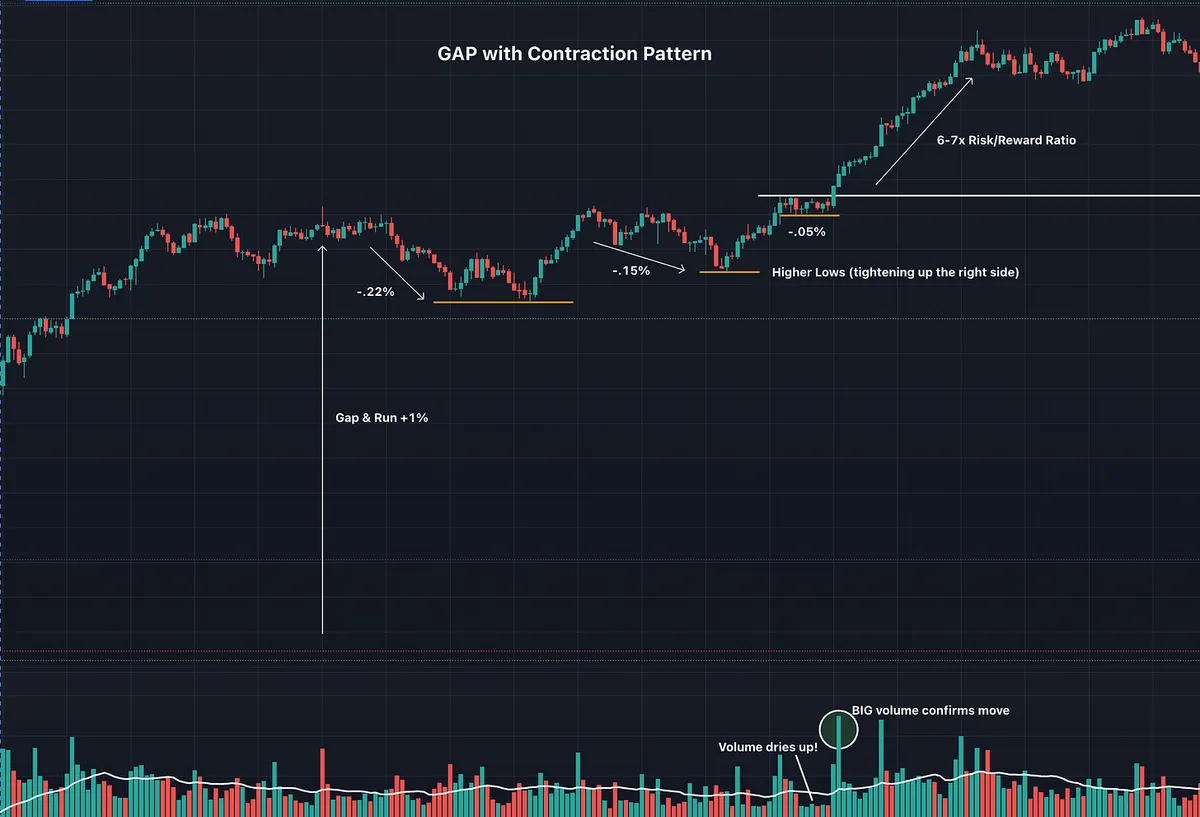
We opened with a ~1% gap up and run, followed by a strong initial impulse. After that move, price began to contract in a very orderly way.

Each pullback became progressively smaller:

  • First contraction: -0.22%

  • Second contraction: -0.15%

  • Third contraction: -0.05%

As price tightened up the right side of the chart, volume dried up.

That’s the tell.

Selling pressure was fading. Supply was disappearing. When price finally broke out of the contraction, volume expanded, confirming the move and producing a ~6–7x risk/reward opportunity.

This is what I call a Contraction Pattern.

It’s the same behavior across all timeframes:

  • A strong impulse

  • Followed by shrinking pullbacks

  • With volume drying up

  • Leading to expansion

As volatility contracts, risk tightens and reward expands.

These are the types of trades I look for over and over again.

View on Substack ↗

Powerful move from a watchlist stock today.

AXGN bounced cleanly off the 20-day moving average on expanding volume while the major indexes were down.

That relative strength matters. When a stock holds support and pushes higher against a weak market, it’s a sign institutions are still accumulating.

The best leaders rarely give deep pullbacks. They reset just enough to shake out weak hands, then move again.

This is why keeping a tight, prepared watchlist matters. When the market gives you the signal, it’s time to execute.

View on Substack ↗

Most traders study charts after the big move.

That’s why they keep missing the best setups.

The real edge is learning to recognize what a stock looks like before it breaks out. Tightening price action. Drying volume. Quiet strength on the right side of the base.

I just published a post on how to train your eye to spot winning setups in real time, using NVDA as a real example.

If you want to stop chasing and start anticipating, this is worth reading.

👇

https://tradingmomentum.substack.com/p/how-to-train-your-eye-to-spot-winning

ArticleHow to Train Your Eye to Spot Winning Stock Setups Before the Breakout
View on Substack ↗

CRDO is a Leader with Elite Fundamentals but the Tape is Telling a Different Story

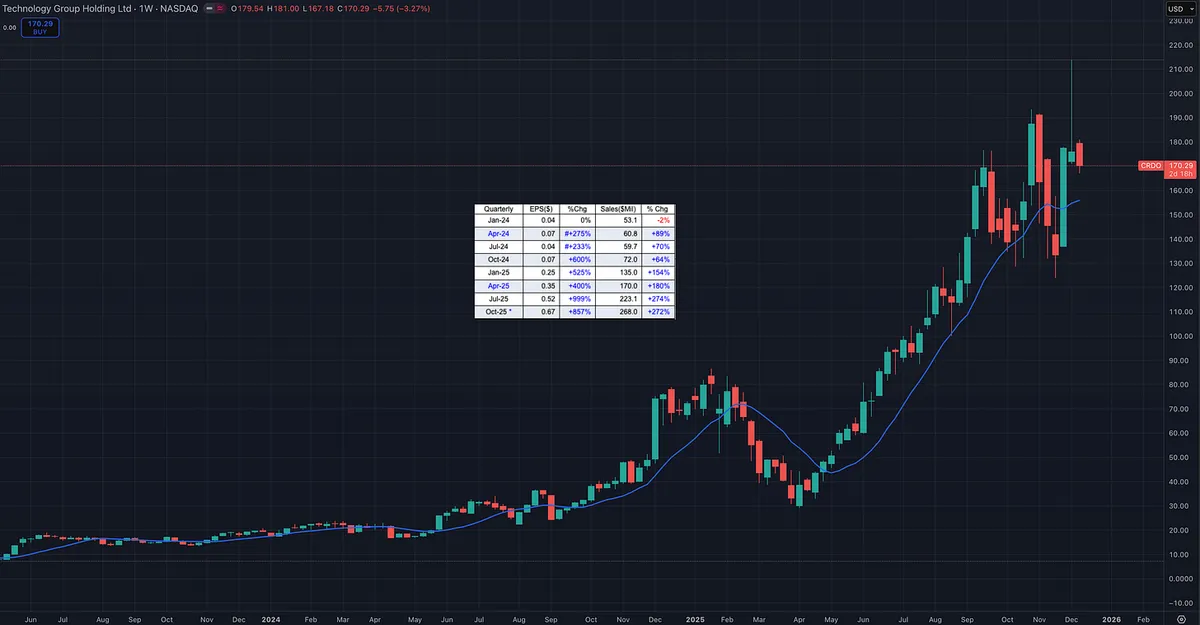
CRDO continues to post some of the strongest numbers in the entire market. Earnings growth is explosive. Sales acceleration is off the charts. Margins and return on equity are exceptional. Fund ownership is rising fast and the stock carries a Relative Strength rating of 98, which places it near the top of all equities.

The theme is perfect as well. CRDO sits in a hot industry group and lines up with the broader bull market cycle that has rewarded AI and high performance semiconductor names all year.

On paper this is everything you want to see from a future leader.

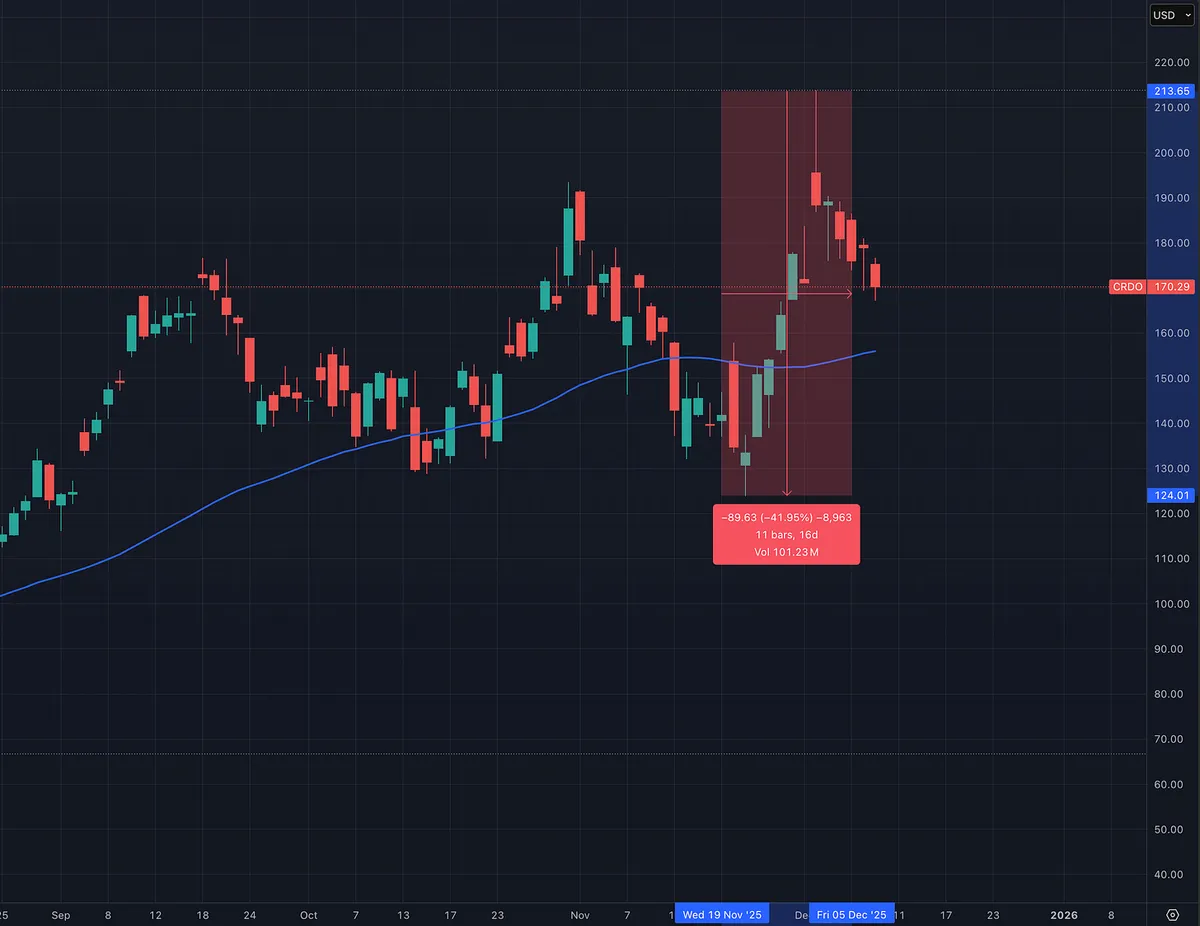
But the price action is sending a warning. The recent wide and loose behavior on the weekly chart is not what you want to see after a strong advance. True leaders usually tighten up, pull back in a controlled manner, and continue to show evidence of institutional support. When the bars become wide and the swings get emotional, it tells you the tape is not in full agreement.

The stock is powerful, but the action needs to calm down. The high to low swing is close to 40 percent. Ideally we would see the chart tighten along the right side and form a more controlled structure. That would give us a cleaner risk reward setup and a higher quality breakout opportunity.

View on Substack ↗

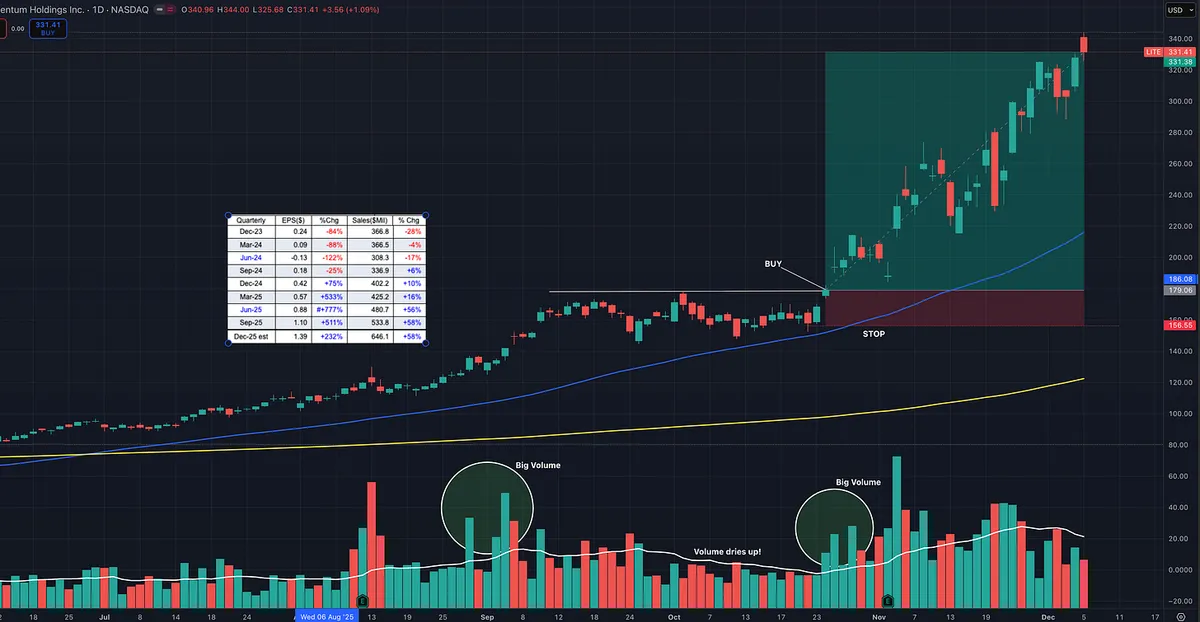
Great example of volume and price analysis with LITE.

LITE was easily spotted on scanners for its Relative Strength performance (RS 99), huge earnings and sales acceleration, and its position in a leading sector and theme. This is exactly what real leadership looks like from a top industry group in telecom and fiber optics.

The setup was a flat base breakout after tight consolidation. Big volume came in on the first move up, followed by controlled consolidation where volume dried up, and then another surge of big volume on the breakout.

The combination of strong fundamentals, clean technical price action, increasing fund ownership, and leadership within its sector created a high quality risk and reward opportunity.

View on Substack ↗

It amazes me how much focus people put on their setup, but very little on how that same setup behaves in different market environments. A pattern that works beautifully in a momentum expansion with strong leadership and breadth can completely fall apart during a correction or choppy, range-bound conditions.

Van Tharp’s six market types opened my eyes to this years ago: bull quiet, bull volatile, bear quiet, bear volatile, sideways volatile, and sideways quiet. The same setup performs very differently depending on which environment you’re in.

The environment dictates the effectiveness of the setup. Understanding when to press and when to step aside is what actually makes a setup work.

View on Substack ↗

Yesterday was a great reminder of how combining multiple timeframes can create a low-risk, high-reward swing setup.

I didn’t buy just because price reclaimed the 50-day MA. The 50-day is just an area of interest, not a signal.

Instead, I waited for:

✅ Higher low

✅ Higher high

✅ Supportive tape + volume

This let me define risk tightly, take partials into strength, and let the rest of the position run, essentially financing the trade with early gains.

As Soros said, “It’s very different when you’re risking your principle than when you’re risking your profit.”

Full breakdown here ↓

https://tradingmomentum.substack.com/p/a-low-risk-high-reward-entry-off

ArticleA Low-Risk, High-Reward Entry Off the 50-Day
View on Substack ↗

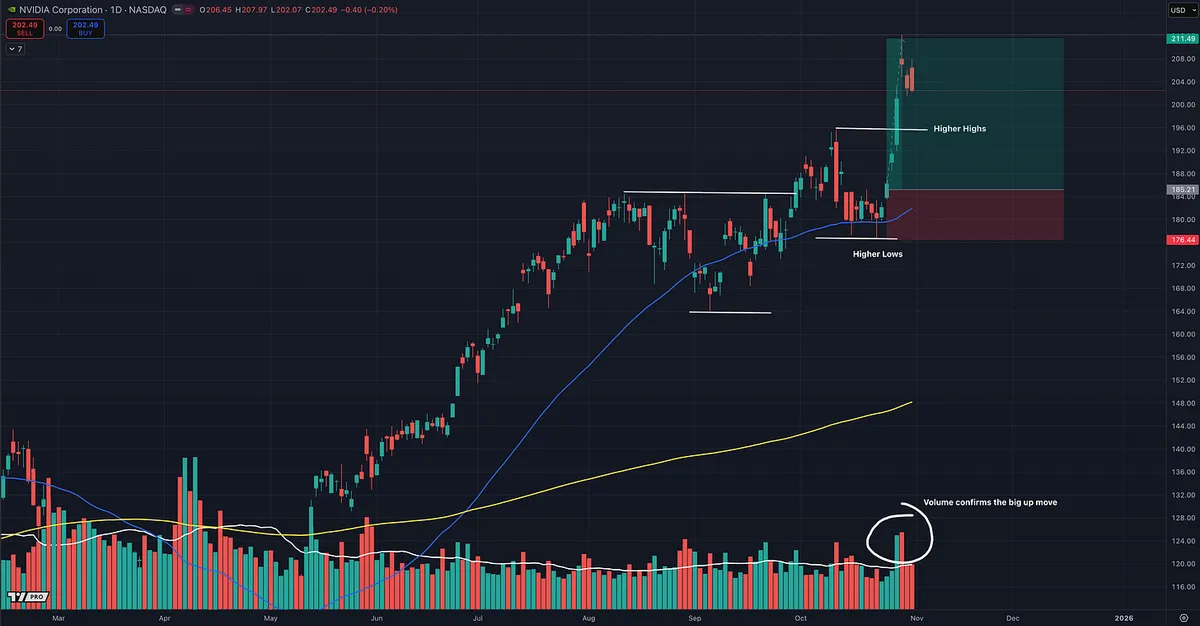
NVDA — Same Story, Different Cycle

It’s always funny to see the chatter every time $NVDA consolidates. Just like people who think a stock or asset will never go down, there’s always another camp convinced “the top is in.” Then NVDA goes up, consolidates, and does it again, more times than I can count. 😂

That’s exactly why it’s so important to focus on price action and volume, and to look for good risk/reward opportunities until the trend actually confirms it’s over. Until then, the key is to stay unbiased and keep making smart, high-probability bets. If you study the greatest market winners of all time, as William O’Neil did, the pattern is clear: leaders in leading industry groups tend to dominate bull markets far longer than most people expect before finally topping out.

Plenty of bulls don’t rely on stochastics or oscillators, just price action and volume — the purest read of supply and demand. From that view, NVDA continues to show strength with higher lows and higher highs through its consolidation, and now it’s broken up out of that range, a textbook bullish continuation.

Price sits above all key daily moving averages (10, 20, 50, and 200 SMA). The last pullback found support at the 50-day on lighter volume, while the recent breakout came on big volume, confirming real institutional buying interest.

From a risk/reward standpoint, this setup is clean: defined support, strong momentum, and volume confirmation — everything you want in a continuation move.

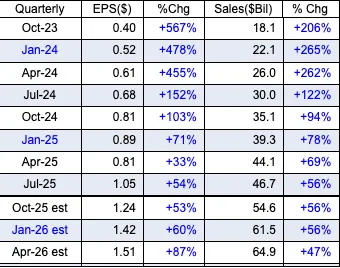
And fundamentally, NVDA remains an absolute leader. It holds an IBD Relative Strength Rating of 90, meaning it has outperformed 90% of all stocks in the market over the past 12 months. That’s not the same as the RSI or Stochastic “relative strength” indicators. IBD’s RS Rating measures true performance versus all other stocks, not short-term momentum.

When you combine that kind of technical strength with fundamental dominance like strong earnings, consistent sales growth, and market leadership, it’s hard not to stay bullish.

NVDA continues to do what great stocks do: Climb, consolidate, shake out the doubters, and climb again.

View on Substack ↗

The Timeless Structure of Markets: Understanding Stan Weinstein’s Stage Analysis

In 1988, Stan Weinstein introduced a framework that still outperforms countless modern trading systems.

This comprehensive guide breaks down his Stage Analysis — how to identify where you are in the market cycle, trade in harmony with the trend, and avoid catastrophic losses.

Discover why, even decades later, simplicity — not complexity — remains a trading edge.

https://tradingmomentum.substack.com/p/stan-weinsteins-stage-analysis-the

ArticleStan Weinstein’s Stage Analysis: The Complete Guide to Understanding Market Structure
View on Substack ↗

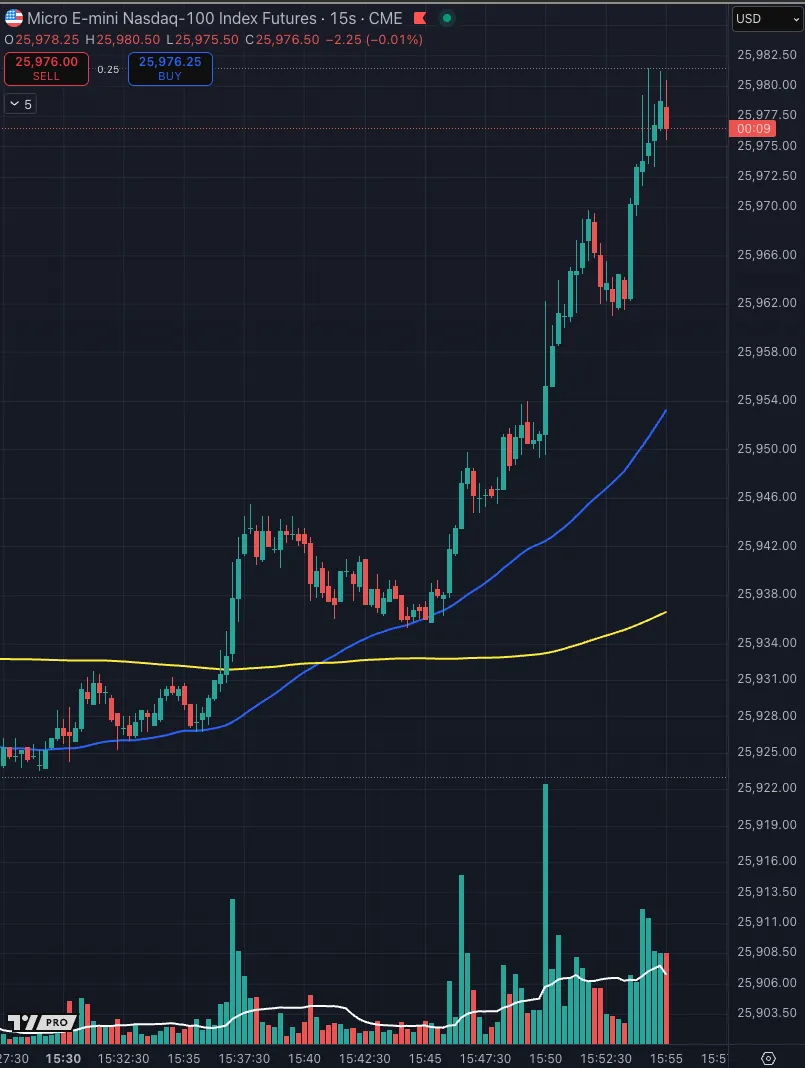
When Volume Confirms Price

I was watching the market close on Monday and took this screenshot because it captures volume price analysis in action. It may be a 15-second chart, but the same story plays out across all timeframes. Price begins forming a series of higher lows before a surge in volume pushes the market sharply higher. On the first pullback, volume dries up, showing that selling pressure has faded. When price turns back up, volume expands again, confirming that buyers have regained control.

View on Substack ↗

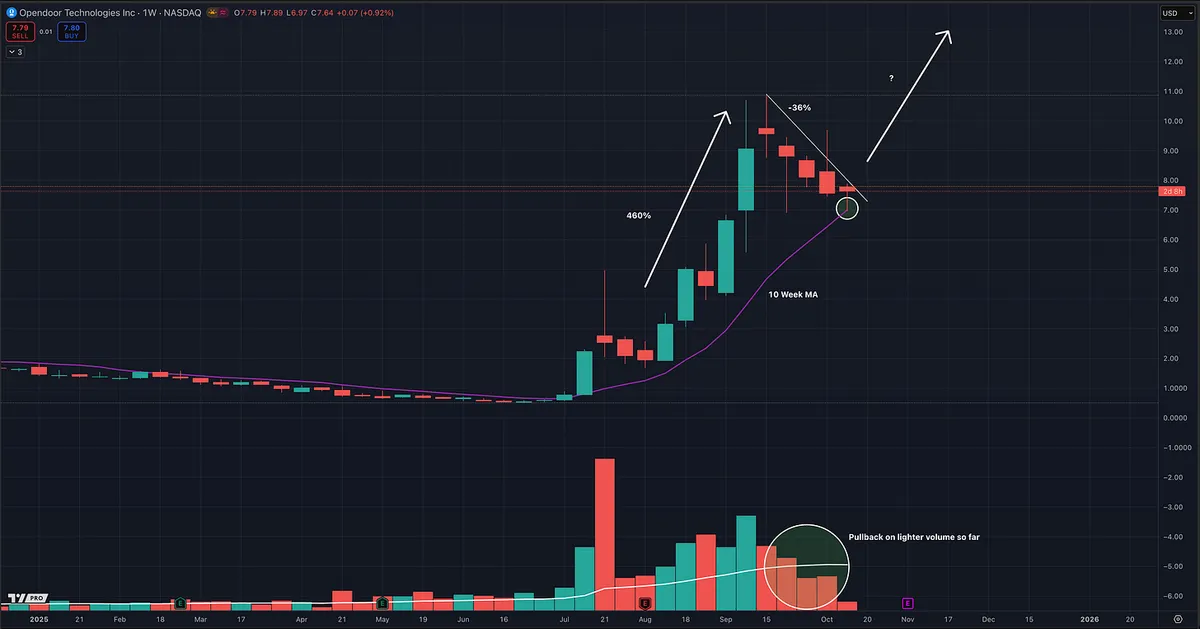
Weekly chart looks constructive — $OPEN has pulled back to the 10-week MA on lighter volume after a strong prior run. The weekly structure remains intact despite a ~36% pullback, and volume has been drying up, indicating normal consolidation.

A strong-volume breakout through the short-term downtrend could confirm a trend resumption and signal the next leg higher.

I’ll turn cautious if heavy selling volume appears and price breaks below $6.90 — that would invalidate the setup for now.

View on Substack ↗

“Most investors think that charts are hocus-pocus. Only about 5 to 10 percent of investors understand charts. Even a lot of professionals are totally ignorant about charts. Just as a doctor would be foolish not to use X-rays and EKGs, investors would be foolish not to use charts.”

— William J. O’Neil