Momentum Trading Strategy

Notes

Chart Setups & Entries

When and where to buy a stock you have already found: chart patterns, buy points and entry tactics.

Showing 141–160 of 185 notes

View on Substack ↗

Buying Pullbacks vs Buying Breakouts

Most traders think you have to pick one.

You don’t.

You just need to know what each one does for you.

Buying Breakouts

You buy strength.

You buy as price clears resistance.

You buy as the stock moves into new high ground.

Why I use it:

• It confirms demand

• Overhead supply is gone

• Risk is clearly defined below the pivot

• Momentum is aligned

Breakouts increase probability.

When the market is in a strong uptrend, this is the cleanest way to initiate a position.

But there is a tradeoff.

• You pay up

• Everyone sees the same level

• Shakeouts are common

• Cost basis rises quickly if you keep adding

Breakouts are powerful.

They are also crowded.

Buying Pullbacks

You are not buying weakness in a downtrend.

You are buying weakness inside a confirmed uptrend.

Higher highs. Higher lows.

Rising 10-day, 21-day, or 50-day moving average.

Why I use it:

• Lower cost basis

• Better risk to reward

• Easier to accumulate shares

• Less competition

• Opportunity to add size without chasing

But the key to buying pullbacks is not guessing.

It is waiting for an upside reversal at support.

A shakeout.

A reclaim.

A strong close near the highs of the day.

That upside reversal becomes your signal.

The low of that reversal day becomes your stop.

If price undercuts it, you are wrong.

Without that trigger, you are just catching a falling knife.

Pullbacks improve positioning.

But they require:

• A strong general market

• A stock in a defined uptrend

• Clear support levels

• Absolute risk control

If support breaks, you are wrong.

How I Actually Trade It

Many times I do both.

I buy the traditional breakout.

Then I add on pullbacks.

Breakouts get me involved. Pullbacks help me build size.

If the stock is truly a leader, it will:

• Break out

• Pull back to the 10, 21, or 50

• Stage an upside reversal

• Resume higher

That is where real position building happens.

The goal is not to be right once.

The goal is to build size in the right stock while controlling risk.

Some uptrends reward breakouts more.

Some reward pullbacks more.

You need to be aware of what is working best right now.

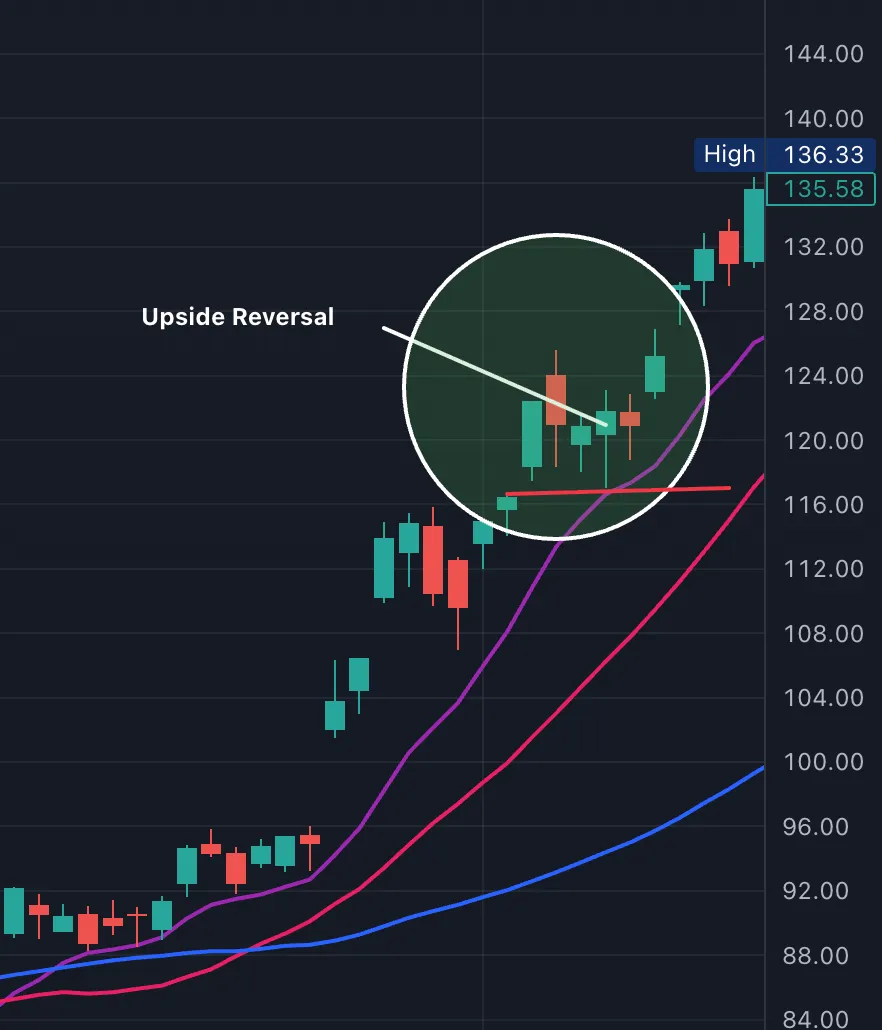
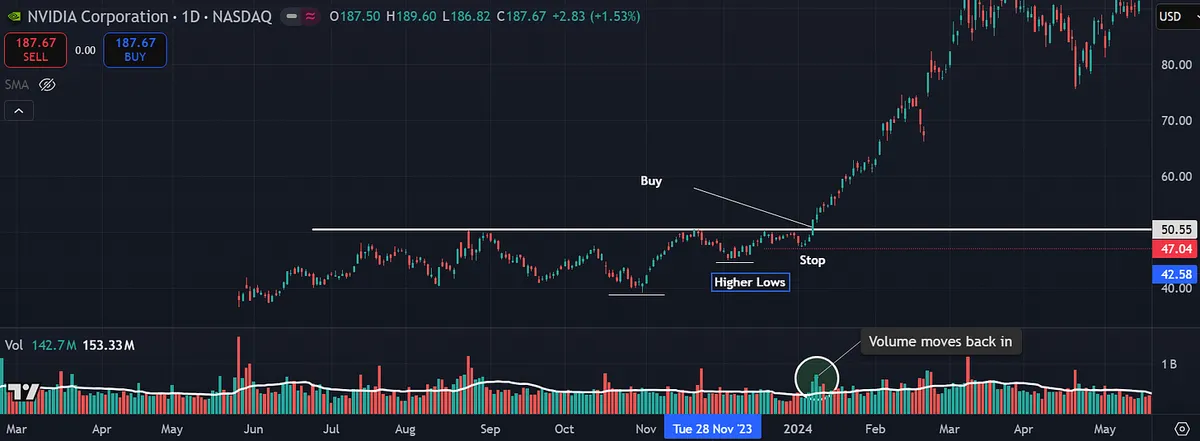
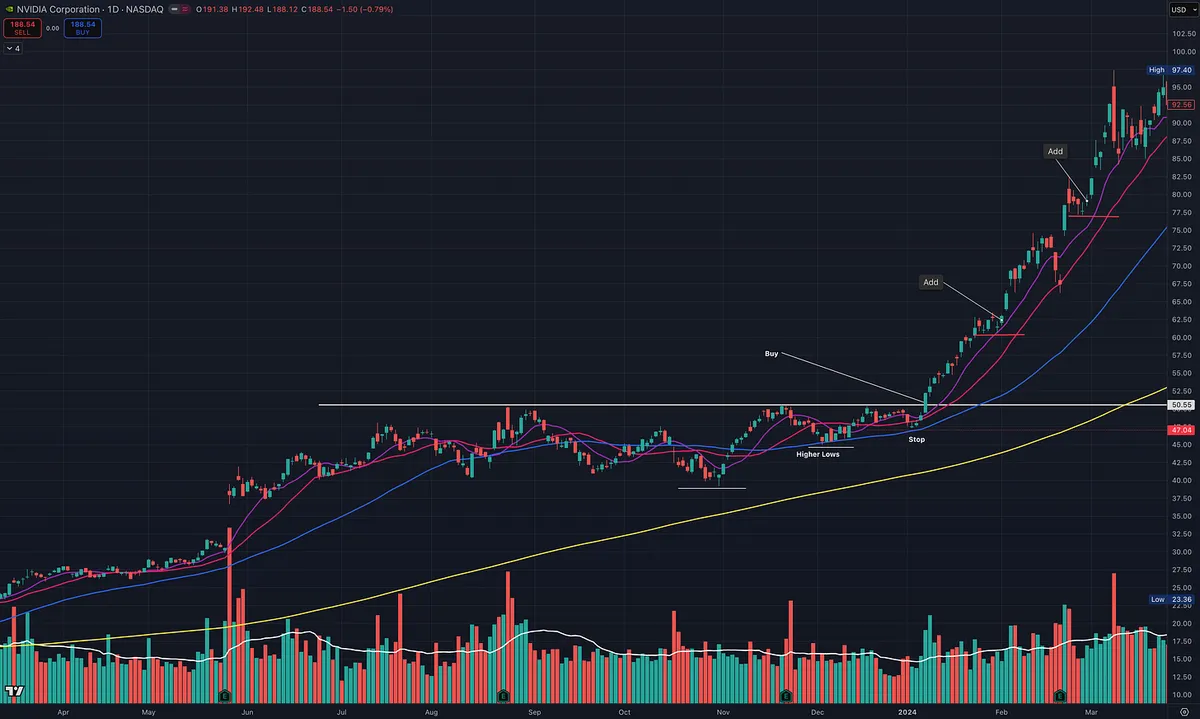
NVDA Example

NVDA provided a textbook example of this sequence.

Flat base breakout from VCP to initiate.

Then a controlled pullback into the rising 10-day.

On that pullback, price:

• Touched support

• Reversed higher

• Closed above the prior day’s close

• Traded above the prior day’s high

That is buying a pullback within an uptrend.

The low of that reversal day or low of pullback becomes the stop.

Breakout to get involved.

Pullback to add.

That is how real leaders let you build a position.
View on Substack ↗

Struggling Right Now? Raise Your Standards.

“I just wait until there is money lying in the corner, and all I have to do is go over there and pick it up.”

—Jim Rogers

If you are struggling, the answer is usually not more trades.

It is better trades.

When performance slips, standards quietly slip with it.

A base that is almost clean.

Volume that is decent.

Market conditions that are mixed but maybe fine.

Close enough becomes good enough.

That is where drawdowns grow.

Raise the bar.

Only take A plus setups.

Clear structure.

Tight risk.

Explosive volume.

Strong relative strength.

Make sure the time frame you are trading aligns with the bigger time frame.

Make sure your stock aligns with the general market.

Make sure the wind is at your back.

If it is not obvious, skip it.

Selectivity protects capital.

Patience preserves clarity.

Alignment increases odds.

When in a slump, do less.

And do it better.

View on Substack ↗

Transportation Shows Up

Transportation had a big week. Now the question is whether relative strength continues.

Leadership is starting to separate from the rest of the market.

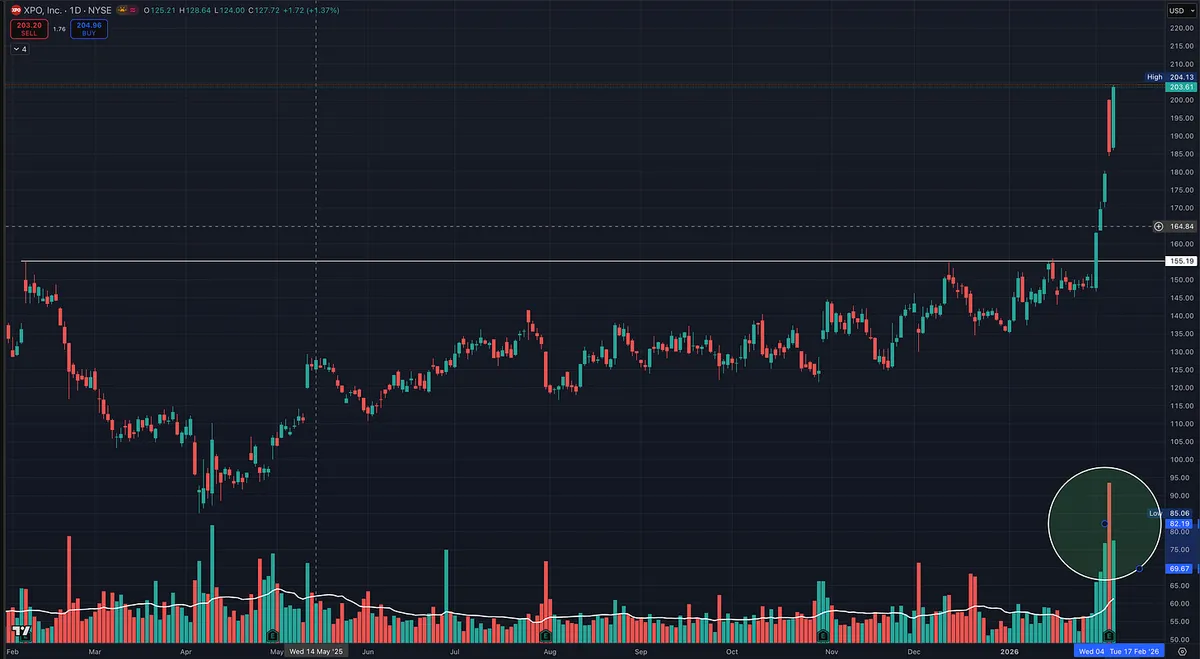
One name to watch is XPO Logistics.

XPO broke out of a flat base with clear volume expansion.

That matters.

Big moves often start when:

  • a group shows strength

  • leaders emerge within that group

  • price breaks out on volume

View on Substack ↗

Note on Swing Trade Entries: Opening Range Breakout (ORB)

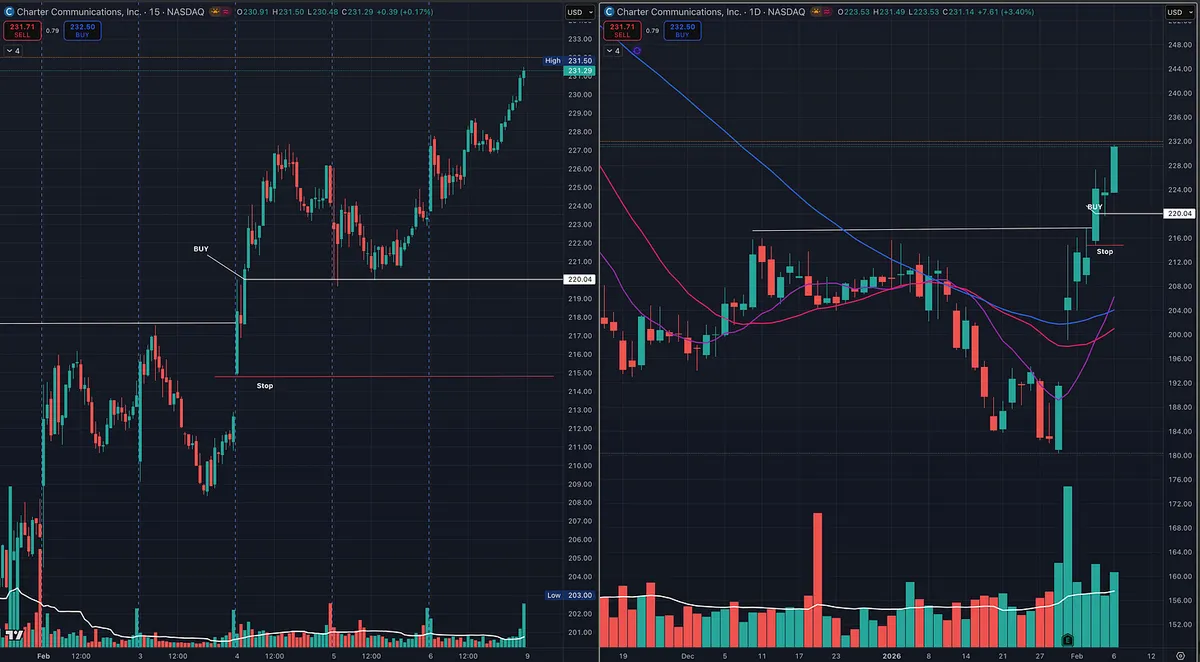
One common way many momentum and swing traders enter positions is the Opening Range Breakout (ORB), a tactic popularized by traders like Dan Zanger and Kristjan Kullamägi.

The idea is simple and focused on tight risk:

  • Use an intraday chart (5-min, 15-min, or 30-min — trader preference).

  • Identify the first bar of the day.

  • Buy when price breaks above the high of that first bar (which also becomes the high of day at that moment).

  • Stop is placed at the low of the day (often the low of the opening bar).

This entry method is not about day trading. It’s simply a clean way to initiate a swing position with defined risk. Once entered, the trade is typically managed on the daily chart, not intraday.

I’m sharing this as an educational example of a well-known entry technique used by many successful swing traders, not a requirement, just one tool in the toolbox.

View on Substack ↗

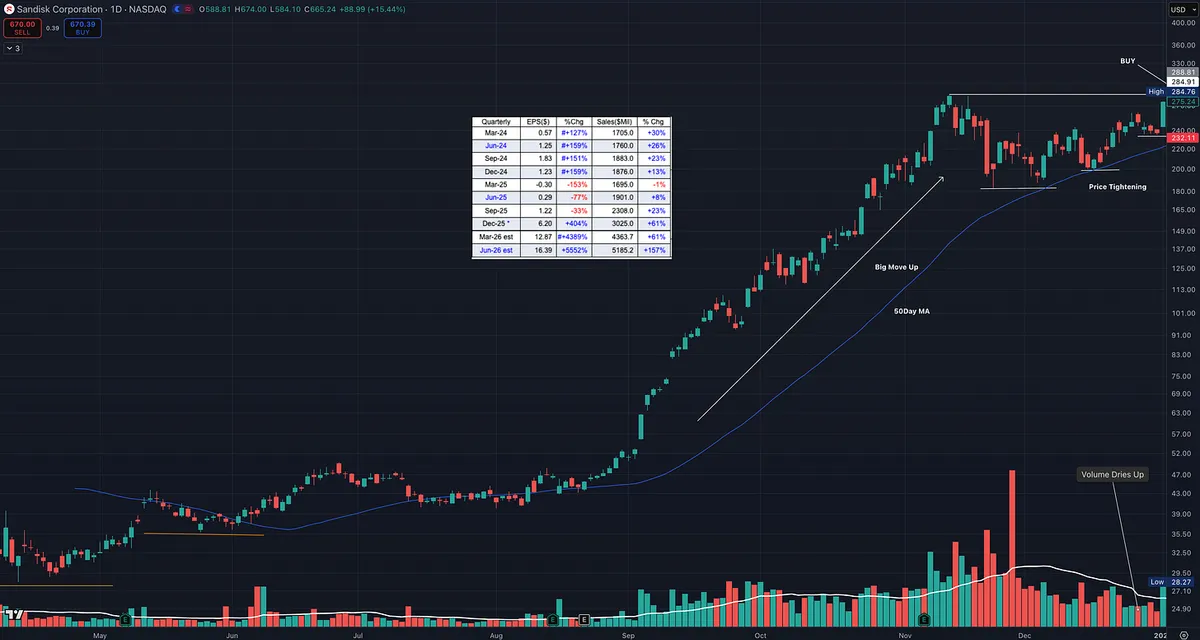
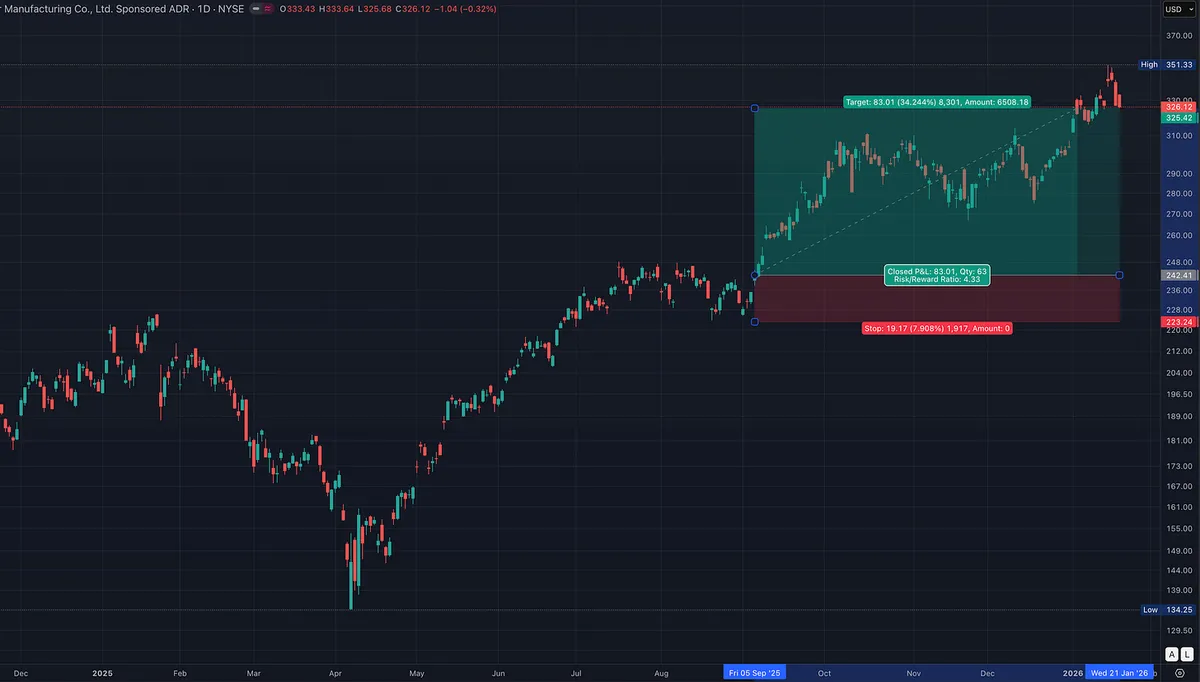
Study This Chart: One of the Best Low Risk Breakout Setups

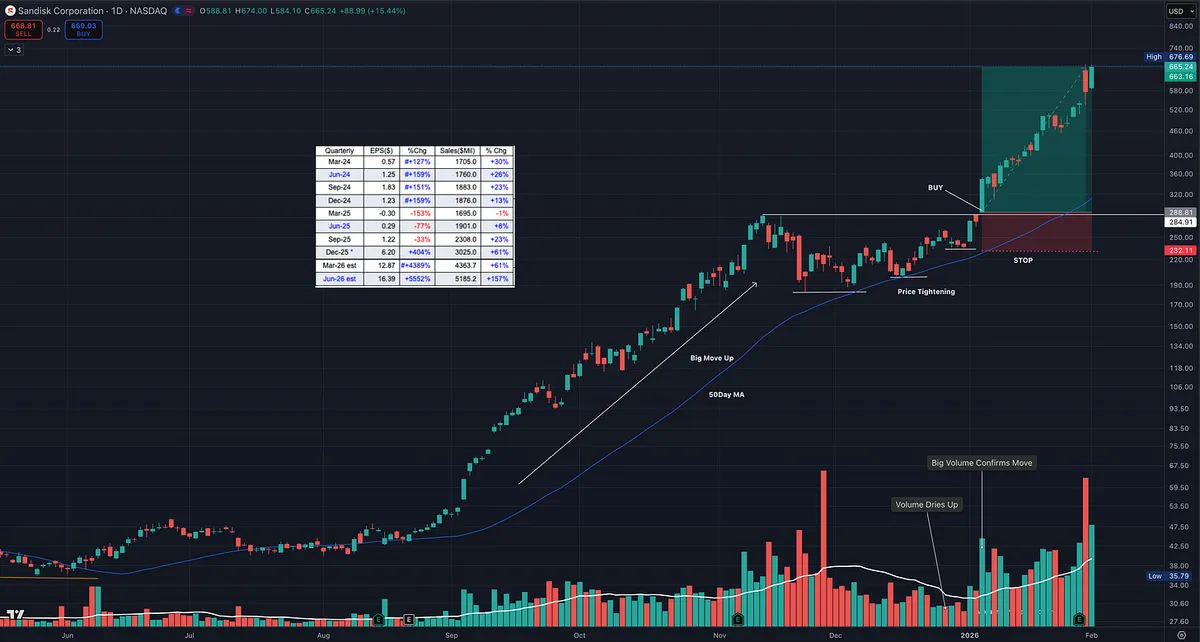
This chart is a perfect example of the type of setup we look for.

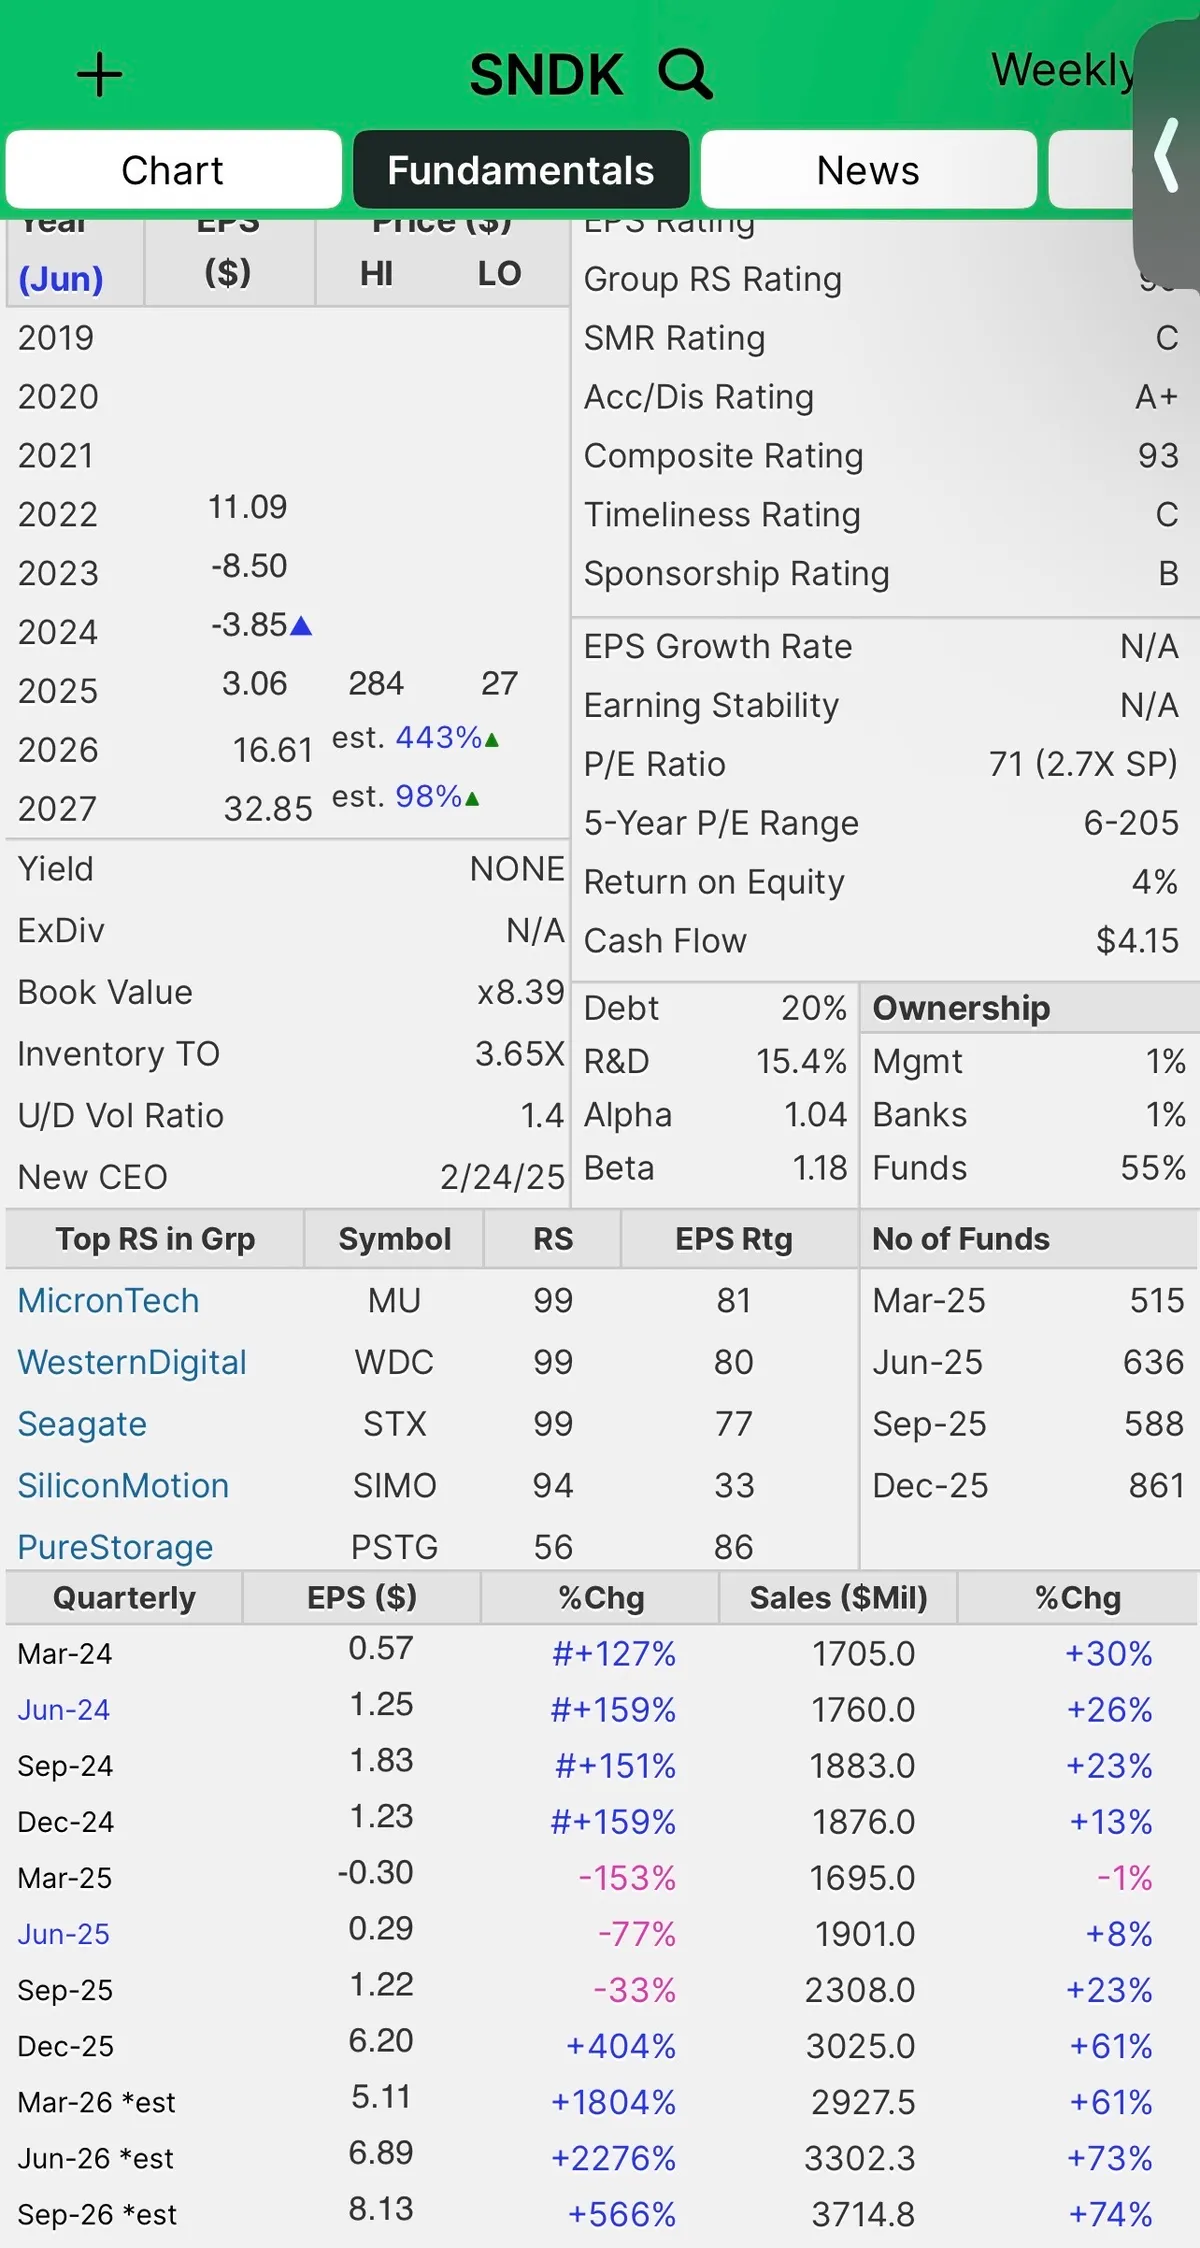
The stock is sitting inside a subsector that supports the main market theme right now, AI. When a subsector is strong, it tends to lift the entire group. That is why you see other names in the space acting well too, like Micron Technology, Western Digital, and Seagate Technology.

Now zoom in on the important part.

What makes this a premium setup is that it checks the fundamental boxes that show up in many of the biggest winners of all time, the type of characteristics William J. O'Neil wrote about after studying market history going back over a century.

But fundamentals alone are not what makes this special.

The real edge is the price action.

1) High relative strength

When a stock has RS in the 90s, it is telling you institutions are already voting with their money. This is what you want in a true leader.

2) Big earnings and big sales

Strong numbers are the fuel. Price action is the trigger. When both line up, it is hard for the market to ignore.

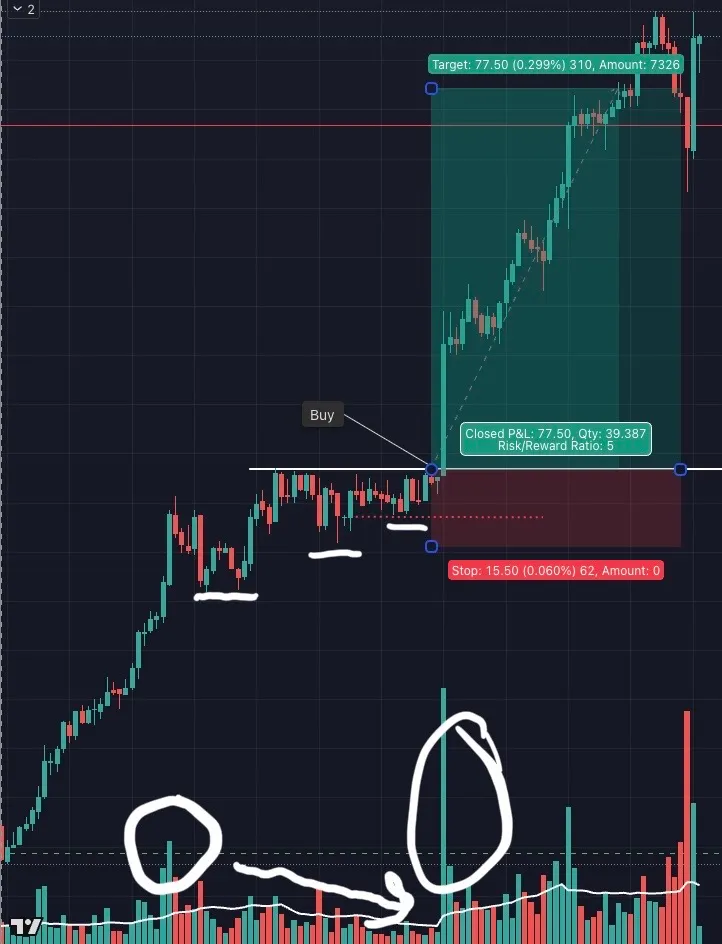
3) Big move up, then price tightens

This is the cheat code. A strong advance followed by tight price action. That is where the market gives you a gift.

Tightening action does two things.

  • It shows supply is drying up.

  • It gives you a clean place to define risk.

Why this is low risk and high reward

When price tightens near highs and then breaks out, you can build a trade that is asymmetric.

You are not guessing. You are defining a level that proves you wrong.

If it fails, you are out quickly.

If it works, you can ride a trend and manage it.

That is how you end up with trades that can pay 3R, 5R, even 10R plus while keeping the downside controlled. Study what what it looks like before and after.

View on Substack ↗

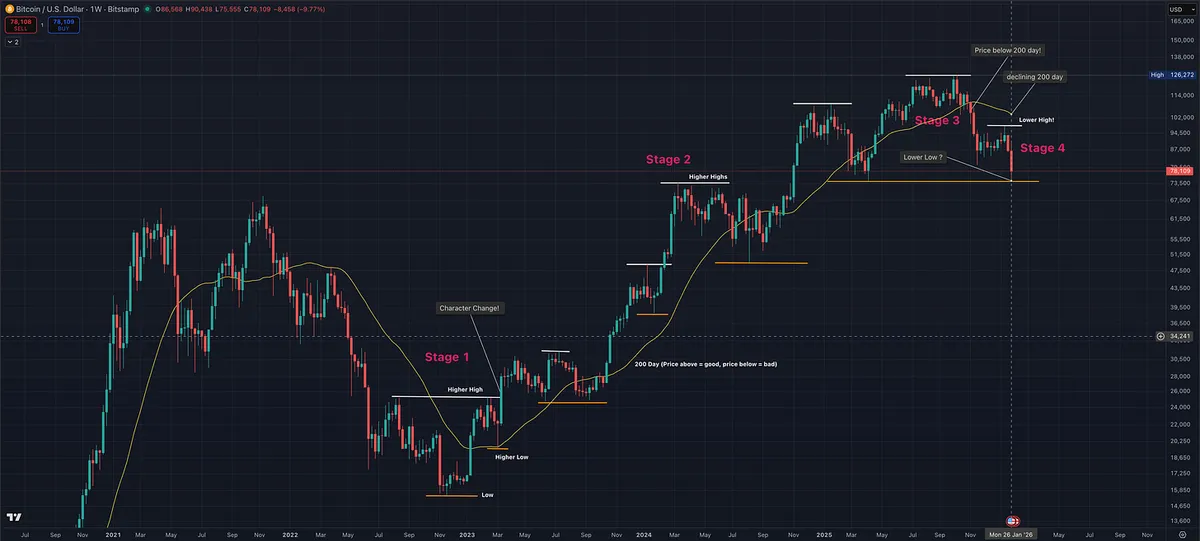
This Is What a Stage 4 Decline Looks Like – A Bitcoin Example

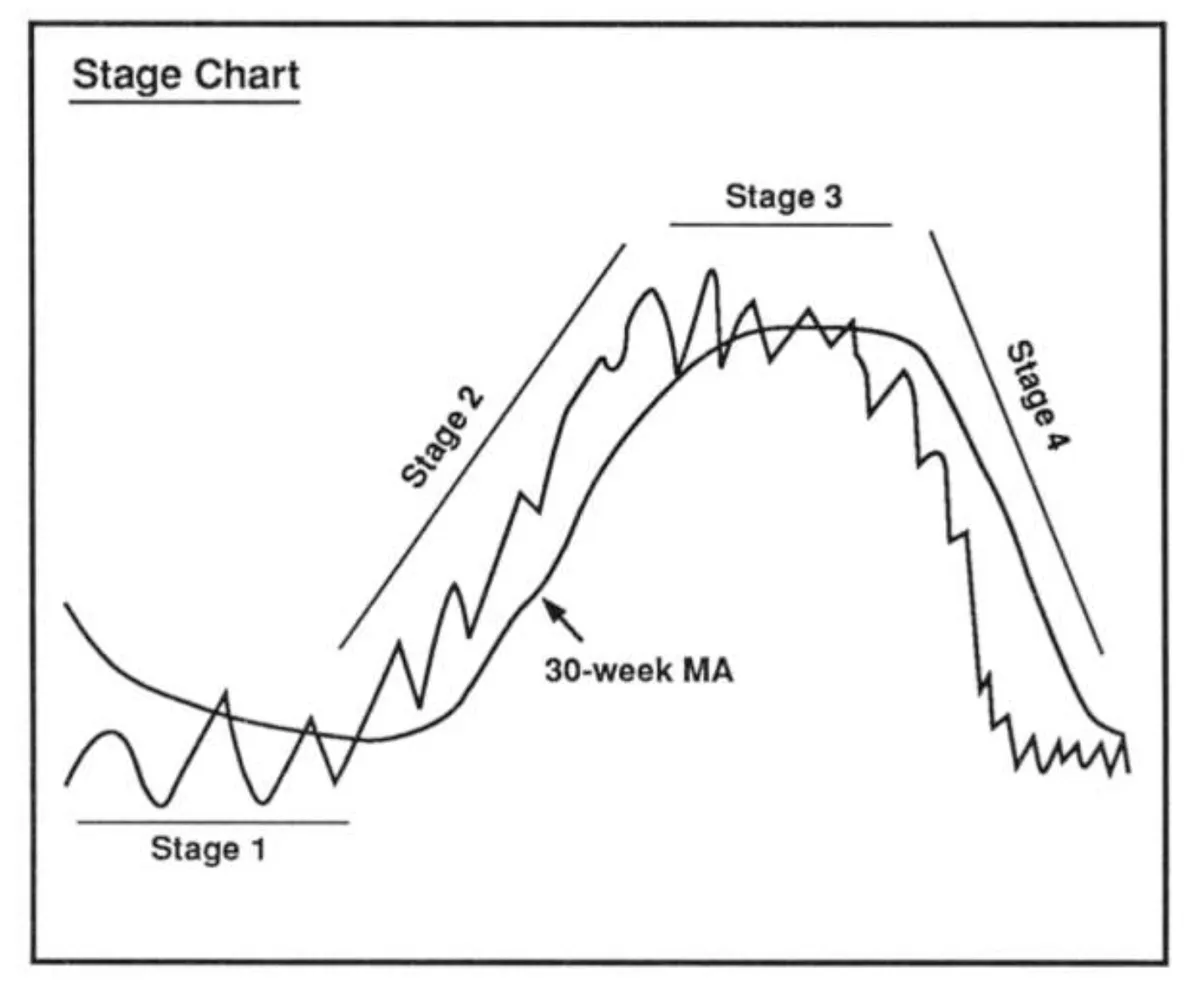
This chart is a textbook example of Stan Weinstein’s Stage Analysis in action.

Despite continued dip buying, the crypto market structure has clearly deteriorated.

Here’s what matters, not the narrative:

  • Price is below the 200-day moving average

  • The 200-day moving average is declining

  • A lower high has already formed

  • Lower lows are now developing

That combination defines a Stage 4 environment.

Stage 4 is not where leadership forms. It is where downside risk expands, rallies fail, and “cheap” prices often continue to get cheaper. This is not what we buy.

What makes this a powerful teaching example is the psychology. Even as structure breaks down, many participants continue to buy dips, anchored to prior highs rather than current trend. Price does not care about narratives. Structure tells the truth.

This is exactly why stage, trend, and long-term moving averages matter. They help keep you aligned with probability instead of emotion.

If price can reclaim the 200-day and the trend begins to repair, the conversation changes. Until then, this remains a Stage 4 decline, and risk should be treated accordingly.

View on Substack ↗

How Professional Traders Handle Earnings Season

It’s earnings season, and you’ll see plenty of stocks setting up just days before their reports.

The chart looks great.

Price action is tight.

Earnings and sales estimates look strong.

And yet, most professional traders will pass. I do too.

Why? Because risk comes first.

Earnings are not a normal trading environment. They are a news event. Price can gap sharply higher, or it can gap down far beyond any logical stop. Once the report hits, you lose control of risk.

Yes, big gains are possible when earnings surprise to the upside. But large, instant losses are just as possible, and they have nothing to do with your setup or discipline.

That’s not trading. That’s gambling.

If you are already in a position heading into earnings, the smart move is risk reduction. Sell enough to lock in profit so a bad reaction cannot hurt you. If the stock reacts well, you still participate. If it doesn’t, you survive.

If you are not already in the stock, patience is usually the best decision.

This is how many top traders handle it. William O’Neil, Mark Minervini, David Ryan, and Dan Zanger don’t try to predict earnings. They let the report hit and then watch how institutions react.

What they look for is confirmation. A strong post-earnings move higher on heavy volume. Then a controlled pullback on lighter volume. That’s where risk comes back into your hands and where high-probability entries are found.

As Paul Tudor Jones said, “Never trade in situations where you don’t have control. I don’t risk significant amounts of money in front of key reports, since that is gambling, not trading.”

Risk first.

Let price confirm.

Opportunities always come back.

View on Substack ↗

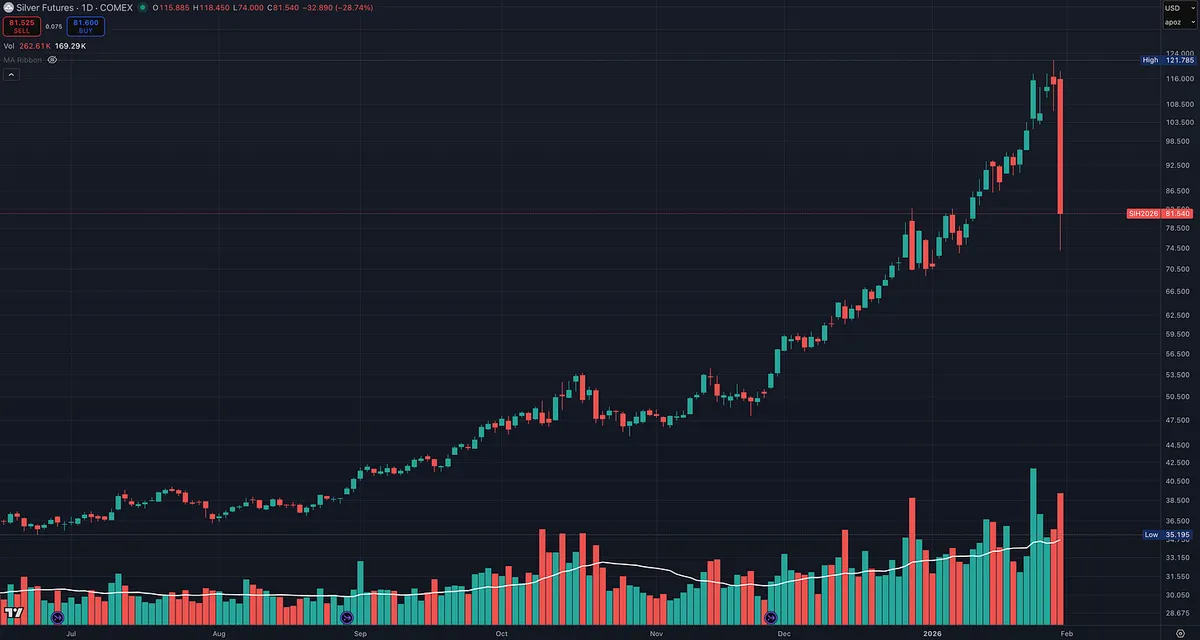
A Lesson From Silver

A good reminder on the dangers of buying blindly into parabolic moves.

Silver is down nearly 30% today.

Markets rarely go straight up forever. They usually climb the stairs on the way up and fall out a window on the way down.

Parabolic moves feel safest at the top because everyone agrees. That’s usually when risk is highest.

This is why cutting losses quickly matters. This is why chasing extended price action rarely ends well.

Strong trends reward patience on the way up. They punish complacency on the way down.

Respect risk. Always.

View on Substack ↗

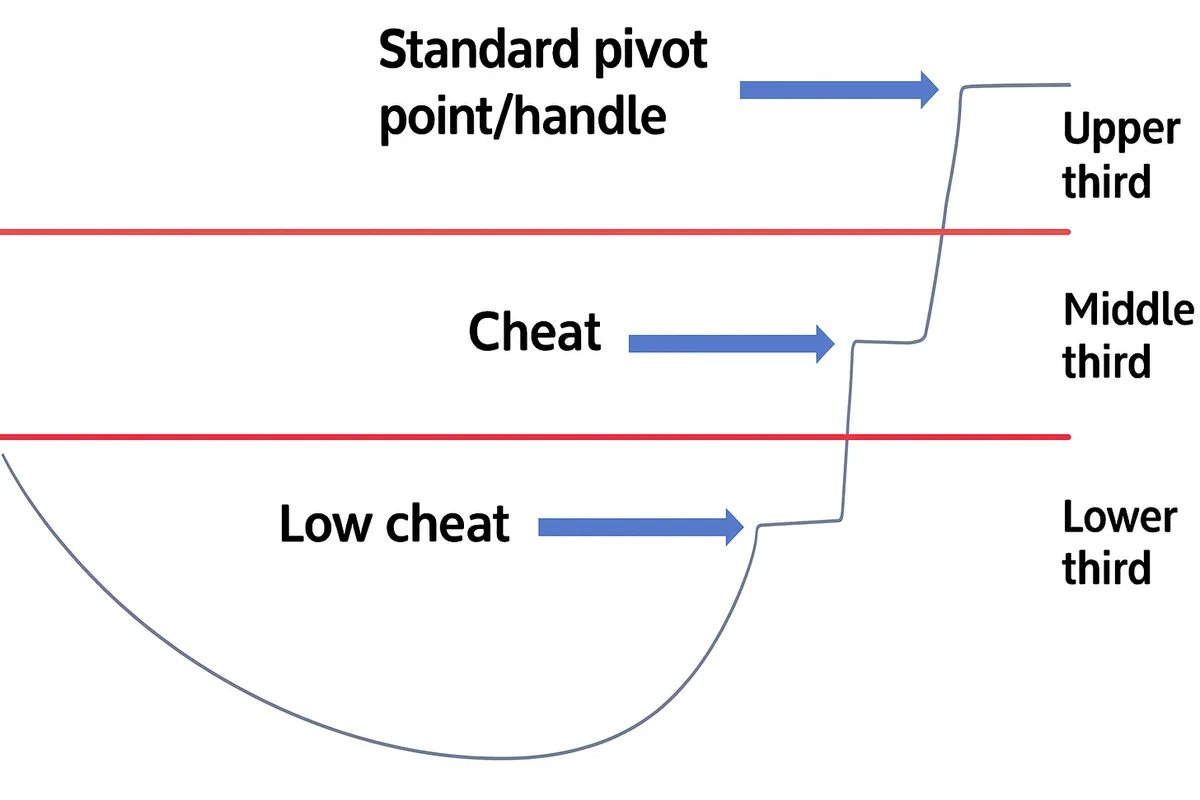
Different Entry Methods I Learned in Minervini’s Master Trader Program

There isn’t just one way to buy a base.

Strong stocks often give multiple entry opportunities, each with a different risk profile.

Low cheat. Early entry near the lower third of the base. Highest failure rate, smallest dollar risk, biggest upside if it works.

Middle cheat. Entry as price tightens in the middle of the base. Better confirmation, still favorable risk to reward, often near moving average support.

Standard pivot or handle breakout. Upper third entry. Highest probability of follow through in the right market, but widest stop and most risk if it’s your first entry.

The key is not which entry is “best.”

The key is understanding how each one changes risk, position size, and trade management.

View on Substack ↗

Study This Chart. This Is Leadership.

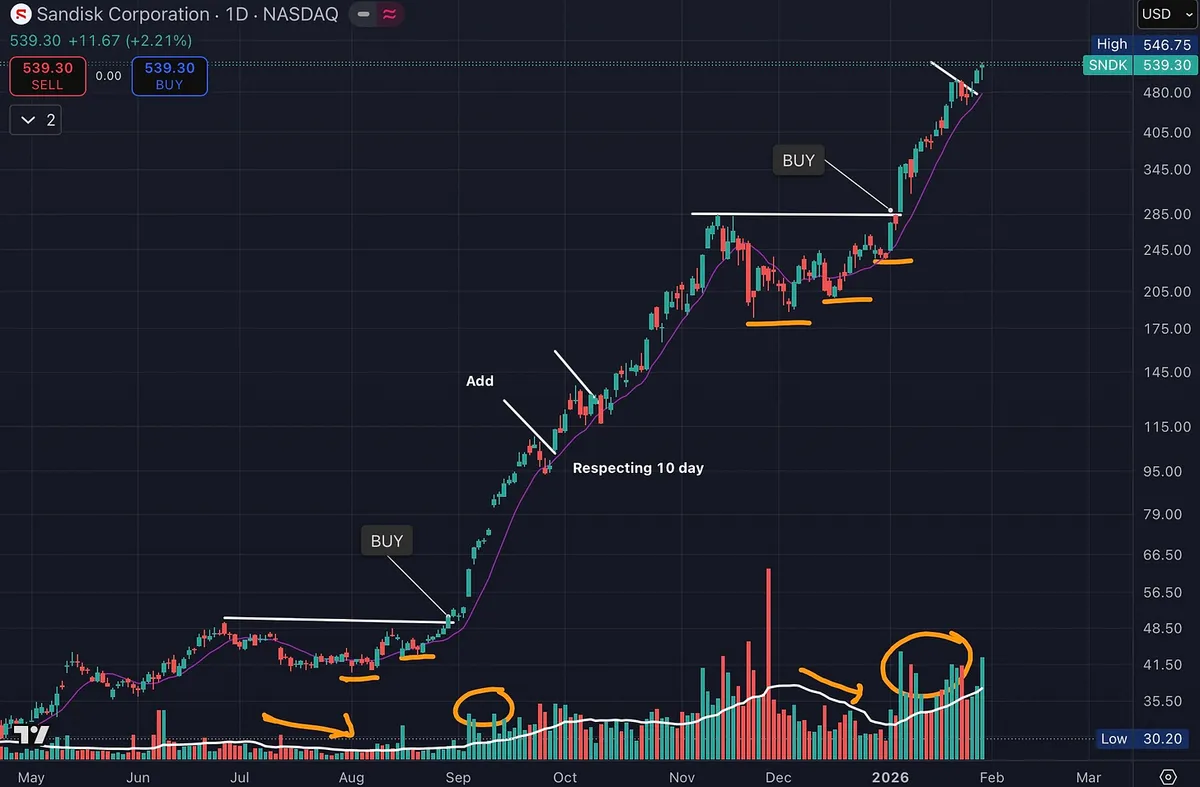
One area that has quietly dominated since the April correction is data storage, a key part of the broader AI theme.

SNDK is a great example.

The fundamentals are there.

High relative strength.

Earnings and sales acceleration.

Rapid increase in fund ownership.

But the real lesson is in the chart.

Price exploded higher on heavy volume. That’s institutional demand showing its hand.

Then price paused.

Volume dried up during consolidation. Pullbacks stayed shallow. The right side tightened up. Sellers stepped aside.

Price respected the 10-day moving average with a smooth, orderly advance. No volatility. No panic. Just controlled strength.

Then it did it again.

Another tight consolidation.

Another dry-up in volume.

Another expansion higher on strong volume.

This is textbook supply and demand in action.

Strong stocks don’t give back much. They move up, rest, absorb supply, and continue higher. That’s exactly what’s happening here.

And this wasn’t a one-off.

The category gave it away. Other data storage names were acting the same way. When multiple leaders in a group show identical behavior, pay attention.

This is the kind of chart that should be studied over and over.

Not because it’s perfect.

But because it clearly shows where risk is defined and why big trends are built the way they are.

Charts like this are how you learn to recognize real leadership.

Study this.

View on Substack ↗

When Volume Pauses After Power, Pay Attention

This is one of my favorite setups.

First, you get a strong upside move on expanding volume. That tells you demand is real. Institutions are involved.

Then price goes sideways.

But notice what changes.

Volume dries up during the consolidation. Pullbacks are shallow. Lows stay higher. Sellers are not aggressive. Supply is being absorbed.

This is where risk shrinks.

As price compresses near highs, you can enter near the prior higher low with a clearly defined stop. If you’re wrong, you’re out quickly. If you’re right, the breakout can travel far.

This aligns closely with Minervini style trend structure and volume price analysis.

Minervini looks for strength followed by tight price action and low volatility.

Volume price analysis looks for effort on the move up, then reduced effort as supply disappears.

Different frameworks. Same message.

Do these work every time? No.

Do I get stopped out? Yes.

Do some breakouts fail fast? Absolutely.

But when they work, they pay for the losers and then some.

Good trading is not about being right often.

It’s about structuring trades where risk is small and upside is asymmetric.

That’s what charts like this make possible.

View on Substack ↗

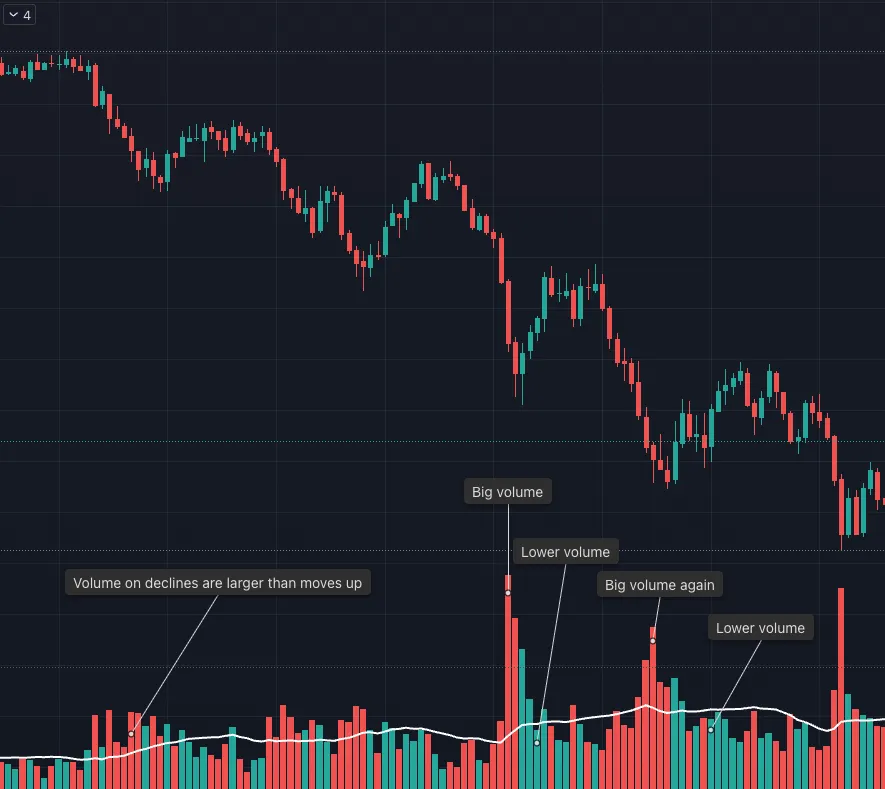
Price Tells the Truth. Volume Confirms.

This is not complicated.

Price is making lower highs and lower lows. That is the definition of a downtrend.

Now look at the volume.

Down moves are occurring on expanding volume. Up moves are happening on lighter volume.

That tells you who is in control.

Sellers are aggressive. Buyers are passive.

Rallies are being sold, not accumulated. Bounces lack commitment and fail quickly. Each push higher is weaker than the last.

There is no reason to outsmart this.

You do not need a prediction. You do not need a narrative. You do not need to call a bottom.

You simply follow what price and volume are confirming.

Lower highs. Lower lows. Heavy volume on declines. Light volume on rallies.

Very simple.

Do not fight it.

Trade with the trend, not your opinion.

View on Substack ↗

When Everyone Called the Top, Price Gave Another Buy

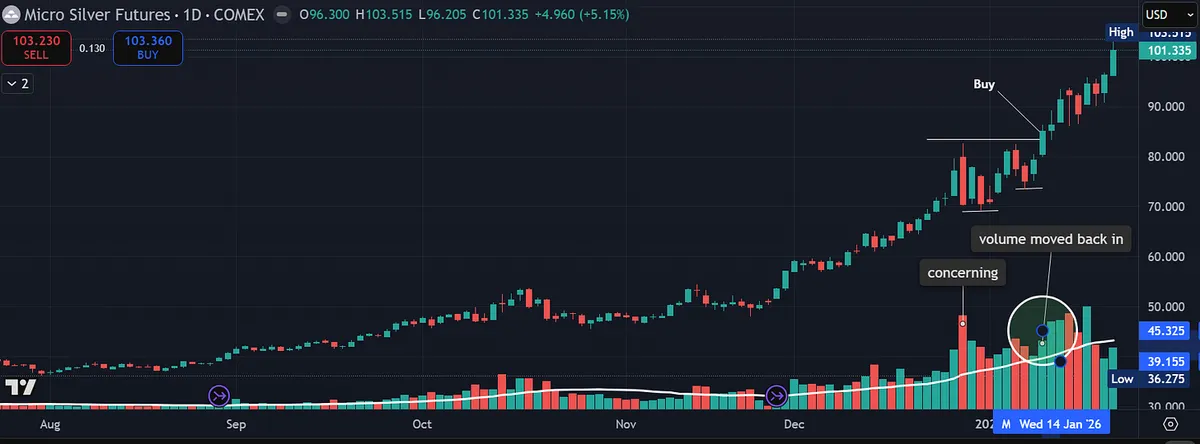
Just a few weeks ago, most people were convinced silver had topped.

That belief felt logical. The move had already been strong. Sentiment was crowded. Commentators were confident. And yet, price did not confirm it.

This is the real lesson.

Your job is not to predict. Your job is to stay neutral and let price and volume determine your actions.

Instead of breaking down, silver did something constructive. Price tightened. Selling pressure eased. Then volume moved back in as price turned higher and pushed through resistance. That action gave another clean entry, even when most people thought the move was finished.

The chart did not argue. It simply offered information.

Trying to call tops is not the game. Following price and volume is.

Yes, silver will eventually top. Every trend does. But fighting a strong trend before price confirms weakness rarely pays. Strength tends to persist longer than most expect.

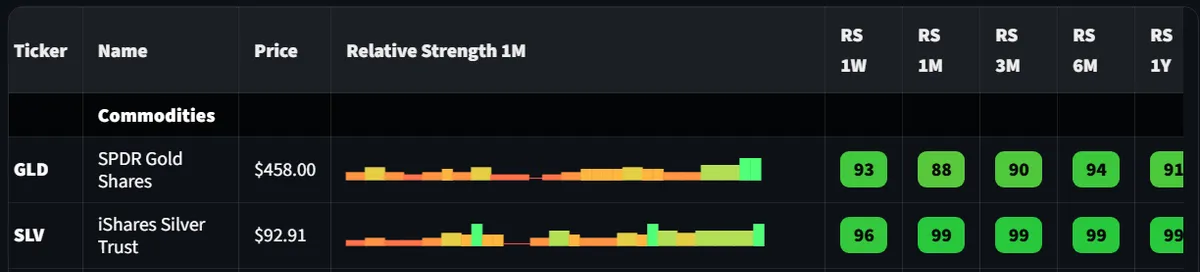
Relative strength in silver has been excellent across multiple timeframes, and the industry group continues to act like a leader. As long as that remains true, the path of least resistance stays higher.

Trade what you see. Not what you believe should happen.

View on Substack ↗

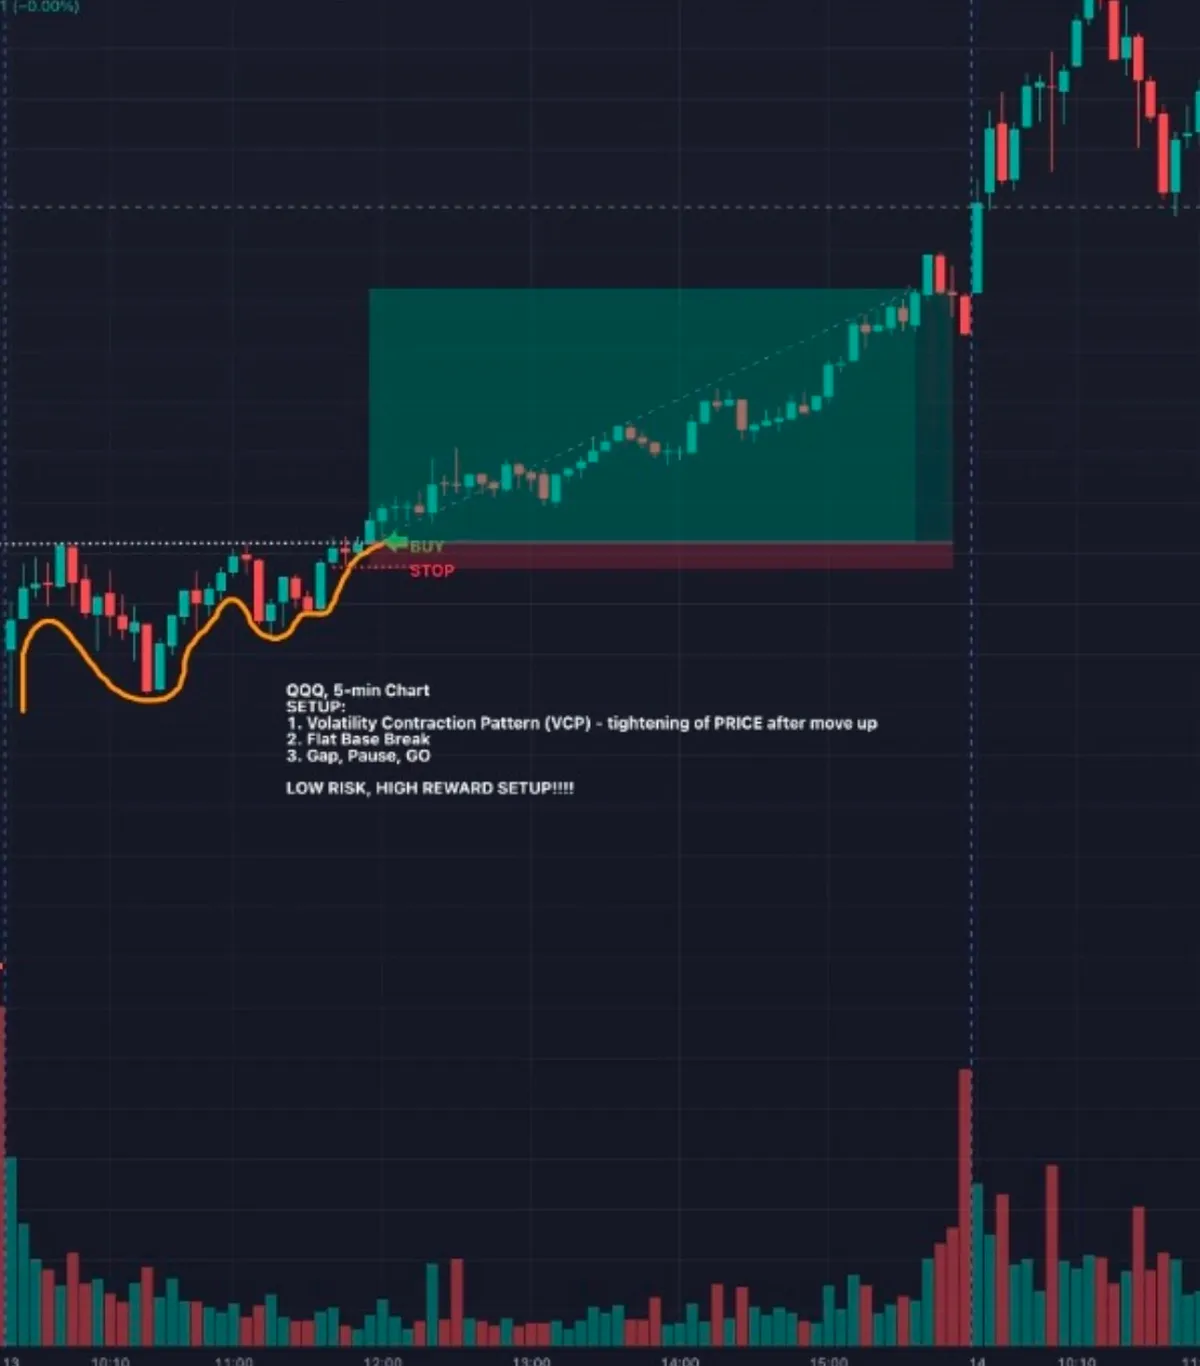
The Pullback That Pays

One of the cleanest and lowest risk setups you will ever see.

A big move up on heavy volume.

Then something important happens. Price begins to contract. The pullback is orderly. Volume dries up. Selling pressure fades instead of accelerating. You often see a series of higher lows, even while price moves sideways.

That combination matters.

It tells you the move is being absorbed, not rejected.

When price finally breaks out above the prior high and volume starts to move back in, you get the next leg higher.

This is one of the best low risk, high reward setups in trading.

Risk is tight. The invalidation point is clear. If it fails, you are out quickly. If it works, the upside can be significant.

These setups are rare, which is what makes them valuable. You cannot force them. You wait. You prepare. You act when price confirms.

The best part, this works on all timeframes. Intraday, swing, position. The structure does not change.

Rare, but gold.

View on Substack ↗

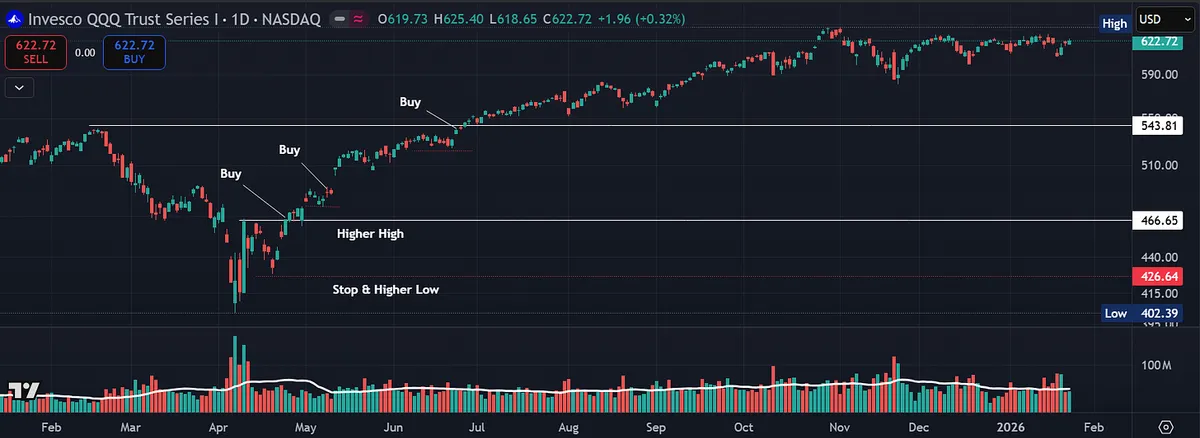
This Is Not Bottom Fishing. It’s a Character Change.

This chart is not an example of buying because price looks cheap.

That is how people get trapped.

What matters is the change in character.

Buying the break of the prior high, with a stop below the higher low, is what defines risk.

These are often the best low-risk, high-reward opportunities.

They occur off lows and at new highs, when many are still trying to short and assume the move cannot continue.

The goal is not to guess the bottom. The goal is to wait for the market to prove the trend has changed.

View on Substack ↗

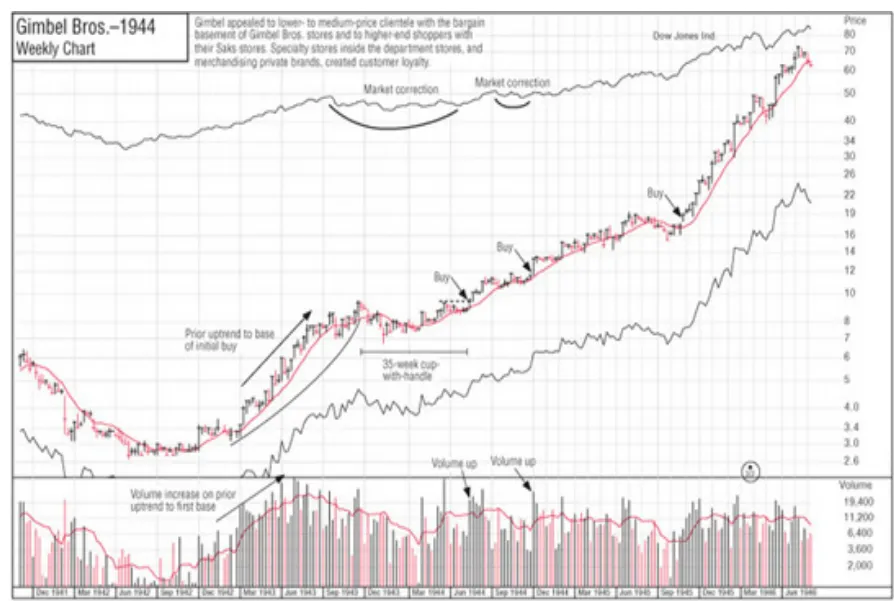
Nothing in the Market Is New

O’Neil studied winners going back to the 1880s.

What shocked him was not change. It was sameness.

  • Cup with handle.

  • Flat base.

  • Double bottom.

“The patterns you see today were there 20, 40, 60, even 100 years ago.”

Different companies. Different industries. Same structure.

View on Substack ↗

Why Charts Matter More Than Predictions

One of the biggest misunderstandings about charting is that it is about predicting the future.

It is not.

Charts exist to help us define risk.

Markets do not move in straight lines. They move in swings. Advances and pullbacks. Higher highs and higher lows in uptrends. Lower highs and lower lows in downtrends.

This behavior shows up everywhere.

On monthly charts. On weekly charts. On daily and intraday charts.

The structure looks different in size, but not in nature.

This is what people mean when they say markets are fractal.

The same stair step behavior repeats across all timeframes.

That repetition is not random. It is the result of human behavior cycling between optimism and fear.

This is why technical frameworks like Elliott Wave matter, not because they forecast exact prices, but because they help identify structure.

And structure is what allows us to do the most important thing in trading.

Manage risk.

Paul Tudor Jones once explained it this way:

“The reason he has been so successful is that the Elliott Wave theory allows one to create incredibly favorable risk/reward opportunities. That is the same reason I attribute a lot of my own success to the Elliott Wave approach.”

Notice what he emphasized.

Not prediction. Not certainty. Risk and reward.

When markets move in waves, they naturally create logical areas where a trade idea is wrong.

That is why we use charts to define a clear buy and a clear stop.

The entry aligns with strength and structure. The stop defines where the pattern breaks.

If the pattern holds, the upside can be many multiples of the risk. If it fails, the loss is small and controlled.

This is where the fractal nature of markets becomes a tool, not a theory.

A pullback on a daily chart functions the same way as a pullback on a weekly chart. A breakout failure looks the same across timeframes.

That consistency is what allows traders to survive long enough to compound.

Charts are not about being right. They are about knowing when you are wrong.

View on Substack ↗

Why Stock Screens Find Candidates but Charts Find Winners

One of the biggest mistakes traders make with stock screening is treating it like a final answer instead of a starting point.

Screens are powerful.

They narrow the universe.

They save time.

They force discipline.

Every great trader uses them.

But screens alone do not make you money.

Mark Minervini talks extensively about screening for strength, earnings, sales, and leadership. What often gets missed is what comes next. Screening is only the first filter, not the decision.

Even today, with AI, algorithms, and real time data, nothing replaces visually screening stocks yourself.

Charts reveal things screens cannot:

- Tight price action

- Volatility contraction

- Subtle accumulation

- Clean support behavior

- Where risk is actually defined

Screens are binary. Charts are contextual.

Another common mistake is taking screening criteria too far.

Make your rules too strict and you eliminate future leaders before they ever have a chance to appear. Many great stocks do not look perfect yet. They evolve into leaders.

A stock may meet 9 out of 10 requirements and still become a major winner, but you will never see it if your filters demand perfection. That is why separating scans matters.

Run one scan for relative strength.

Run one for earnings and sales.

Run one for price action.

Sometime you will see the same names on multiple scans, which can be a powerful signal.

Looser screens do not lower standards. They allow you to spot leaders earlier, before the crowd.

Make your rules too loose and you drown in noise.

The goal is balance.

Use screens to find potential.

Use charts to confirm behavior.

Use judgment to decide timing and risk.

This approach is not new. Minervini did not invent it. He refined it by studying the same greats who came before him.

This is why trading is both an art and a science. There is no perfect formula I can give you, but this may help you recognize whether your screening is too strict or not strict enough.

View on Substack ↗

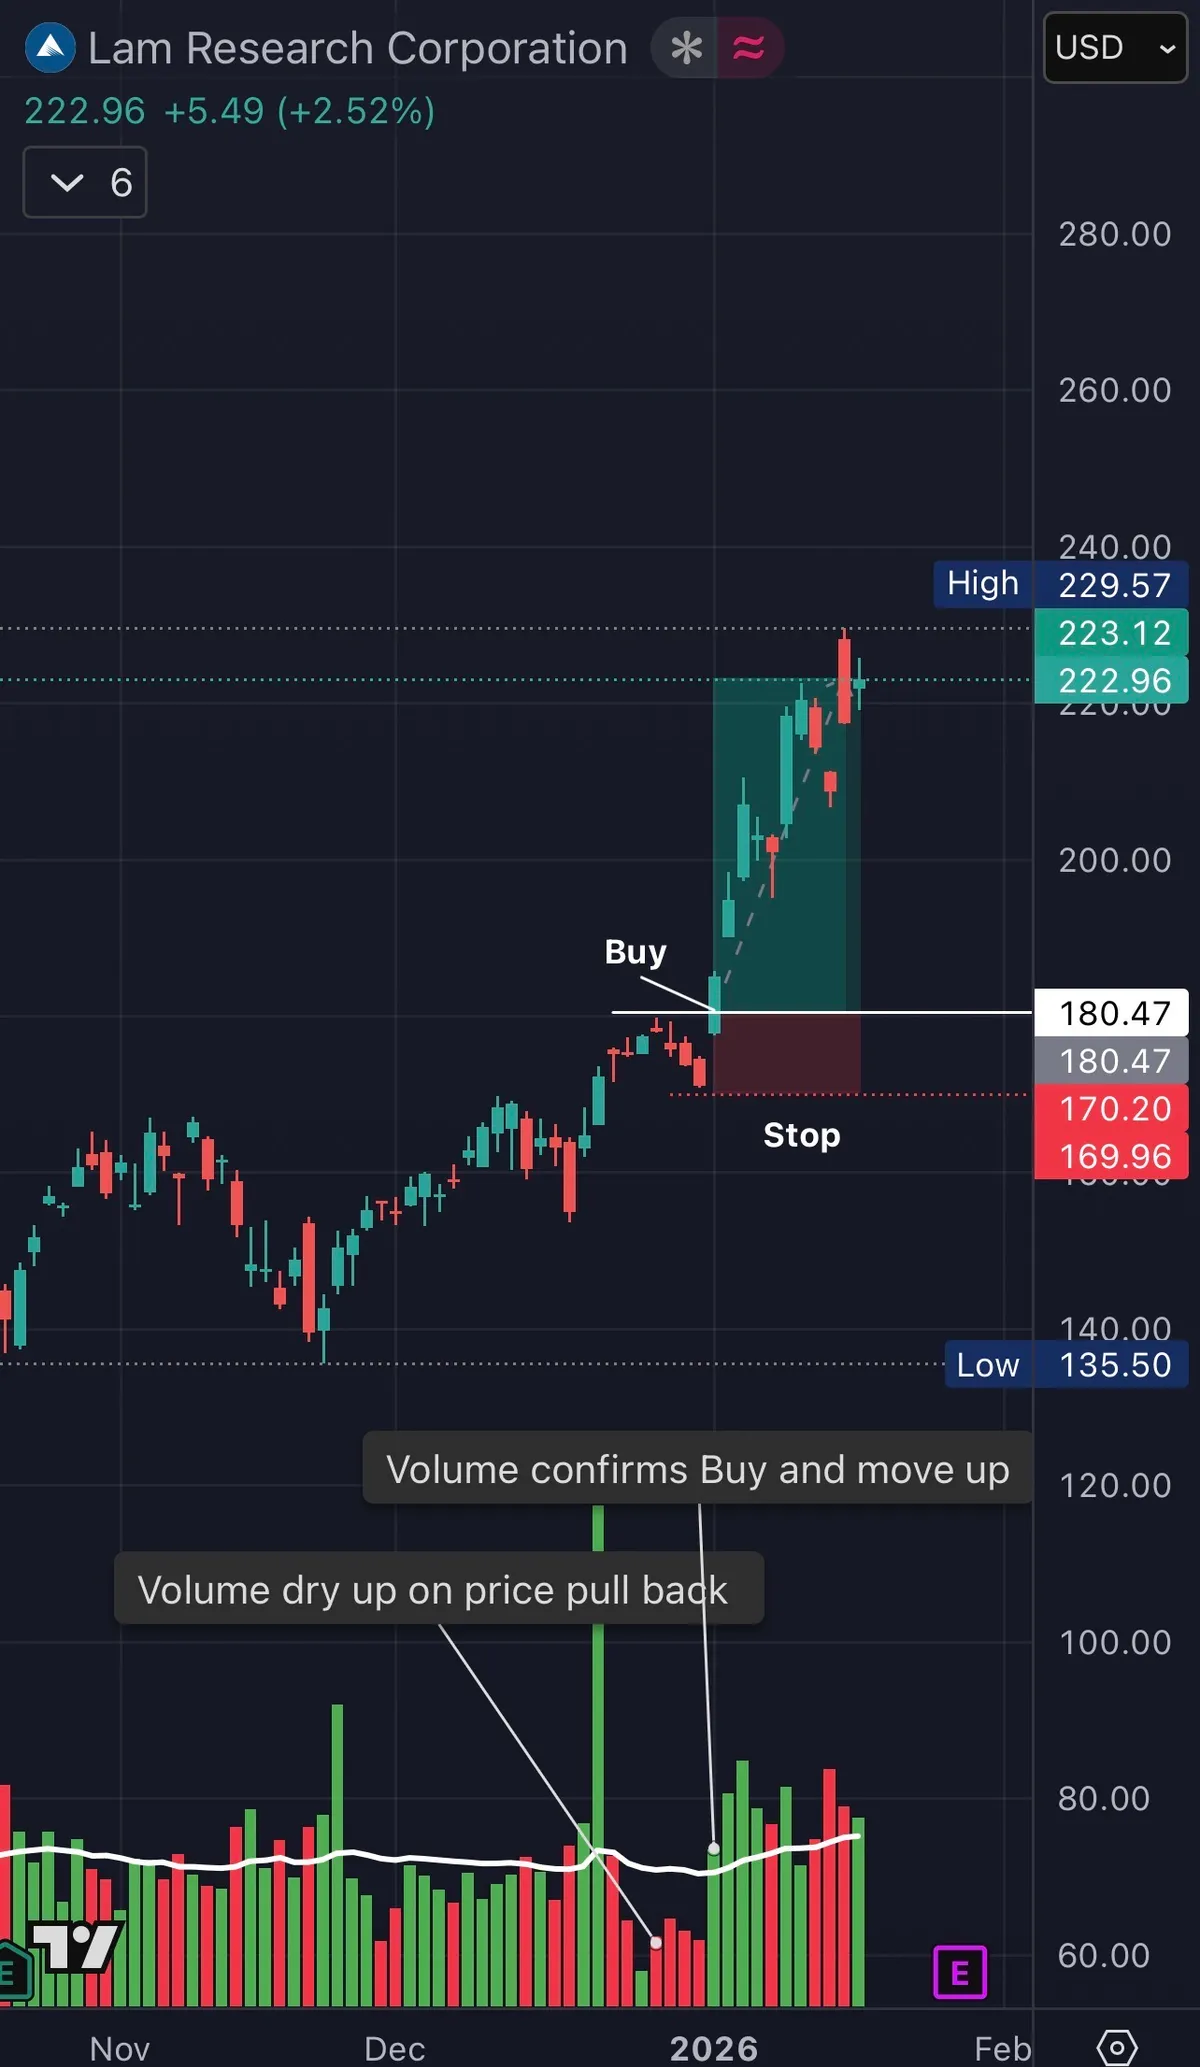
LRCX: A Textbook CANSLIM Leader With Ideal Price and Volume Action

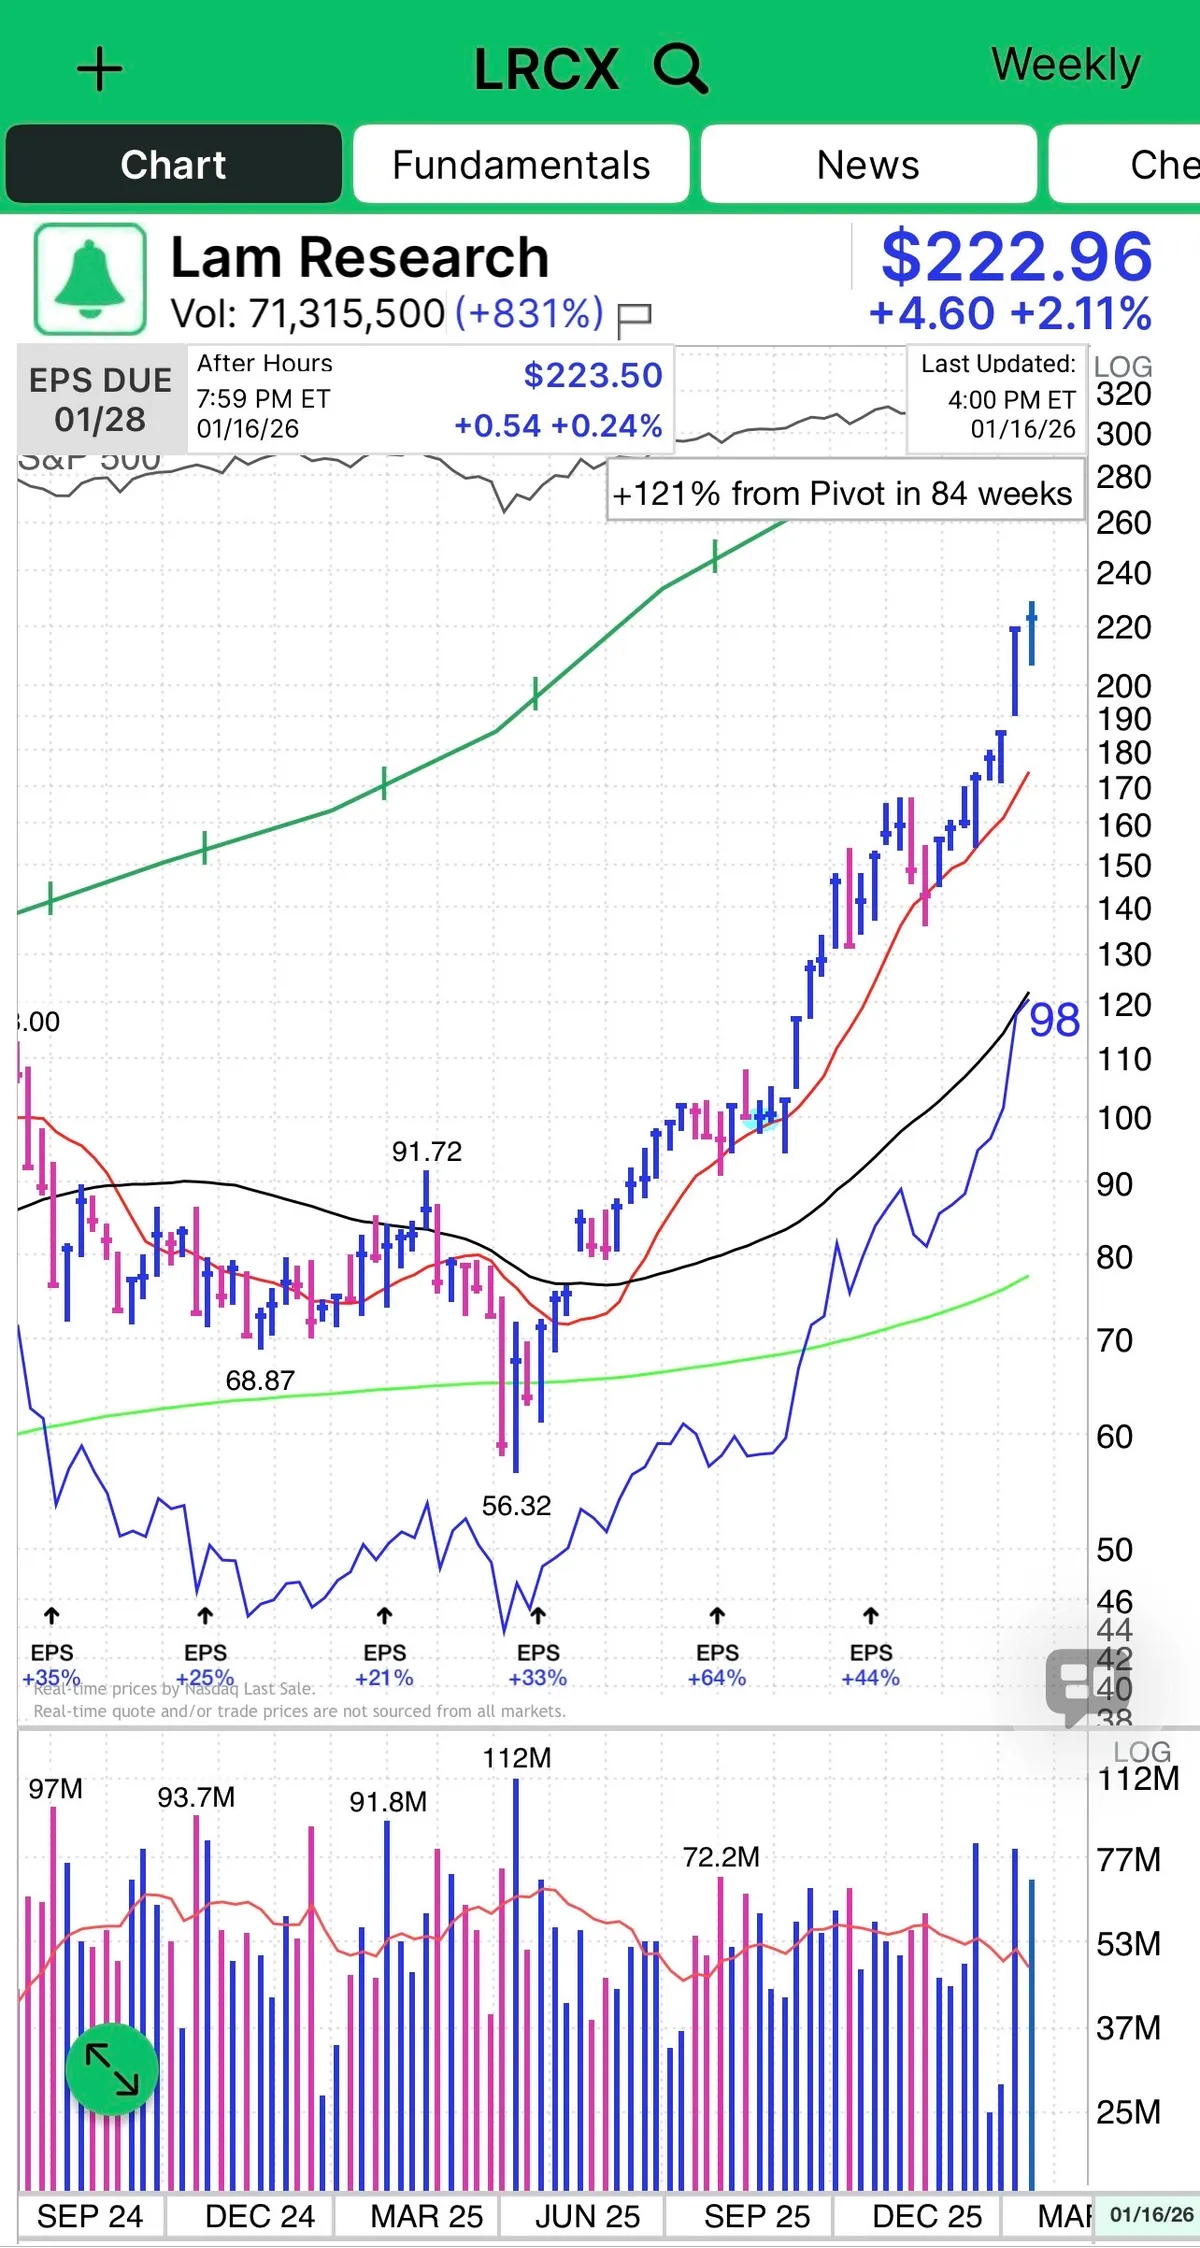
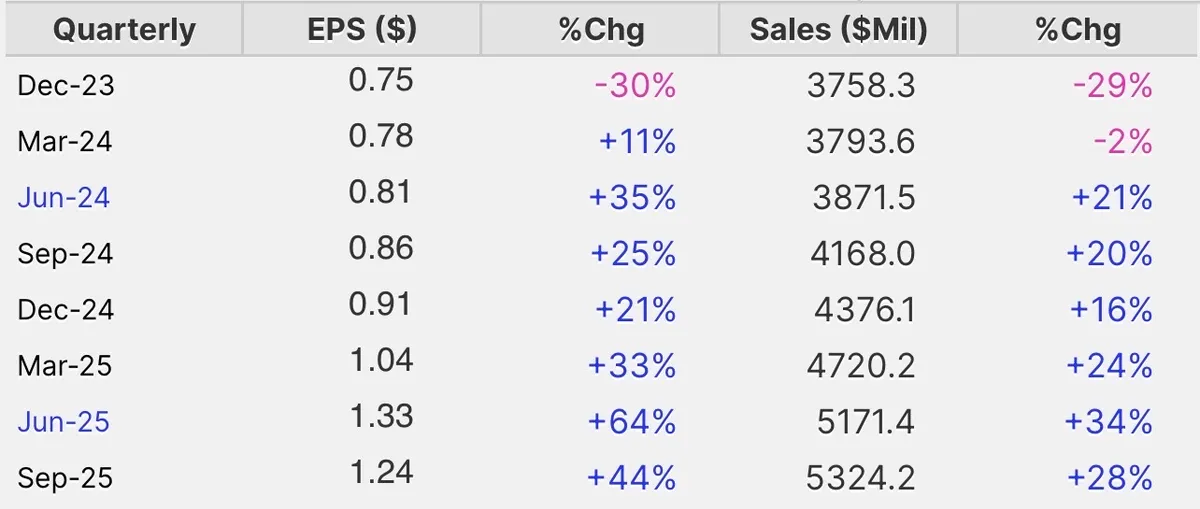
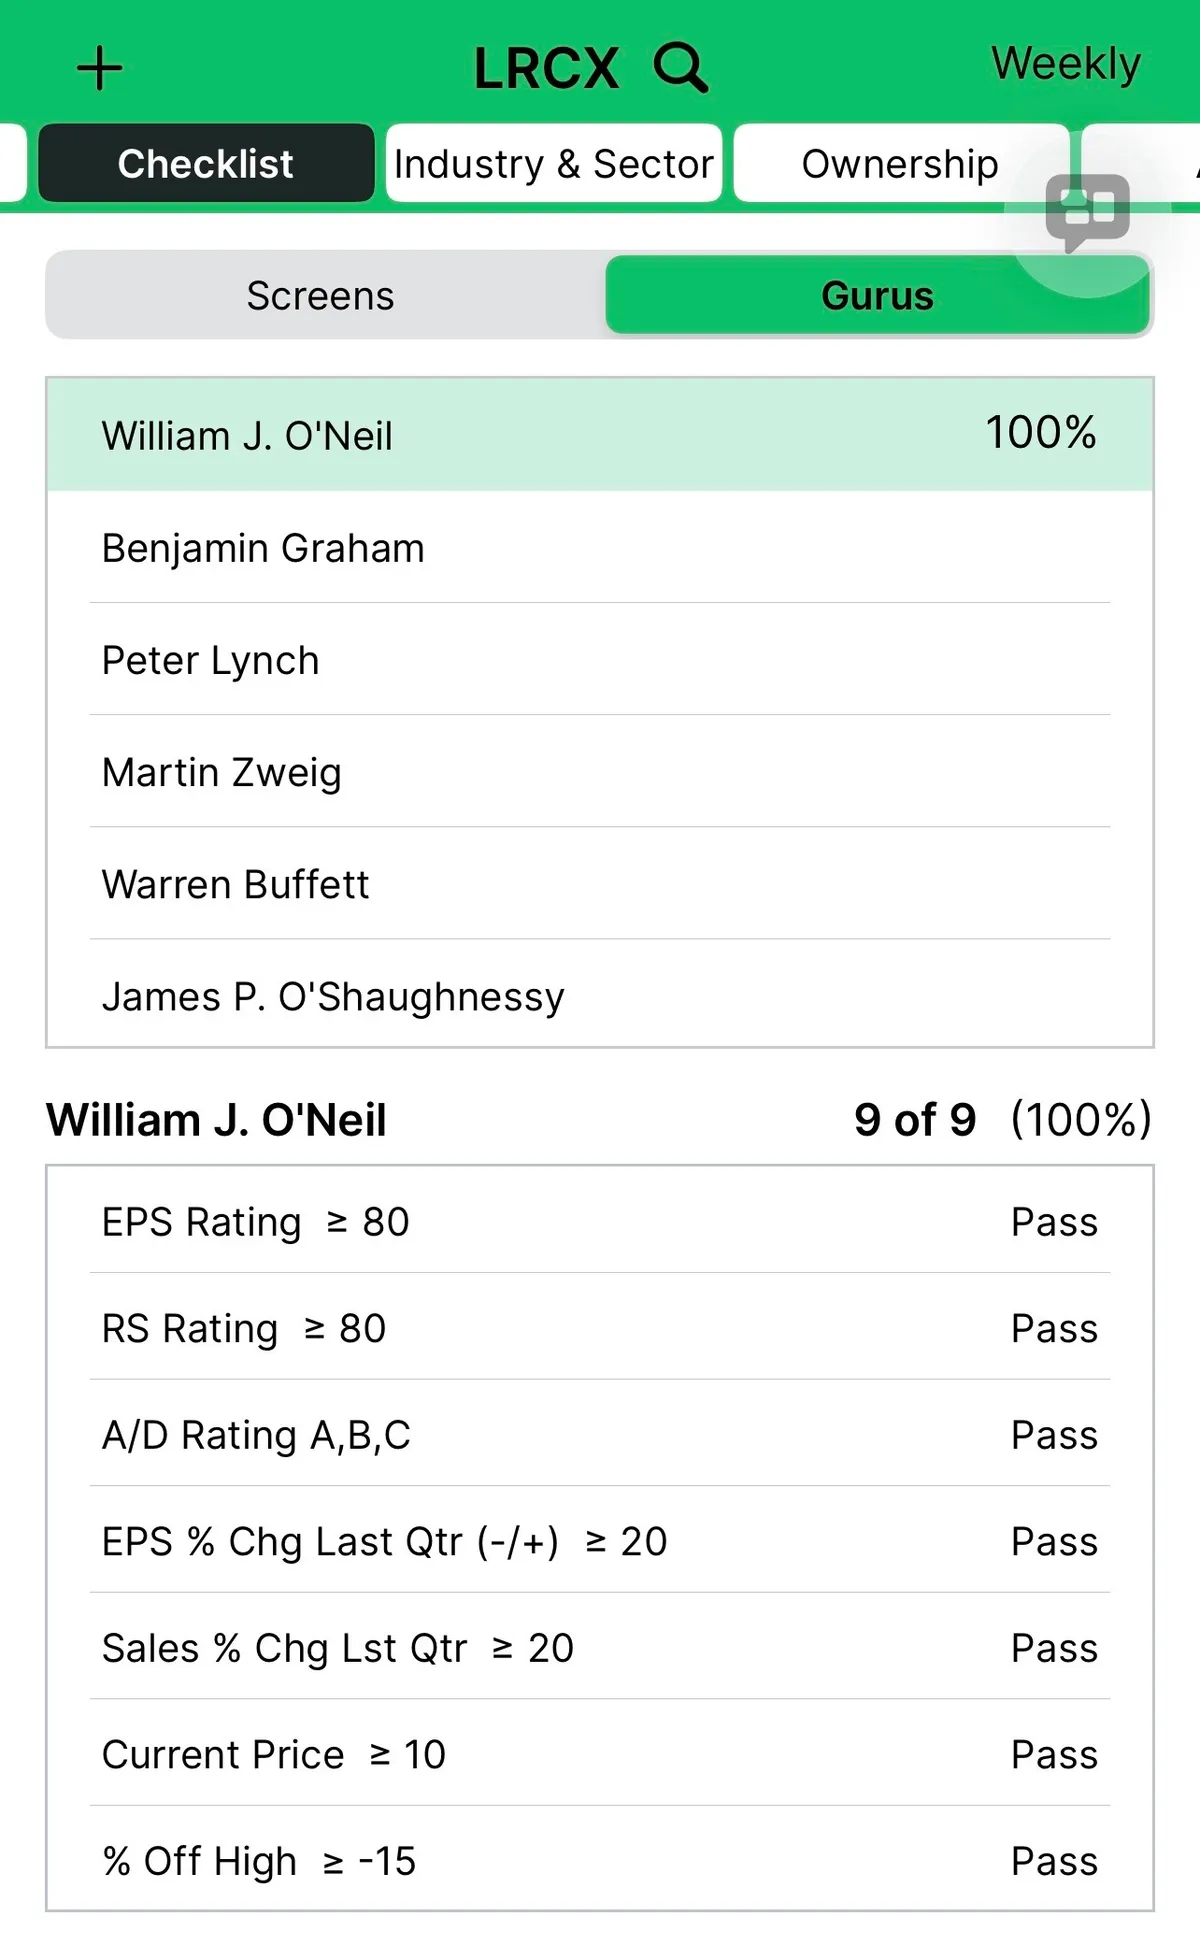
Lam Research is a textbook CANSLIM name and a clean example of how price and volume tell the story before headlines do.

This is what leadership looks like.

  • Strong earnings and sales growth.

  • High ROE.

  • RS in the upper 90s.

  • Institutional sponsorship building.

  • Industry group strength tied directly to the AI Theme.

But the real tell is the volume price relationship.

You get volume drying up on pullback.

You get volume confirmation on the breakout.

Strong chart on the weekly and daily timeframe.

That combination is not random. That is professional accumulation.

This is how winners behave:

  • Demand shows up when price moves up

  • Supply disappears when price pulls back

  • Relative strength expands before most traders notice

Semiconductor equipment is one of the engines behind this bull cycle, and LRCX sits right in the middle of the AI buildout. When a stock checks every CANSLIM box and then confirms it with clean volume behavior, you pay attention.

This is not prediction.

This is recognition.

Price action is bullish with higher highs and higher lows. Volume is an indicator and confirms the move. Fundamentals support.

That is how real leaders are identified.

View on Substack ↗

The Market Is Already Talking. Most Investors Are Not Listening.

It still amazes me how many investors do not use charts.

Charts show what the market actually thinks. Not opinions. Not narratives. Not predictions.

Every indicator is built from price and volume. So why not study price and volume directly?

Charts show supply and demand in real time. They reveal crowd psychology as it unfolds. They make strength, weakness, and risk visible.

Price is the only thing that ever makes you money. And price is right there on the chart.

I am not saying fundamentals do not matter. They can help shape your thesis. But leaving charts out of the process hurts performance for most investors.

Because you are choosing to ignore the one thing that reflects all information, emotion, and decision making in the market.

I will leave you with this from William O’Neil:

“Most investors think that charts are hocus-pocus. Only about 5 to 10 percent of investors understand charts. Even a lot of professionals are totally ignorant about charts. Just as a doctor would be foolish not to use X-rays and EKGs, investors would be foolish not to use charts.”